
Becoming data-driven by mastering business analytics

Globally, an increasing amount of data is produced every year. Organizations recognize the need to capture the value from this data but often fail to realize their ambitions. Business analytics is needed to analyze the data and generate valuable outputs. Business analytics can be divided into three categories: descriptive, predictive, and prescriptive analytics, each having their own enablers, issues and use cases. To become a highly mature data-driven organization, it is vital to lay a solid foundation that supports these distinct kinds of analytics.

Introduction

The global pandemic has affected our world in many ways. Everyone has experienced the dramatic effect that the pandemic has had on our personal lives. The effects have also been enormous for organizations around the world. Organizations have been forced to work remotely and have become even more dependent on technology. In a recent IDG study among approximately 2000 IT leaders, nearly 25% of the participants said that the pandemic has accelerated plans to improve their use of data analytics and intelligence ([IDG21]).

This clearly shows that the pandemic is an accelerator for a trend that has been ongoing for a while. Algorithms for predictive and prescriptive analytics have been around for decades, but only recently the amount of data is becoming enough to apply them in widely among industries, and the amount of data that is being generated continues to grow. After the online data explosion caused by COVID, the introduction of 5G and the rising numbers of operational IoT (Internet of things) devices will result in another rapid increase in the amounts of data that are produced every day. By 2030, 6G networks are expected to reach speeds of 1 terabyte per second and internet delivered via satellites will both accelerate the movement of data and reduce latency, opening the door for more advanced real-time analytical use cases. A growing number of organizations recognize this trend and are increasing their investment in analytics, aiming to improve their performance and gain a competitive advantage. In 2016, the global big data and business analytics market was valued at $130.1 billion. In 2020, this increased to more than $203 billion, at a compound annual growth rate of 11.7% ([Pres20]).

However, while most organizations acknowledge the need to become more data-driven, many of them fail to achieve the goals they are aiming for. 48% of organizations expect a significant return from investments in data & analytics within the next 3 years ([KPMG19a]). While 36% of organizations prioritize investments in data & analytics, only 25% of these initiatives have been successful ([KPMG19a]).

C-2021-2-DeBie-01-klein

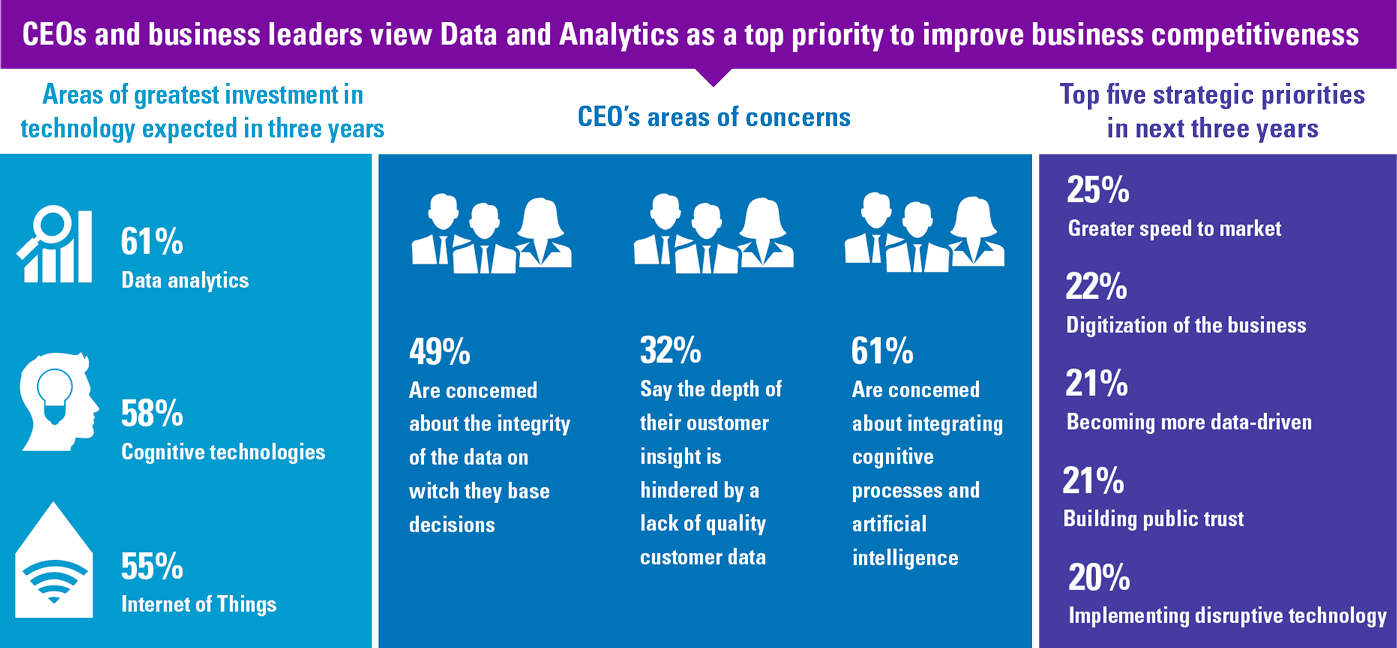
Figure 1. CEO’s view on D&A. [Click on the image for a larger image]

While most organizations are struggling to become more data-driven, there are examples that have beaten the odds and have shown that is possible to capture value from analytics and use their analytical insights to create a competitive advantage.

One of these examples is the Dutch online supermarket Picnic. Picnic built analytics into the core of their business. Decisions within organizations are increasingly and primarily based on data. Algorithms are used to calculate the exact need of personnel in warehouses and the fleet of delivery cars. The prices on the website are dynamic and based on competitor prices and demand. The product offering is based on a upvoting system and products are removed when they are not popular enough, to make room for more popular products. Picnic even uses data gathered from the delivery trucks to monitor safe driving Key Performance Indicators (KPIs), which have led to an almost 30% drop in harsh corners and speeding time. The rapid growth of Picnic is clearly fueled by being data-driven and making decisions based on analytics.

Descriptive, predictive, and prescriptive analytics

The need to utilize the full potential of the ever-increasing amounts of data has led to a remarkable evolution of technologies and techniques for storing, analyzing, and visualizing data. Due to innovations within business analytics, three distinct levels of analytics have emerged: descriptive, predictive, and prescriptive analytics.

C-2021-2-DeBie-02-klein

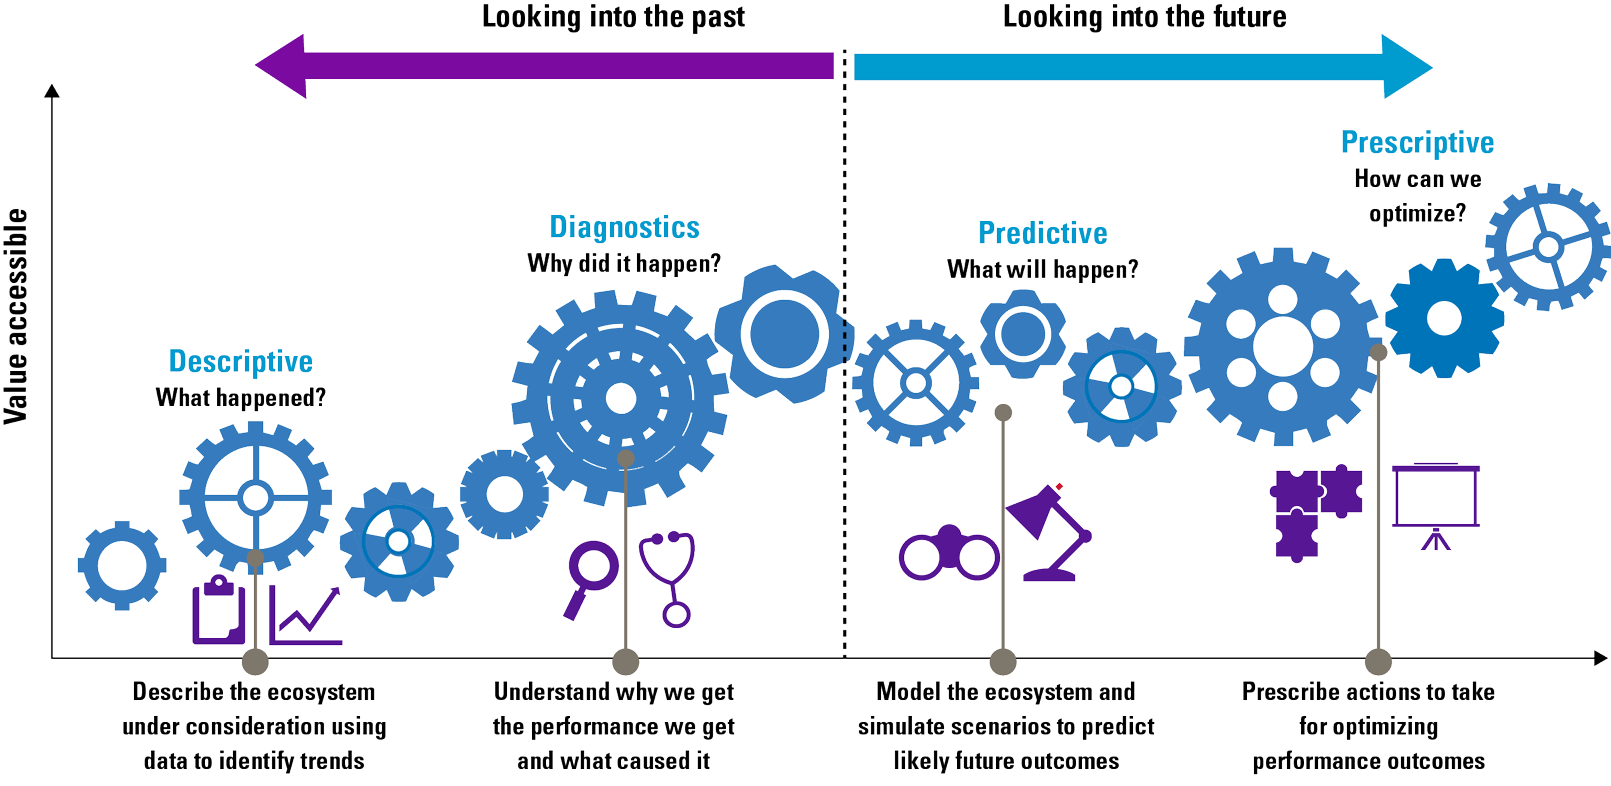
Figure 2. Descriptive, diagnostic, predictive and prescriptive analytics. [Click on the image for a larger image]

Descriptive analytics

Descriptive analytics enable organizations to understand what happened in the past. Descriptive analytics is considered to be the “data summarization phase.” This kind of analytics summarizes raw data and answers the question “What has happened?” Within descriptive analytics, the subcategory diagnostic analytics tries to answer the question “Why did it happen?” Descriptive analytics makes use of simple periodic business reporting, ad-hoc reporting and OLAP techniques. The main objective of descriptive analytics is the identification of business problems and opportunities. Descriptive analytics is also often used for compliance and reporting purposes. Descriptive analytic outcomes tell you how much revenue you have generated last month and what the bestselling items were.

Predictive analytics

Predictive analytics tries to build sufficiently accurate models that predict the future by applying simulation techniques and machine learning algorithms to data. Organizations use predictive analytics to answer the questions “What will happen?” and “Why will it happen?”. Predictive analytics helps organizations to identify future risks and opportunities by extracting specific patterns from historical data. The volume of available data influences the quality of predictive analytics. When more data is available, models can be validated better, which can lead to more accurate predictions. Common methods and techniques that are used in predictive analytics are text/media/web mining, data mining, and forecasting methods. These methods are used to discover predictive and explanatory patterns (trends, affinities, associations, etc.) that represent inherent relationships between the input data and the output. The main objective of predictive analytics is to provide an accurate projection of future happenings and the reasoning as to why.

Amongst other things, predictive analytics can be used for cross-selling, prospect ranking, demand forecasting and customer retention. VodafoneZiggo is one of the organizations that successfully uses predictive analytics for customer retention. Every time there is a customer contact moment, data is gathered which tells them what they need, what they expect and whether they are satisfied. This information is used to improve their service provision ([Voda20]).

Prescriptive analytics

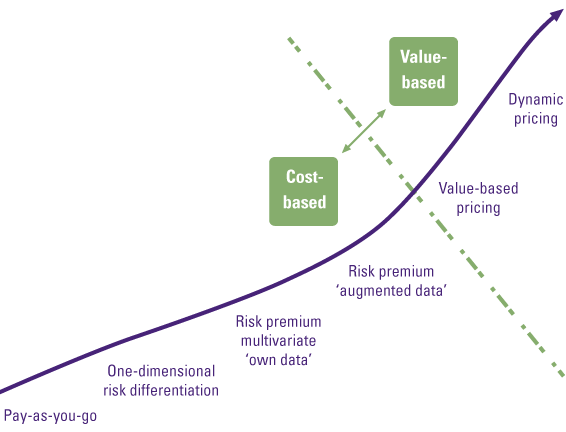
Prescriptive analytics prescribes the best decision option and illustrates the implications of each decision option to take advantage of the future. Prescriptive analytics incorporates the outputs generated by predictive analytics and uses optimization algorithms, artificial intelligence, and expert systems in a probabilistic context to present automated, adaptive, time-dependent, and optimal decisions. Prescriptive analytics can provide two kinds of output: decision support, which provides recommendations for actions, or automated decisions, in which case the algorithm executes the prescribed actions autonomously. Prescriptive analytics is the most advanced category of analytics and has the potential to offer the greatest intelligence and business value. How well the mathematical models incorporate a combination of structured and unstructured data and capture the impacts of decisions, determines the effectiveness of the prescriptions. Prescriptive analytics is a promising and emerging field of data analytics but is still very immature and not often adopted in organizations.

Possible use cases are dynamic pricing and production, marketing, or logistic optimization models. Ahrma is a Dutch technology firm that is revolutionizing the logistics industry by making use of IoT transponders. Ahrma produces pallets with IoT transponders that send data about locations, temperature, and weight. This data is summarized in a real-time dashboard which provides real-time insights in the logistic processes of Ahrma’s clients. Ahrma is taking its analytics to a new level. Together with KPMG, they are developing a prescriptive logistic optimization model that will benefit both Ahrma and its clients by decreasing costs and CO2 emissions and optimizing efficiency.

The building blocks of a solid analytics foundation

Each level of analytics requires a more mature and capable organization. This maturity should be in place for both the supply side, which is delivering insights, and the ‘consumer’ side, which is making business decisions. But organizations experience many barriers in their journey to improve their organizational (D&A) maturity.

Global KPMG research in 2019 has identified the most common issues that (financial) organizations experience, which is to a large extent representative for other large organizations that cope with many legacy applications and legacy data.

C-2021-2-DeBie-03-klein

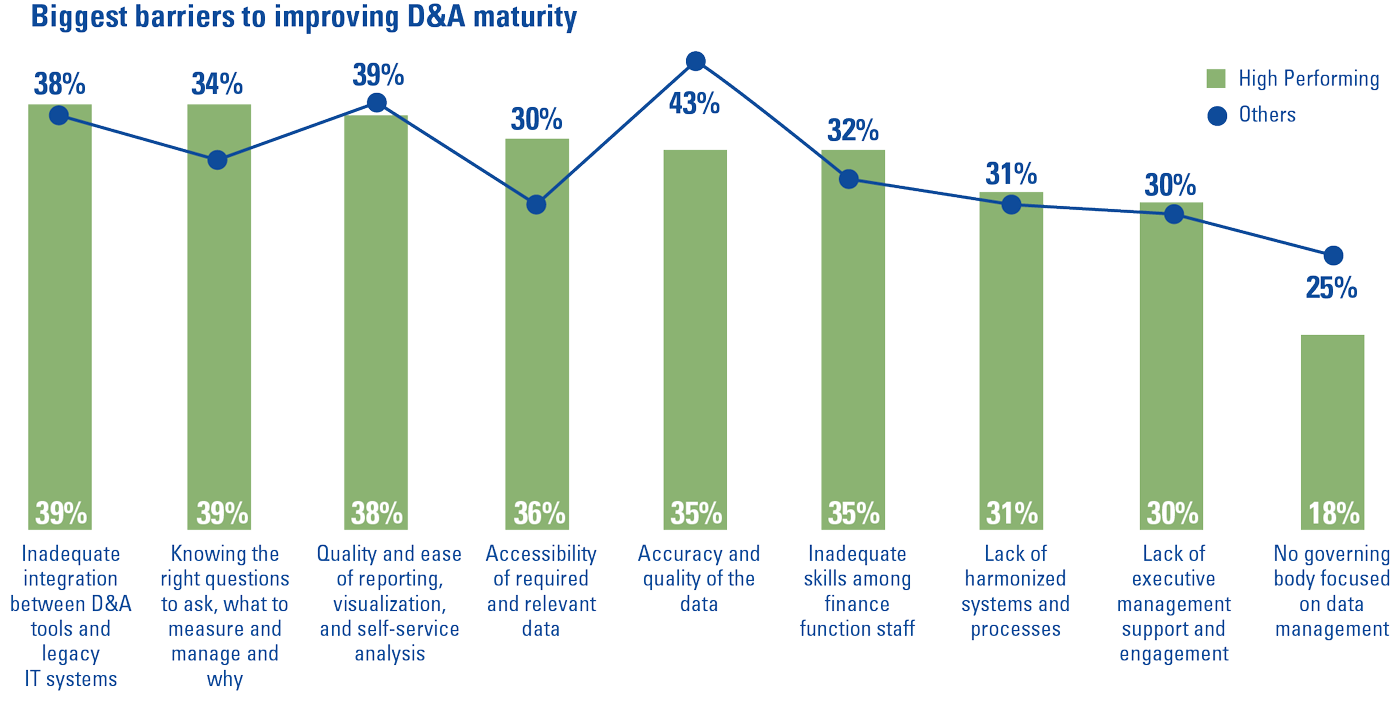
Figure 3. Biggest barriers to improving D&A maturity ([KPMG19b]). [Click on the image for a larger image]

Therefore, the issues mentioned in Figure 3 are seen in most sectors and large organizations. Most common issues are data availability/accessibility, data quality and generating value from the insights that are derived from the data.

To overcome these issues, organizations need to build a solid D&A foundation. This foundation consists of a set of building blocks that can be divided into three categories tangible resources (e.g. data, infrastructure, software), intangible resources (e.g. governance, culture, strategy) and human skills and knowledge (e.g. technical knowledge, analytical knowledge, data literacy). Organizations must focus on these tree components, before they can successfully perform descriptive, predictive and prescriptive analytics and generate business value from their efforts and investments.

C-2021-2-DeBie-04-klein

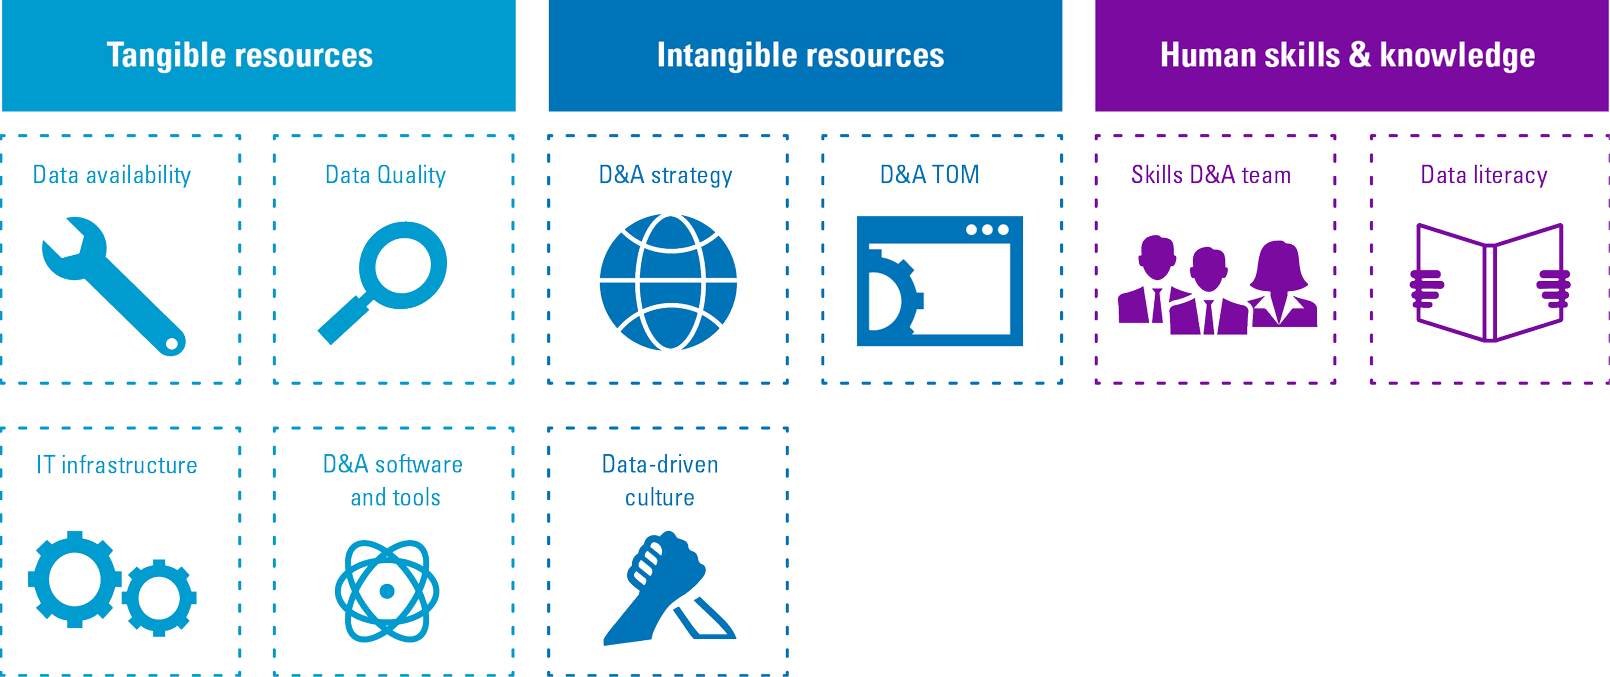
Figure 4. Building block that form the D&A foundation. [Click on the image for a larger image]

Tangible resources

Data availability

For any form of analytics, data availability is vital. It is not only about the number of available data sources, but also about how well the data is documented and shared within the organization. Focusing on data lineage helps in having a better overview of the available data. Data lineage is the process of recording and visualizing how the data was transformed, what changed and why. Data catalogues are organized inventories of data assets in the organizations. Data catalogues give a better understanding of the data and increase operational efficiency. Organizations often have problems when it comes to the availability of data. They either don’t have enough data sources or there is a lot of data, which is unstructured and undocumented and therefore hard to use. To successfully make use of predictive and prescriptive analytics, organizations need larger amounts of data, data of lower granularity and data from more sources, both internally and externally. A growing number of organizations is turning to online marketplaces where they are able to sell and buy data.

Data marketplaces

With modern data platforms, organizations are able to process, store and analyze vast amounts of data. Over the last years, vendors of these type of platforms started to integrate data marketplaces in their service offerings. A key example of this is Snowflake, a cloud data platform vendor who made the data marketplace a key pillar of their service offering. Using their platform, organizations are able to easily integrate external datasets from vendors or produce data sets for customers. For example, organizations are able to buy online behavioral data in order to better understand, expand and validate consumer behavior for targeting and analytics in order to achieve better conversion rates on their online platforms.

The growth of data marketplaces is an inevitable result of the IoT revolution. As physical assets such as ships, factories, vehicles, farms, and buildings become equipped with smart connected technology, their digital “twins” produce constant streams of valuable data points. These data streams surge across silos and carry value across organizations. Data marketplaces emerge as a means to exchange data, monetize data streams, and provide the basis of new “smart” business models ([IOTA19]).

Data quality

Data quality determines how well analytics can be performed. Inferior quality data leads to inaccurate analytics and insights. Data quality is a key enabler for most use cases. See for examples where improving data quality was a key enabler in the insurance or food retail industry ([Lust18], [Rijs17]). To be of high quality, data must be consistent and unambiguous. To achieve this, organizations should have centrally documented data definitions and business rules. Most of the leaders in this area have implemented Data Catalogues in order explicitly document these definitions and rules. By combining these Data Catalogues with strong Data governance and Master data management, these organizations see a significant increase in efficiency of their development teams and have shorter lead times for their data projects.

Many organizations are having issues with data quality. Reasons for data quality issues: non-compatible legacy systems, separation of data in silos, unskilled employees, and missing documentation of the data. Even the most mature organizations are not fully satisfied with their data quality. The more data-driven an organization becomes, the bigger the impact of data quality on the organization and its decision-making processes.

There are two reasons for this increasing importance of data quality: firstly, data-driven organizations base more decisions on their data. When the data is flawed, more decisions are impacted. Secondly, Employees in mature organizations have less doubt about the quality of the data. They are used to base decisions on insights from their data and are less likely to question the data quality.

IT infrastructure

Descriptive analytics requires a modern data warehouse (or data hubs/lakes) that can store data from different siloed systems in a structured way. An outdated or siloed infrastructure leads to issues with data availability and quality. When a central infrastructure is lacking, organizations try to upload data from different silos into a single BI tool. However, the different silos often contain contradictions, making it hard to define the truth. Infrastructures like data lakes can work with outdated legacy systems and enable the organization to create a common reality. Predictive and prescriptive analytics require not only BI tooling but often multiple data science tools. Organizations need a modern data platform that can handle multiple data sources and supports different D&A toolsets. Most leading organizations are utilizing cloud-based platforms because of their scalability, agility, and cost structure.

Analytical software and tools

Ideally, organizations have standardized tools for every category of analytics (and visualization thereof) that fit the organizational requirements. Having a standardized set of tools helps the organization in multiple ways. There will be less maintenance, fewer license fees, and less needed knowledge. Business users will be more used to the user interface; they are therefore more likely to use the tools and base their decisions on the provided insights.

Low mature organizations often do not have standardized toolsets and either do not have the right tool for their analytics purposes or every department has its own tool. Too many different tools are non-desirable because of the extra costs and maintenance but also employees are less likely to use insights from tools that they are not familiar with. This is especially the case for data visualization tools since the output from these tools is used broadly throughout the organization by less experienced business users. Mature organizations have set up a standardized toolset for descriptive, predictive, and prescriptive analytics. Modern cloud-based tools hardly have any limitations in their capacity to perform all types of analysis. However, most modern tech ‘unicorns’ go even further; their tooling is fully embedded into the day-to-day business applications and enables data-driven business processes and decision-making.

Intangible resources

D&A strategy

A well-developed long-term D&A strategy guides an organization in becoming increasingly data driven. The focus of the D&A strategy is largely dependent on the maturity level of an organization. The strategic goals and the KPIs must be aligned with the analytic capabilities. When descriptive analytics is still something an organization struggles with, then the focus should be on upgrading legacy systems, compatibility, and standardization. Only when descriptive capabilities are embedded in the organization, it is time to start looking at predictive and prescriptive analytics. When developing the D&A strategy, a long-term focus should be kept in mind. Management is too often primarily concerned with short-term results (ROI) instead of focusing on long-term objectives and so-called decision-driven data analytics (see also [Lang21]). Funding is a bigger issue for predictive and prescriptive analytics since management is less familiar with these kinds of analytics. However, using more advanced analytics takes time before it starts generating value.

The most data-driven organizations are already using descriptive, predictive, and prescriptive analytics throughout the business. Traditionally, reporting was often driven by finance and control departments. Predictive and prescriptive analytics have enabled many more use cases that allow for value creation throughout the organization. Analytical use cases can now be found in finance, marketing, supply chain, HR, audit, and IT departments. A recent development is the focus on automation of processes. In the most advanced cases, this means that outcomes from prescriptive analytics trigger automated processes that are performed by robots.

D&A Target Operating Model

The setup of the organizational structure, including spans of control and layers of management, plays a critical role in scaling standardized analytics throughout the organization. The governance structure defines the management, roles, and oversight of an organization. It shows the decision-making, communication and management mechanisms concerning analytics. First, an organization should decide whether it wants to have decentralized analytics units throughout the organization or if it prefers a centralized analytics unit. Both options can work as long as there is an efficient governance put in place.

Complex governance is an issue that hinders the value generation of analytics. Hierarchical and multi-layered governance slows down the entire process of adopting innovative technologies for analytics. Mature data-driven organizations keep governance concerning innovative initiatives as simple as possible. These organizations have cross-functional independent product teams that are integrated into the business. These teams have a large amount of autonomy to decide how they want to operate. A set of best practice guidelines is provided, supplemented by strict rules concerning data privacy and security, based on security/privacy policies and data classification. Such a fundament ensures flexibility and adoption of new and innovative techniques. For sensitive personal data, organizations might have to make use of the Data Protection Impact Assessment (DPIA). This is an instrument for mapping the privacy risks of data processing in advance and then take measures to reduce the risks, the GDPR mandates a DPIA in case of potential high privacy risks.

Data-driven culture 

A data-driven culture stimulates the use of analytics throughout the organization and increases the acceptability of the outputs that analytics generates. In data-driven organizations, the norm is that arguments and decisions must be based on insights generated from data. Developing a data-driven culture seems to be especially important when it comes to predictive and prescriptive analytics. When there are doubts about the quality of the outcomes, employees prefer to base their actions on their feelings. More advanced analytics means that there is less input needed from employees in the decision-making processes. One of the issues with predictive and prescriptive analytics is the ‘black box.’ When stakeholders do not know how algorithms or data analytics work, they are less likely to use the outputs for their decision-making ([Praa19], [Verh18]). Therefore, organizations should prefer to have less accurate but more explainable predictive and prescriptive algorithms. Another key factor within the culture is the willingness to change and innovate. Employees have to be willing to change their habits, such as abjure their Excel addiction, and adopt innovative technologies. Creating a data-driven culture should be a priority in the broader corporate strategy.

White boxing

Machine learning has immense potential for improving products and processes. But models usually do not explain their predictions which is a barrier to the adoption of this type of analytics ([Moln21]). Next to a barrier of adoption, these black box algorithms also can become biased or unethical.

Organizations are trying to use an innovative approach, named White Box AI, and focuses on models which can be interpreted by humans. These white-box models can explain how they behave, how they produce predictions and what the influencing variables are. There are two key elements that make a model white box: features must be understandable, and the ML process must be transparent ([Scif20]).

As increasingly advanced analytics is embedded into business processes, there is a growing need for these explainable models. Organizations need to ensure that their algorithms are complying with GDPR and within their ethical boundaries. For example, the Dutch Tax Office was targeting minorities using risk models based upon features which were later considered to be illegitimate to use for this purpose ([AP20]).

Human skills and knowledge

Skills analytics team

A skilled analytics team enables an organization to realize its ambitions. Depending on the maturity of the organization, the analytics team should have data engineers, data scientists, data architects, visualization specialists and most critically: translators who form the bridge between the analytics department and the business. When a D&A infrastructure and operating model are lacking and the organization is not yet adequately performing descriptive analytics, most organizations should focus on hiring all-round ETL, database and BI developers. The more technical data analytics roles can be contracted (filled in by freelancers) or outsourced (e.g. BI-as-a-Service), the more functional roles should preferably be established internally. Organizations that have to deal with many legacy systems must mitigate the risk of key person dependencies. Too often vital knowledge is only known by a few experienced employees. There is always a risk that knowledge will be lost when it is not well embedded in the organization. Many organizations experience the high demand concerning all data-related skills and find it difficult to attract the right people and are therefore forced to hire freelancers, in which case the risk of key person dependency should also be mitigated. Sometimes it is a better option to train and develop internal resources into the required profiles. D&A teams can benefit from context knowledge and employees are possibly more loyal because of development opportunities. Only when the foundations are laid and the organization is ready for larger amounts of real-time data, it becomes relevant to start hiring data engineers and data scientists. There are many examples where organizations rushed into hiring data scientists while the foundations were still missing. These data scientists were either forced to leave because there were no use cases, or they had to perform tasks that could have been done by less expensive data engineers.

Data literacy

Even when organizations can perform accurate and useful predictive and prescriptive analytics, they are often still not generating business value from these techniques. This is not due to technical limitations, as development and innovation in the field of data analysis are unfolding rapidly. The lack of business value is often caused by the gap between data professionals and business users. Users have a key role in understanding and analyzing the outcomes of data products and to turn their analysis into business insights, actions, and value. The gap between data and business professionals, often defined as a lack of data literacy throughout the organization, can be alleviated by further educating the organization on data concepts, cultural change programs and data-driven employee reward programs ([Goed18]). All hierarchical levels in the organization must have at least a basic understanding of data concepts and must be able to understand and engage with the data that suits their role. Only when the employees understand the data concepts, it becomes possible to make the right decisions based on the created insights. Another way to bridge the gap is with agile multidisciplinary teams. This iterative methodology invokes alignment between the demand and supply side of analytics, leading to shorter throughput times for novel solutions, more cross-functional knowledge and better management of focus and priorities.

Conclusion

Organizations aiming to generate value from descriptive, predictive, and prescriptive analytics must use a comprehensive approach to data analytics. Their endeavor is as strong as the weakest link in the set of required tangible resources (data/IT infrastructure), intangible resources (governance, culture, strategy) and human skills and knowledge (analytical competencies, data literacy). Even when have the best-in-class tools and infrastructure in place, without a strong data culture and appropriate data quality, outcomes of analytics will be almost worthless. Therefore, mature data-driven organizations have strengthened all these components.

This comprehensive approach is not limited to the supply side of data and analytics. The outcomes of these insights should be embedded in the business and its processes. Managers and employees must use the output from analytics and base their decisions on this output.

A truly data-driven organization is able to deliver and consume analytics, fully capturing the value of their data.

References

[AP20] Autoriteit Persoonsgegevens (2020, July 17). Werkwijze Belastingdienst in strijd met de wet en discriminerend [Dutch]. Retrieved from: https://autoriteitpersoonsgegevens.nl/nl/nieuws/werkwijze-belastingdienst-strijd-met-de-wet-en-discriminerend

[Goed18] Goedhart, B., Lambers, E.E., & Madlener, J.J. (2018). How to become data literate and support a data-driven culture. Compact 2018/4. Retrieved from: https://www.compact.nl/articles/how-to-become-data-literate-and-support-a-data-driven-culture/

[IDG21] IDG/CIO Magazine (2021, March). No Turning Back: How the Pandemic Has Reshaped Digital Business Agendas. Retrieved from: https://inthecloud.withgoogle.com/it-leaders-research-21/overview-dl-cd.html

[IOTA20] IOTA Foundation (2019, February 25). Onboard the Data Marketplace. Part 1: IOTA Data Marketplace – Update [Blog]. Retrieved from: https://blog.iota.org/part-1-iota-data-marketplace-update-5f6a8ce96d05/

[KPMG19a] KPMG (2019). Agile or irrelevant: Redefining resilience: 2019 Global CEO Outlook. Retrieved from: https://home.kpmg/xx/en/home/campaigns/2019/05/global-ceo-outlook-2019.html

[KPMG19b] KPMG (2019). Future Ready Finance Global Survey 2019. Retrieved from: https://home.kpmg/xx/en/home/insights/2019/09/future-ready-finance-global-survey-2019.html

[Lang21] Langhe, B. de, & Puntoni, S. (2021, December 7). Leading With Decision-Driven Data Analytics. Sloan Management Review, Spring. Retrieved from: https://sloanreview.mit.edu/article/leading-with-decision-driven-data-analytics/ and https://sloanreview.mit.edu/video/understanding-decision-driven-analytics/ (video)

[Lust18] Lustgraaf, M. van de, Sloots, G.I., Rentenaar, B. Voorhout, M.A., & Koot, W. (2018). Is data the new oil for insurers like VIVAT? Harvesting the value of data using a digital strategy. Compact 2018/4. Retrieved from: https://www.compact.nl/articles/is-data-the-new-oil-for-insurers-like-vivat/

[Moln21] Molnar, C. (2021). Interpretable Machine Learning: A Guide for Making Black Box Models Explainable. Retrieved from: https://christophm.github.io/interpretable-ml-book/

[Praa19] Praat, F. van, & Smits, R. (2019). Trusting algorithms: governance by utilizing the power of peer reviews. Compact 2019/4. Retrieved from: https://www.compact.nl/articles/trusting-algorithms-governance-by-utilizing-the-power-of-peer-reviews

[Pres20] Press, G. (2020, January 6). 6 Predictions About Data In 2020 And The Coming Decade. Forbes. Retrieved from: https://www.forbes.com/sites/gilpress/2020/01/06/6-predictions-about-data-in-2020-and-the-coming-decade/?sh=661e54464fc3

[Rijs17] Rijswijk, R. van, Ham, R.F. van der, & Swartjes, S. (2017). Data Quality GS: The importance of data quality in the food industry. Compact 2017/1. Retrieved from: https://www.compact.nl/articles/data-quality-gs1/

[Scif20] Sciforce (2020, January 31). Introduction to the White-Box AI: the Concept of Interpretability. Retrieved from: https://medium.com/sciforce/introduction-to-the-white-box-ai-the-concept-of-interpretability-5a31e1058611

[Verh18] Verhoeven, R.S., Voorhout, M.A., & Ham, R.F. van der (2018). Trusted analytics is more than trust in algorithms and data quality. Compact 2018/3. Retrieved from: https://www.compact.nl/articles/trusted-analytics-is-more-than-trust-in-algorithms-and-data-quality

[Voda20] VodafoneZiggo (2020). “Data is the source of success and customer value” [Interview Aziz Mohammadi, director Advanced Analytics]. Connect Magazine. Retrieved from: https://www.vodafoneziggo.nl/magazine/en/big-data/data-de-bron-voor-succes-en-klantwaarde/

From good grass to great grass: a digital twin of the pitch in the Johan Cruijff ArenA

The Johan Cruijff ArenA is not only one of the most innovative stadiums in the world by design, it also serves as a platform for innovation with its ecosystem. Together with its partners Microsoft and Holland Innovative, they developed a state-of-the-art pitch platform, continuously monitoring the grass conditions and translating this data into insights for daily operations. This technology improved the quality of the pitch significantly while using less resources. The pitch platform is Internet of Things in practice and shows a lot of scaling potential towards other stadiums, other buildings (like smart housing), cities and other sectors. However, implementing an innovation like this takes a lot of work, and often requires the need to work with partners. This use case serves as an inspiration, as it is one of the most practical examples of the Internet of Things that shows the scalability potential of the technology.

Introduction

Johan Cruijff ArenA is the home base of Ajax and the Dutch national soccer team. An iconic location for events and concerts. Unforgettable experiences happen in the Johan Cruijff ArenA. But the ArenA is more than just a stadium. The ArenA is developing innovation concepts in a field lab to make stadiums and cities worldwide smarter and more sustainable.

They believe that innovation makes all the difference. In Amsterdam South-East, the stadium and its founding partners created an innovation platform to test and grow solutions for societal and business challenges in the field of mobility, crowd control, security, fan experience, sustainability, open platform collaboration and citizen wellbeing. Innovations built on the newest technologies are made visible for more than 2 million yearly visitors of the stadium and in the area. The ArenA serves as an example to put technological innovation in practice and showcase its possibilities. One of KPMG’s roles in the Johan Cruijff ArenA is to facilitate the process and connect the right partners to accelerate innovation.

One of the most visible and appealing innovations regarding the Internet of Things at Johan Cruijff ArenA, is probably the pitch platform and dashboard. Although IoT innovations sometimes seem rather mysterious, the pitch platform is a very tangible example of how state-of-the-art technology is directly adding value: it’s a hands-on solution, enabling the pitch to be in its best shape. But this digital twin of the pitch was only possible through close collaboration with partners. In this article we dive into the collaborative aspects of innovation. As Henk Markerink, CEO of the Johan Cruijff ArenA points out: “Alone you go faster, but in collaboration you go further.”

 Johan Cruijff ArenA as a collaborative innovation ecosystem

The Johan Cruijff ArenA collaborates with corporate partners and Small and Medium-sized Enterprises (SMEs) as well as research institutions to gather more knowledge and create a vibrant ecosystem where innovation thrives. From the very beginning, collaboration proved to be key in enabling innovation. In 2015, the Johan Cruijff ArenA Innovation center was officially launched, providing a network of partners to enable innovation. Partners are invited to experiment, test and develop their newest innovations in the Johan Cruijff ArenA that serves as a field lab. The learnings from these validations are of great value for the further commercialization and scaling of the innovations.

This acceleration of speed due to collaboration is also seen in Internet of Things solutions within ArenA. Within the innovation center, partners innovate together in the field of smart building and smart city. Collaboration is again key for innovation, especially for smart city applications as this requires a system approach rather than the implementation of separate systems. Integrating and analyzing great amounts of data to be able to leverage its value is only possible when multiple stakeholders come together. The most famous example of Internet of Things technology within the Johan Cruijff ArenA is undoubtedly the smart pitch: as the first stadium, the Johan Cruijff ArenA has created a system to make its grass connected and smart using sensors, data, analytics and dashboarding.

IoT in practice: the smart grass of the ArenA

The need for smarter grass was evident: the grass in the Johan Cruijff ArenA was heavily criticized by players and fans since its opening almost 25 years ago. Taking good care of a pitch in a stadium is a true challenge: the stands are obstructing the sunlight to come in, the Dutch weather is unpredictable and most of the matches take place during the time the grass isn’t growing or hardly grows. Paul Baas is Field Manager of Johan Cruijff ArenA: “Our biggest challenge is the lack of air flows in a stadium and the lack of natural lights. Also, the ArenA grass has a busy schedule: a huge number of soccer matches and other events take place during the year. After each event, we need to know exactly what damage is done where so we can quickly respond.”

In line with the collaborative innovation school of thought the Johan Cruijff ArenA has embraced, Microsoft and Holland Innovative joined forces in developing a state-of-the-art pitch dashboard (see https://www.youtube.com/watch?v=hB-XjPP4j3Y) to enable this better monitoring.

C-2020-3-Leenslag-01-klein

Figure 1. Dashboard (still from https://www.youtube.com/watch?v=hB-XjPP4j3Y).

C-2020-3-Leenslag-02-klein

Figure 2. The high-tech pitch platform at the Johan Cruijff ArenA. [Click on the image for a larger image]

Its high-tech system built on Microsoft Azure monitors the grass continuously using 40 sensors located in the grass as well as on the roof. These sensors measure temperature, light, humidity of soil and air, wind speed, rainfall, and the amount of salts and minerals present in the soil. A weather station is placed on the field, a couple of them right under the rooftop. Besides this data, other performance measures are taken, such as measuring the speed of the ball, the degree of the bouncing ball, the hardness or smoothness of the field and the rooting. This data is brought together visually in the Microsoft PowerBI dashboard, where the “grass team” gets an overview of the real-time climate and exact status of the grass in the different areas of the field. In the dashboard, an overview of the pitch is shown: green areas show parts of the grass in good condition, orange parts are at risk, but the red zones show the critical zones. This clear visualization translates the information from the office to the grass team and technical staff. Paul Baas: “The dashboard visualizes which parts of the pitch are used less frequently during the match, enabling us to adapt the maintenance to help the pitch recover better and faster. What is also very interesting, is that it helps us make predictions about what the pitch will look like in the future, for example during the European Championships or dance events. We can determine our treatment plan for the grass, and with the dashboard we can get an impression of what would be the impact of our actions for the grass. We’re obviously dealing with nature and therefore take into account an uncertainty margin, but the dashboard does help us make better decisions.” A moment where this decision was of major importance, happened a couple of weeks before a potential large-scale dance event. When the request to host an extra event came in during the soccer season, the conditions of the grass were decisive for the final Go or No-Go of this event.

Based on this information, the grass team can also adjust the way they are taking care of the different zones of the field. If for example it is known that the coming days the weather will be warm, the team knows they should close the roof (Johan Cruijff ArenA has a moveable rooftop), to prevent and reduce stress for the plants caused by too much light. Also, in case of a heatwave, it has happened that the field had to be equipped with cooling systems to prevent the grass from getting too hot. The type of grass at Johan Cruijff ArenA is called “cold-season grass”, which only thrives under a temperature of 23 degrees Celsius. Based on the measured amount of light, the grass team gets “light advice” on where to place the pitch heat lamps. The grass team works with a variety of lamps that influence the growth and development of the plant positively: some types of lights influence the roots of the plant positively, whereas other types of lights increase the quality of the leaves. The results are stunning: the quality of the grass (for more information, see the box below) increased with 20% since its implementation, while the costs for field maintenance are lower and the energy consumption decreased.

The quality of the grass is measured and therefore quantifiable based on two components: vitality and grass occupation.

Vitality = the growth ability, or the ability to recover after a match so that the turf returns to its old level more quickly, is more resistant to diseases and looks vital.

Grass occupation = the amount of grass in a particular area. This is relevant for certain playing characteristics of the field, and the field also looks better.

The pitch dashboard basically functions as a digital twin (a data-driven representation of the true physical world) of the grass. Paul Baas: “The quality of the pitch is subjective and can vary from player to player. Back in the day, someone would just walk on the field and visually assess the quality and amount of grass. This assessment is also subjective as it always needs a relative point. If you would rate the grass a 9 in the winter, it is objectively seen as a lower quality compared to a rating of a 9 in summer. However, with this dashboard we try to objectivize this quality, to remove the ‘gut feeling test’. In my field of expertise, I believe I have a dream job. ArenA currently has the highest quality pitch possible. Taking into account my passion for grass, this place is this highest achievable within the Netherlands for sure.” Every time the grass is mowed, an automatic ‘crop scan’ is carried out. During mowing, two sensors register the number of leaves and the conditions and how it grows. Because we’ve been doing this for several years now, it is possible to compare the outcomes with a benchmark that is becoming more precise after each measurement. “In this way, we can respond to what is truly happening, we do not have to rely on protocols; we are truly data driven. When Ajax loses a match in the ArenA, people used to blame it on the (bad) pitch quality. But when Ajax won a match, it was also attributed to the pitch quality. We have removed this subjective aspect and made it fact based.”

C-2020-3-Leenslag-03-klein

Figure 3. Players’ feedback is valuable input for the quality of the pitch, but is very subjective. [Click on the image for a larger image]

Scaling the technology to other pitches and beyond

This technology caught a lot of national and international attention. The Dutch soccer association KNVB showed great interest from the start of the development and implemented the system for its training pitches for the Dutch national soccer team. The ambition is to scale this technology for other professional leagues as well. For Holland Innovative it is clear that, although ArenA is a frontrunner in this field, there still is another ultimate goal: a light ceiling. Instead of using different lights on the field, we will have an installation coming from the ceiling. This new technology provides a better quality of light and better doses the light, enabling an even more precise and potentially automated treatment.

C-2020-3-Leenslag-04-klein

Figure 4. The pitch of Johan Cruijff ArenA. [Click on the image for a larger image]

However specific this technology may sound, it shows tremendous scaling potential for other smart stadiums and smart city applications. The robust technology translating the data into actionable insights can, for instance, be used in agriculture, providing a digital twin of crops and seeds, as well as smart buildings (like housing and offices) and cities providing the insights for urban development and decision-making, such as for real estate. By predicting the effect of different designs, this technology can also provide support when deciding on where to plant trees and realize green in cities for example. There are also scaling possibilities for the health sector where data can assist medical staff and ensure a healthy environment. The possibilities are endless.

Holland Innovative: “I think that what we do at Johan Cruijff ArenA provides a true learning environment, a living lab for different sectors. Looking at the technology, we learned how to do it in the right way, we could copy this directly to other situations. The knowledge we gained is also useful for countries where it is more challenging to grow crops for instance.”

While scaling the platform outside the stadium, the ArenA is continuously developing an even smarter pitch. Henk van Raan, Chief Innovation Officer of Johan Cruijff ArenA has high ambitions: “We now know exactly how the grass ‘feels’. It is my dream that one day the grass will tell you itself how it’s doing. It shouldn’t be me telling someone that the field is fine. How great would it be if the grass itself is able to say that it is ready for the match between Ajax and Real Madrid?”

Conclusion

Over the last decades we have seen a rapid increase in embracing innovation as a way to drive value for organizations. Innovation can be a driver for business, brand and culture value. It offers benefits in business value ranging from top-line growth to bottom-line savings. Brand value is created because you show investors, potential employees and the press how innovation can increase the perceived value of your organization and help you in the war for talent. Lastly, innovation creates value for your organizational culture as it allows your employees to be engaged in innovation, which will greatly stimulate their commitment and ownership. More and more organizations realize that innovation is teamwork. We see a growing number of open innovation programs aimed at startups, venture programs and ecosystems popping up all over the world.

The Johan Cruijff ArenA has managed to build an ecosystem that builds on the best of both worlds: large open innovation programs at frequent intervals, SME and corporate partners, a living lab to test and implement and an international network to scale. The development of the digital twin of the pitch is a great example of a successful combination of Internet of Things technology, the right partners, and applying an agile way of working towards the implementation. The pitch platform also serves as a blueprint to quickly add to the range of IoT tools they have at the Johan Cruijff ArenA and is a great example of the scalability of a very specific solution when applying the Internet of Things in practice.

KPMG advises and supports the innovation center of the Johan Cruijff ArenA through growing and activating its ecosystem of corporates and scale-ups to accelerate innovation. If you would like to know more about the collaborative ecosystem or innovations at Johan Cruijff ArenA, we encourage you to contact the authors of this article.

A digital platform in professional road cycling

Team Sunweb is searching for marginal gains compared to its sporting competitors. KPMG is part of their expert team. We provide them with insights from data analysis, help them with transforming their organization to be more data-driven and build a platform which the team uses to manage and plan their season and races. In this article we describe several projects and tools which we have created with Team Sunweb. We will dive into what is considered the optimal sprint, team time trial, real-time data analysis and digital performance platform. The fact that Team Sunweb won three stages in the 2020 Tour de France, shows that this data-driven approach pays off.

Introduction

Professional sports is one of the toughest businesses on earth. The competition is exhausting and in most cases there can only be one winner. In top sports, the entire company is built around one single person. Its sole business is to make that person excel and even exceed their own limits to be the best in their area of sports. A professional sports company is one big team that works for this person. We are part of such an amazing team: Team Sunweb. Team Sunweb is a professional cycling team that performs on the world’s biggest stage.

KPMG has developed a digital platform for the professional Team Sunweb cycling team. The digital platform supports the performance organization, the business of professional cycling. The digital performance platform consists of data analysis functionality and apps which support the riders, coaches, experts and management throughout the season. The performance app supports the development of the season line-up, race plans and individual year plans, allowing the different experts in the team to provide their input following a structured process. The performance data analyses provide strategic and tactical insights (see Figure 1). For instance, analyses of historical race results provide input to optimize the season line-up, and analysis of power data of young talented riders provides input to decide on development trajectories towards the men’s elite team. In this article we share insights on the analysis of the sprint train and the team time trial (TTT). The former is used by coaches to optimize race tactics, specifically when it comes to reaching top speed during the final sprint. The latter provides real-time insights to coaches during TTT practice to make constant adjustments to achieve the smoothest ride.

C-2020-3-Adriani-1-klein

Figure 1. Performance app. [Click on the image for a larger image]

Sprint analysis: towards top speed

The goal of Team Sunweb is to have a minor competitive edge over the other teams as a minimum. Winning in cycling is one of the toughest goals. A rider competes against 150 to 200 other top athletes and only one can win. Increasing the chance of winning even by a small margin is huge in cycling. Having that competitive advantage over the other teams is needed to excel. In the partnership with Team Sunweb, we focus on this goal. Team Sunweb is provided with insights into optimal positioning and optimizing the number of supporting riders in the team (a.k.a. domestiques) through our data analysis. For example, it was found that the thought of “the more helpers the better” doesn’t apply. Too many helpers will make your sprint train inflexible, the optimal number of helpers lies between three and six in the final kilometers. The analysis is performed on the basis of video and power data analysis.

The sprint analysis focusses on optimizing the performance in the bunch sprint1 of a race. There are three key factors for success, namely positioning, helpers and insight. Insight is one of the most difficult aspects to measure but is partially correlated with the positioning and helpers. In our sprint research, we investigated the positioning of the rider and the number of helpers related to the success of a race.

Optimal positioning of a professional sprinter for a bunch sprint

Based on our research, we determined a sprinter’s optimal position for the last 10 kilometers of the race. There is a narrow bandwidth of positioning where a rider has the highest chance of success compared to other positions. This can be seen as the optimal positioning for the last 10 kilometers and has been presented to the performance team of Team Sunweb in a scorecard format to provide guidelines to the coaches before and even real-time during the race based on the composition of the leading breakaway group.

Gathering the data

We analyzed video data of several hundred races to determine the position and the number of helpers for a top sprinter. We selected only bunch sprint races and top sprinters. The top sprinters are selected according to a certain metric called the rider strength. The rider strength was calculated in a previous project together with Team Sunweb (The Grand Tour Analysis). This metric tells you how strong a rider is compared to the other riders in a certain aspect of cycling, for example sprinting, climbing or general classification. To make sure that a failure sprint is really a failure and a successful one really a success, the ten best sprinters according to the rider strength of each year are selected. This selection process is important for the validity of the analysis.2

Determining the best team size

After examining the positioning, we examined the team size. Team size is an important aspect in two ways. First of all, the more helpers, the less the key sprinter has to do to maintain a good position. Secondly, if a fast finishing sprinter has too many helpers around him, you might lose flexibility as a team and end up being left behind or restricted in tactics. The optimal number of helpers is determined using the same type of statistical analysis. This is calculated for various distances till the finish line, starting from the last 10 kilometers.

C-2020-3-Adriani-E1-klein

Team time trial: a smooth ride

The plan for an optimal team time trial (TTT) is essentially very simple. The point is that all riders reach the finish exactly by the time they run out of energy. Having energy left, means you could have gone faster; running out of energy before the finish means that your helpers will have to continue without you. The plan could be better executed using coaching that is based on insights from real-time data, which can yield up to 20 seconds on a TTT of around 30 kilometers. This is why it is very valuable to gain insights from data. Additionally, you have more control over the course of the race in a TTT compared to regular race stages. There are many possibilities to gain more insights. For example, in wind tunnels you can simulate real-live racing to identify optimal positioning for the least resistance and therefore the lowest energy consumption for your specific course.

C-2020-3-Adriani-E2-klein

Real-time sensor data analysis

We use sensors on bicycles and riders that measure three things: heart rate, speed and the power transmitted to the pedals. During training, since the use of live performance data is not allowed in competition, the data from those sensors can be sent to the cloud in real time and back to be presented on a dashboard in the team leader’s car. Using this type of technology only makes sense if you can properly model an optimal execution of a TTT. We developed this system in an innovation project together with the Technical University Delft (TU Delft) and Team Sunweb. This includes optimizing the time intervals for the lead riders. If you take the lead too explosively as a rider, it will take too much power. Taking the lead too gradually is also sub-optimal. TU Delft developed the ideal plan for a stage with mathematical modeling. Our system compares the actual performance to this ideal plan in real time. An important factor for feeding that model is to properly measure how long a rider rides in front (see Figure 2), because that strongly determines how quickly his figurative battery drains, and needless to say, the goal is to use those batteries optimally. Our model measures the lead turns (how long a rider rides in front) based on, among other things, the data on speed and power, and it determines the lead position with a 93% reliability. In addition, the system can only be used if the data arrive within a few seconds. However, the definition of “real time” differs between the commonly used BI tools and they take up to 10 seconds to refresh. That was not fast enough, so we built a solution ourselves to generate real-time insights for the support vehicle with a latency of less than 1.8 seconds.

The TTT system can be used during training and is used to prepare and evaluate the last training before a race on the actual race course. This makes it possible to train every exact moment and place at which the lead position changes during a TTT race. The data analysis that is used for this is automated and is part of the digital platform. The platform is the technical foundation which enables us to develop valuable use cases like this one for the TTT.

C-2020-3-Adriani-2a-klein


C-2020-3-Adriani-2b-klein

Figure 2. Team time trial analysis. [Click on the image for a larger image]

A data platform as a foundation to accelerate

In order to perform the above analyses properly, it is important to have access to advanced methods and techniques. An important first step is to replace the many separate applications (e.g. in Excel) with a solid data platform on which data scientists can build and run their analyses, giving the user the right insights. The data analysis platform makes it possible to link different data sources and it offers all the necessary (scalable) computing power to be able to perform complex analyses quickly. The staff of Team Sunweb processes data into insights more efficiently when working with our platform. We can analyze the expected performance and FTP values (Functional Threshold Power) of a few thousand riders in combination with countless races and the insights can be realized in a matter of minutes. The platform is gradually being further developed with new functionalities and is enriched with a growing number of data sources and algorithms that have been developed by the KPMG data scientists together with the Sunweb cycling team. Conceptually, this platform is well thought-out – with clear basic principles about, for example, the architecture and security that facilitate the growth model in terms of functionalities. The prioritization of the applications to be added is agreed on in close consultation with the experts of the performance organization and aligns with the team’s race philosophy.

The philosophy: an optimised plan is a prerequisite for optimised performance

In essence, it is very simple: if you can generate better insights with data analysis, you can also make better decisions about the race plan before, during and after the race. This is only possible if you have a clear plan. Strongly simplified: a rider applying 400 watts of force to the pedals for an hour, doesn’t mean anything; it only becomes valuable information when it is compared to the plan stating that the goal is to transfer 420 watts for that period.

Notes

  1. A bunch sprint is a sprint where a large group of riders is close to each other; this group is generally bigger than 30 riders.
  2. When a mediocre rider is sprinting and finishes fourth or fifth, this can sometimes be seen as a success when compared to the rest of the field. We therefore left out these riders to obtain and analyze a “cleaner” dataset.

A digital platform for professional road cycling

Team Sunweb is searching for marginal gains compared to its sporting competitors. KPMG is part of their expert team. We provide them with insights from data analysis, help them with transforming their organization to be more data-driven and build a platform which the team uses to manage and plan their season and races. In this article we describe several projects and tools which we have created with Team Sunweb. We will dive into what is considered the optimal sprint, team time trial, real-time data analysis and digital performance platform. The fact that Team Sunweb won three stages in the 2020 Tour de France, shows that this data-driven approach pays off.

Introduction

Professional sports is one of the toughest businesses on earth. The competition is exhausting and in most cases there can only be one winner. In top sports, the entire company is built around one single person. Its sole business is to make that person excel and even exceed their own limits to be the best in their area of sports. A professional sports company is one big team that works for this person. We are part of such an amazing team: Team Sunweb. Team Sunweb is a professional cycling team that performs on the world’s biggest stage.

KPMG has developed a digital platform for the professional Team Sunweb cycling team. The digital platform supports the performance organization, the business of professional cycling. The digital performance platform consists of data analysis functionality and apps which support the riders, coaches, experts and management throughout the season. The performance app supports the development of the season line-up, race plans and individual year plans, allowing the different experts in the team to provide their input following a structured process. The performance data analyses provide strategic and tactical insights (see Figure 1). For instance, analyses of historical race results provide input to optimize the season line-up, and analysis of power data of young talented riders provides input to decide on development trajectories towards the men’s elite team. In this article we share insights on the analysis of the sprint train and the team time trial (TTT). The former is used by coaches to optimize race tactics, specifically when it comes to reaching top speed during the final sprint. The latter provides real-time insights to coaches during TTT practice to make constant adjustments to achieve the smoothest ride.

C-2020-3-Adriani-1-klein

Figure 1. Performance app. [Click on the image for a larger image]

Sprint analysis: towards top speed

The goal of Team Sunweb is to have a minor competitive edge over the other teams as a minimum. Winning in cycling is one of the toughest goals. A rider competes against 150 to 200 other top athletes and only one can win. Increasing the chance of winning even by a small margin is huge in cycling. Having that competitive advantage over the other teams is needed to excel. In the partnership with Team Sunweb, we focus on this goal. Team Sunweb is provided with insights into optimal positioning and optimizing the number of supporting riders in the team (a.k.a. domestiques) through our data analysis. For example, it was found that the thought of “the more helpers the better” doesn’t apply. Too many helpers will make your sprint train inflexible, the optimal number of helpers lies between three and six in the final kilometers. The analysis is performed on the basis of video and power data analysis.

The sprint analysis focusses on optimizing the performance in the bunch sprint1 of a race. There are three key factors for success, namely positioning, helpers and insight. Insight is one of the most difficult aspects to measure but is partially correlated with the positioning and helpers. In our sprint research, we investigated the positioning of the rider and the number of helpers related to the success of a race.

C-2020-3-Adriani-E1-klein

Optimal positioning of a professional sprinter for a bunch sprint

Based on our research, we determined a sprinter’s optimal position for the last 10 kilometers of the race. There is a narrow bandwidth of positioning where a rider has the highest chance of success compared to other positions. This can be seen as the optimal positioning for the last 10 kilometers and has been presented to the performance team of Team Sunweb in a scorecard format to provide guidelines to the coaches before and even real-time during the race based on the composition of the leading breakaway group.

Gathering the data

We analyzed video data of several hundred races to determine the position and the number of helpers for a top sprinter. We selected only bunch sprint races and top sprinters. The top sprinters are selected according to a certain metric called the rider strength. The rider strength was calculated in a previous project together with Team Sunweb (The Grand Tour Analysis). This metric tells you how strong a rider is compared to the other riders in a certain aspect of cycling, for example sprinting, climbing or general classification. To make sure that a failure sprint is really a failure and a successful one really a success, the ten best sprinters according to the rider strength of each year are selected. This selection process is important for the validity of the analysis.2

Determining the best team size

After examining the positioning, we examined the team size. Team size is an important aspect in two ways. First of all, the more helpers, the less the key sprinter has to do to maintain a good position. Secondly, if a fast finishing sprinter has too many helpers around him, you might lose flexibility as a team and end up being left behind or restricted in tactics. The optimal number of helpers is determined using the same type of statistical analysis. This is calculated for various distances till the finish line, starting from the last 10 kilometers.

Team time trial: a smooth ride

The plan for an optimal team time trial (TTT) is essentially very simple. The point is that all riders reach the finish exactly by the time they run out of energy. Having energy left, means you could have gone faster; running out of energy before the finish means that your helpers will have to continue without you. The plan could be better executed using coaching that is based on insights from real-time data, which can yield up to 20 seconds on a TTT of around 30 kilometers. This is why it is very valuable to gain insights from data. Additionally, you have more control over the course of the race in a TTT compared to regular race stages. There are many possibilities to gain more insights. For example, in wind tunnels you can simulate real-live racing to identify optimal positioning for the least resistance and therefore the lowest energy consumption for your specific course.

C-2020-3-Adriani-E2-klein

Real-time sensor data analysis

We use sensors on bicycles and riders that measure three things: heart rate, speed and the power transmitted to the pedals. During training, since the use of live performance data is not allowed in competition, the data from those sensors can be sent to the cloud in real time and back to be presented on a dashboard in the team leader’s car. Using this type of technology only makes sense if you can properly model an optimal execution of a TTT. We developed this system in an innovation project together with the Technical University Delft (TU Delft) and Team Sunweb. This includes optimizing the time intervals for the lead riders. If you take the lead too explosively as a rider, it will take too much power. Taking the lead too gradually is also sub-optimal. TU Delft developed the ideal plan for a stage with mathematical modeling. Our system compares the actual performance to this ideal plan in real time. An important factor for feeding that model is to properly measure how long a rider rides in front (see Figure 2), because that strongly determines how quickly his figurative battery drains, and needless to say, the goal is to use those batteries optimally. Our model measures the lead turns (how long a rider rides in front) based on, among other things, the data on speed and power, and it determines the lead position with a 93% reliability. In addition, the system can only be used if the data arrive within a few seconds. However, the definition of “real time” differs between the commonly used BI tools and they take up to 10 seconds to refresh. That was not fast enough, so we built a solution ourselves to generate real-time insights for the support vehicle with a latency of less than 1.8 seconds.

The TTT system can be used during training and is used to prepare and evaluate the last training before a race on the actual race course. This makes it possible to train every exact moment and place at which the lead position changes during a TTT race. The data analysis that is used for this is automated and is part of the digital platform. The platform is the technical foundation which enables us to develop valuable use cases like this one for the TTT.

C-2020-3-Adriani-2a-kleinC-2020-3-Adriani-2b-klein

Figure 2. Team time trial analysis. [Click on the image for a larger image]

A data platform as a foundation to accelerate

In order to perform the above analyses properly, it is important to have access to advanced methods and techniques. An important first step is to replace the many separate applications (e.g. in Excel) with a solid data platform on which data scientists can build and run their analyses, giving the user the right insights. The data analysis platform makes it possible to link different data sources and it offers all the necessary (scalable) computing power to be able to perform complex analyses quickly. The staff of Team Sunweb processes data into insights more efficiently when working with our platform. We can analyze the expected performance and FTP values (Functional Threshold Power) of a few thousand riders in combination with countless races and the insights can be realized in a matter of minutes. The platform is gradually being further developed with new functionalities and is enriched with a growing number of data sources and algorithms that have been developed by the KPMG data scientists together with the Sunweb cycling team. Conceptually, this platform is well thought-out – with clear basic principles about, for example, the architecture and security that facilitate the growth model in terms of functionalities. The prioritization of the applications to be added is agreed on in close consultation with the experts of the performance organization and aligns with the team’s race philosophy.

The philosophy: an optimal plan is a prerequisite for optimal performance

In essence, it is very simple: if you can generate better insights with data analysis, you can also make better decisions about the race plan before, during and after the race. This is only possible if you have a clear plan. Strongly simplified: a rider applying 400 watts of force to the pedals for an hour, doesn’t mean anything; it only becomes valuable information when it is compared to the plan stating that the goal is to transfer 420 watts for that period.

Notes

  1. A bunch sprint is a sprint where a large group of riders is close to each other; this group is generally bigger than 30 riders.
  2. When a mediocre rider is sprinting and finishes fourth or fifth, this can sometimes be seen as a success when compared to the rest of the field. We therefore left out these riders to obtain and analyze a “cleaner” dataset.

Pseudonimisering binnen de AVG

De Algemene Verordening Gegevensbescherming (AVG) noemt pseudonimisering als maatregel om tot een persoon herleidbare gegevens op passende wijze te beschermen. Maar hoe doe je dat? En hoe sterk moet de oplossing zijn? En wat levert de toepassing je als organisatie op? Geldt er een verlicht AVG-regime voor het omgaan met gegevens als deze gepseudonimiseerd zijn? Veel organisaties worstelen met deze vragen. Dit artikel gaat in op deze vragen aan de hand van een aantal praktijkvoorbeelden.

Inleiding

De AVG vereist de inzet van technische en organisatorische maatregelen om persoonsgegevens op passende wijze te beschermen. Pseudonimisering wordt daarbij genoemd als mogelijke maatregel. Maar wat is pseudonimiseren en welke eisen worden eraan gesteld? En wat zijn de gevolgen voor de bruikbaarheid van de gegevens? In het maatschappelijk verkeer worden de termen pseudonimiseren, anonimiseren, de-identificeren, maskeren en coderen regelmatig door elkaar heen gebruikt of gecombineerd tot prachtige termen als ‘pseudo-anonieme’ of ‘dubbel gepseudonimiseerde key-coded’ data als resultaat. Termen die de suggestie wekken dat het wel goed zit met de privacybescherming. Het is uiteraard de vraag of dat daadwerkelijk het geval is. Dit artikel beschrijft eerst wat pseudonimiseren is en wat het verschil is met anonimiseren. Daarna komen aan de hand van twee cases de mogelijkheden en beperkingen van pseudonimiseren aan de orde. Tot slot worden enkele veelbelovende ontwikkelingen op het gebied van privacybeschermende maatregelen besproken.

Achtergrond en ontstaansgeschiedenis

Mede gedreven door de AVG heeft pseudonimisering als beveiligingsmaatregel voor het beschermen van persoonsgegevens de afgelopen jaren een grote vlucht genomen. Wereldwijd is een toenemend aantal aanbieders actief, bijvoorbeeld Privacy Analytics (Canada) en Custodix (België), die oplossingen aanbieden voor het pseudonimiseren van privacygevoelige gegevens. Recent heeft ook Google de bèta voor een Cloud Healthcare API for de-identifying sensitive data ([Goog]) gelanceerd. Ook in Nederland zijn meerdere dienstverleners actief, waaronder ZorgTTP en Viacryp. Daarnaast is er een toenemend aantal publicaties zoals [ENIS19] waarin best practices voor de technische opzet en mogelijke toepassingsgebieden worden beschreven. De overheid heeft in het kader van het eID-stelsel en de Wet digitale overheid ([Over]) die medio 2020 in werking zal treden, in het rijbewijs een voorziening opgenomen ([Verh19b]) voor het verstrekken van gegevens op basis van polymorfe pseudoniemen ([Verh19a]). Kenmerkend voor deze vorm van pseudonimiseren is dat iedere afnemer een ander pseudoniem krijgt voor dezelfde natuurlijke persoon. De kans op het doorbreken van de pseudonimisering wordt hiermee sterk beperkt. Pseudonimiseren is daarmee uitgegroeid van een specialistische en exotische toepassing naar een steeds breder beschikbaar en in toenemende mate gestandaardiseerd beveiligingsinstrument.

Wat zegt de AVG over pseudonimiseren?

Voordat we naar de techniek, praktijkvoorbeelden en ontwikkelingen op het gebied van pseudonimiseren kijken, is het van belang de juridische verankering te verkennen.

Pseudonieme gegevens zijn tot de persoon herleidbaar. De AVG en ook de voormalige EU-werkgroep 29 (thans European Data Protection Board) beschouwen pseudonieme gegevens als tot de persoon herleidbare gegevens ([EC14]). Deze vaststelling is van belang omdat nog wel eens wordt gesteld dat gepseudonimiseerde gegevens niet herleidbaar zijn. EU-werkgroep 29 stelt in dit kader echter dat pseudonieme gegevens als zodanig niet als anonieme gegevens kunnen worden gezien. De inzet van aanvullende maatregelen is vereist om met name de indirecte herleidbaarheid tot natuurlijke personen uit te sluiten. Daarmee moeten gepseudonimiseerde gegevens worden beschouwd als identificerende of identificeerbare gegevens waarop de AVG van toepassing is.

De AVG definieert pseudonimisering in artikel 4 lid 5 ([EU16b]) als:

het verwerken van persoonsgegevens op zodanige wijze dat de persoonsgegevens niet meer aan een specifieke betrokkene kunnen worden gekoppeld zonder dat er aanvullende gegevens worden gebruikt, mits deze aanvullende gegevens apart worden bewaard en technische en organisatorische maatregelen worden genomen om ervoor te zorgen dat de persoonsgegevens niet aan een geïdentificeerde of identificeerbare natuurlijke persoon worden gekoppeld;

Uit deze definitie blijkt dat in een pseudonieme dataset:

  • persoonsgegevens niet meer aan specifieke betrokkenen kunnen worden gekoppeld zonder het gebruik van aanvullende gegevens;
  • technische en organisatorische maatregelen vereist zijn om de herleidbaarheid van pseudonieme data naar identificeerbare of geïdentificeerde natuurlijke personen met aanvullende gegevens te voorkomen.

Met andere woorden, eerst moet bij het genereren van de pseudoniemen de link tussen de identificerende gegevens behorende bij een natuurlijke persoon en de daarvan afgeleide pseudonieme gegevens worden doorbroken. Dat kan al met het in bewaring geven van een eenvoudig sleutelbestand bij een ander, maar doorgaans wordt hier gebruikgemaakt van cryptografische algoritmes. Vervolgens moet worden voorkomen dat ongeautoriseerde herleiding plaats kan vinden door verrijking van de gepseudonimiseerde gegevens met aanvullende gegevens. De aanvullende maatregelen zijn daarbij in het algemeen gericht op het voorkomen van ongeautoriseerde toegang tot en verspreiding van de data. In een goede pseudonimiseringsoplossing moet zowel het genereren van pseudoniemen als het verrijken van gepseudonimiseerde data afdoende zijn geadresseerd.

DPIA als startpunt voor het inrichten van een pseudonimiseringsoplossing

Aan de eisen die de AVG stelt aan het pseudonimiseren van gegevensverwerkingen kan op meerdere manieren worden voldaan. Van geval tot geval moet worden beoordeeld welke combinatie van maatregelen als passend kan worden beschouwd ([EC14]). De vraag of het bijvoorbeeld mogelijk moet zijn om terug te kunnen naar de identificerende gegevens of juist niet, is een vraag die in dit kader gesteld moet worden. De beoordeling kan het beste worden gedaan in de vorm van een gegevensbeschermingeffectbeoordeling, of Data Protection Impact Assessment (DPIA), zoals vereist in artikel 35 van de AVG ([EU16b]). Op basis van de verwerkingsgrondslag, de aard van de verwerking en de daaraan verbonden risico’s, kan de afweging worden gemaakt tussen het beoogde detail van de te verwerken gegevens, de impact op de persoonlijke levenssfeer van betrokkenen en de maatregelen om de risico’s te mitigeren.

Wat levert pseudonimiseren op?

AVG-overweging 28 stelt dat de toepassing van pseudonimisering op persoonsgegevens de risico’s voor de betrokkenen kan verminderen en de verwerkingsverantwoordelijke en verwerkers kan helpen om hun verplichtingen inzake gegevensbescherming na te komen. Het gaat daarbij echter met name om het verminderen van de directe herleidbaarheid.

Indirecte herleidbaarheid

Ten aanzien van de mate waarin de gegevens na pseudonimisering indirect herleidbaar zijn, wordt in de opinie over anonimiseringstechnieken ([EC14]) gesteld dat moet worden nagegaan in hoeverre herleiding door herleidbaarheid (singling-out), koppelbaarheid (linkability) en deduceerbaarheid (inference) van de gegevens redelijkerwijs kan worden uitgesloten. Daar wordt nadrukkelijk gesteld dat pseudonimisering als zodanig voor geen van deze criteria indirecte herleiding uitsluit.

Wat zegt de toezichthouder over pseudonimiseren?

Reeds ver voor de publicatie van de opinie van [EC14] en de invoering van de AVG heeft het College bescherming persoonsgegevens (CBP) nagedacht over pseudonimiseren en de mate waarin dit leidt tot het beperken van de herleidbaarheid. De voorwaarden die het CBP voor pseudonimiseren heeft geformuleerd ([CBP07]), hielden reeds rekening met zowel de directe als indirecte herleidbaarheid van de gepseudonimiseerde gegevens. Het CBP stelde dat:

Bij toepassing van pseudonimisering is geen sprake van verwerking van persoonsgegevens, indien aan de volgende voorwaarden is voldaan:

  1. er wordt (vakkundig) gebruik gemaakt van pseudonimisering, waarbij de eerste encryptie plaatsvindt bij de aanbieder van de gegevens;
  2. er zijn technische en organisatorische maatregelen genomen om herhaalbaarheid van de versleuteling (“replay attack”) te voorkomen;
  3. de verwerkte gegevens zijn niet indirect identificerend, en
  4. in een onafhankelijk deskundig oordeel (audit) wordt vooraf en daarna periodiek vastgesteld dat aan de voorwaarden a, b en c is voldaan.

Eén van de uitgangspunten is voorts dat de pseudonimiseringsoplossing op heldere en volledige wijze dient te worden beschreven in een actief openbaar gemaakt document zodat iedere betrokkene kan nagaan welke garanties de gekozen oplossing biedt.

Gelden deze eisen nog onder de AVG?

In de achterliggende periode is meermaals gebleken dat bij pseudonimisering de uitdaging niet zozeer ligt bij de initiële inrichting van gegevensverwerking, maar bij de governance over een langere periode. Het blijkt in de praktijk een uitdaging voor organisaties om bij het toevoegen van nieuwe variabelen (datapunten) opnieuw de herleidbaarheid van de dataset te onderzoeken. Voorbeelden hiervan zijn de Diagnose Behandel Combinatie Informatiesysteem (DIS)-verwerking van de Nederlandse Zorgautoriteit ([AP16]) en de Routine Outcome Measurement (ROM)-verwerking door Stichting Benchmark GGZ (SBG) ([AP19b]). In beide gevallen bleek door uitbreidingen van de dataset in de loop van de tijd de indirecte herleidbaarheid van de gegevens zodanig toegenomen dat niet langer kon worden gesproken van redelijkerwijs niet-herleidbare gegevens.

Deze uitspraken impliceren niet zozeer het intrekken van de eerdere eisen voor pseudonimisering, maar vormen veel meer de bevestiging dat pseudonimisering als zodanig niet tot een anonieme dataset leidt zoals gesteld in opinie [EC14]. Het criterium om vast te stellen of sprake is van het verwerken van tot de persoon herleidbare gegevens, is in de AVG niet wezenlijk anders dan in de Wet bescherming persoonsgegevens (WBP). Nog steeds moet worden nagegaan of het, rekening houdend met de benodigde moeite en beschikbare middelen, redelijkerwijs (on)mogelijk is om gegevens te herleiden naar een natuurlijke persoon. Dat staat los van het al dan niet pseudonimiseren van de gegevens. In die zin blijven de eisen een bruikbaar uitgangspunt om na te gaan of sprake is van een verwerking binnen of buiten het kader van de AVG. Daarnaast kunnen de eisen helpen bij het beoordelen van toepassingen van pseudonimisering. Daarbij is de beoordeling niet gericht op het vaststellen of sprake is van het uitsluiten van herleidbaarheid, maar gericht op het tot een acceptabel niveau reduceren van de herleidbaarheid binnen een verwerking met privacygevoelige gegevens. Voor reductie van het risico is immers aandacht voor het beperken van zowel de directe als de indirecte herleidbaarheid noodzakelijk.

De relatie tussen pseudonimiseren en anonimiseren

Zoals in de vorige paragraaf is toegelicht, leidt pseudonimiseren als zodanig niet tot anonieme data. Pseudonimiseren is een van de mogelijke maatregelen gericht op het beperken van herleidbaarheid. In samenhang toegepast leiden deze mogelijk tot anonieme data. Die anonimiteit komt echter wel met een prijs: verlies aan onderscheidend vermogen in de dataset vanuit het perspectief van de gebruiker. In de HIPAA Safe Harbour-richtlijn voor het de-identificeren van medische gegevens wordt gesteld dat de-identificatie ten koste gaat van de bruikbaarheid van de data.

Volgens [Bart14] is hier sprake van de ‘Inconvenient Truth’ (zie figuur 1) dat het bereiken van de ideale situatie met optimale privacybescherming enerzijds en optimale waarde van de data anderzijds onmogelijk is. Bij het toepassen van technieken voor de-identificatie moet daarom steeds de afweging worden gemaakt tussen het beoogde gebruik en de kwaliteit van de informatie enerzijds en de privacybescherming anderzijds. Die afweging kan leiden tot een positionering van de verwerking binnen dan wel buiten de AVG. Zo kan de wens bestaan om productiedata met persoonsgegevens voor testdoeleinden te gebruiken wegens de representativiteit van de dataset. Als hiervoor echter geen toestemming van de betrokkenen of een andere AVG/grondslag voorhanden is, dan moeten de data geanonimiseerd worden. Het anonimiseren gaat echter ten koste van de representativiteit. Mogelijk kunnen niet alle testcases worden uitgevoerd, bijvoorbeeld omdat de postcode is geaggregeerd naar een regiocode of omdat de geboortedatum is omgezet naar een leeftijdsklasse. Daarnaast bestaat het risico dat de getroffen maatregelen de indirecte herleidbaarheid in onvoldoende mate beperken waardoor de testdata toch als herleidbaar worden gezien.

C-2020-1-Vlaanderen-01-klein

Figuur 1. Weging privacybescherming en datakwaliteit ([Bart14]). [Klik op de afbeelding voor een grotere afbeelding]

Zijn anonieme data eigenlijk nog wel haalbaar?

Uit het voorgaande blijkt dat de lat voor anonimiteit in de praktijk zodanig hoog ligt dat de mogelijkheid om individuen te onderscheiden in een dataset, gelijk wordt gesteld aan herleidbaarheid van de gegevens.

  1. Een toenemend aantal publicaties bewijst dat de ideale situatie uit figuur 1 niet haalbaar is. Keer op keer blijkt het mogelijk om individuen in schijnbaar geanonimiseerde datasets te herleiden door de datasets te verrijken met aanvullende gegevens. Aansprekende voorbeelden hiervan zijn studies zoals die naar het herleiden van de Netflix-prijsdataset met openbare censusdata ([Nara08]) en het promotieonderzoek van [Koot12] waar in de Nederlandse context schijnbaar niet-herleidbare medische data door verrijking met openbare CBS-data konden worden herleid. Recente publicaties als die van [Mour18] en [Roch19] tonen aan dat door de toename van openbaar beschikbare data, kennis en technische middelen steeds minder datapunten uit de geanonimiseerde set benodigd zijn om individuen te herleiden. Volgens [Cala19] kan alleen al het (unieke) patroon van aan een persoon gekoppelde datapunten leiden tot herleiding.
  2. De Autoriteit Persoonsgegevens (AP) vereist inmiddels dat verwerkingsverantwoordelijken en verwerkers aantoonbaar, juist en actief geavanceerde privacybeschermende technieken als K-anonymity ([Swee02]) toepassen ([AP19b]). Herleidbaarheid dient daarbij eerder absoluut dan redelijkerwijs uitgesloten te worden op basis van de criteria van herleidbaarheid, koppelbaarheid en deduceerbaarheid conform [EC14]. In beslissing op bezwaar [AP19a] tegen de eerder in dit artikel genoemde SBG-uitspraak geeft de AP aan dat een vergelijking met het Breyer-arrest ([EU16a]), waarin een minder absolute maatstaf voor niet-herleidbaarheid wordt voorgestaan, niet opgaat voor datasets waar een groot aantal andere datapunten is gekoppeld aan de pseudoniemen.

Voorbeeld van anonieme data

Ondanks dat het steeds lastiger blijkt om data te anonimiseren, zijn er wel voorbeelden te noemen van het verwerken van anonieme data. Zo is het Centraal Bureau voor de Statistiek (CBS) in de Wet op het Centraal bureau voor de statistiek ([Over03]) aangewezen als organisatie voor het produceren van statistieken voor beleid en onderzoek en kan het CBS in Nederland als maatgevend worden gezien als het gaat om het toepassen van technieken voor het anonimiseren van gegevens. Daarvoor wordt in Europees verband met zusterorganisaties ontwikkelde programmatuur voor Statistical Disclosure Control (SDC) zoals µ-argus en Tau-argus ingezet ([CBS20]). Met deze programma’s kan de mate van herleidbaarheid in te publiceren datasets worden beperkt tot een aanvaardbaar minimum. De inzet van deze programmatuur is echter niet triviaal. Statistische kennis en specifieke training voor gebruik van de software zijn vereist.

Pseudonimiseren: techniek en modellen

Nu de relatie tussen anonimiseren en pseudonimiseren duidelijk is geworden, wordt hierna een voorbeeld gegeven van pseudonimisering in Nederland. Daarvoor is het van belang kort stil te staan bij de techniek en de operating models. Pseudonimisering kan in verschillende vormen worden toegepast. Ga voor de keuze voor de specifieke uitwerking na of deze:

  1. een open of gesloten karakter moet hebben;
  2. omkeerbaar of onomkeerbaar moet zijn;
  3. een eenmalige of structurele omzetting van gegevens vereist;
  4. voor één specifieke of voor meerdere organisaties zal worden toegepast;
  5. de mogelijkheid voor omzettingen tussen gescheiden pseudonieme deelverzamelingen vereist (bijvoorbeeld bij multicenterstudies);
  6. in eigen beheer of met hulp van een externe dienstverlener moet worden uitgevoerd.

De uitkomst van deze afweging kan van geval tot geval verschillen en kan leiden tot de inzet van verschillende technieken. Het voornaamste doel van iedere oplossing moet het voorkomen van het ongeautoriseerd doorbreken van de pseudonimisering zijn. Bepalend voor een goede uitwerking van dat doel is de wijze waarop (cryptografisch) sleutelmanagement en functiescheiding zijn georganiseerd. De functiescheiding moet daarbij zodanig zijn ingericht dat wordt afgedwongen dat iedere actor de beschikking heeft over slechts een van de volgende elementen:

  1. de identificerende data (ID-data in figuur 2);
  2. het cryptografische sleutelmateriaal;
  3. de gepseudonimiseerde data.

Alleen als een afdoende scheiding is aangebracht tussen deze elementen, kan het ongeautoriseerd doorbreken van de pseudonimisering effectief worden voorkomen.

C-2020-1-Vlaanderen-02-klein

Figuur 2. Functiescheiding. [Klik op de afbeelding voor een grotere afbeelding]

Normen en praktijkrichtlijnen

Lange tijd was ‘ISO 25237 – pseudononimisatietechnieken’ een van de weinige normen op het gebied van pseudonimiseren. Inmiddels zijn de ‘NEN 7524 – pseudonimisatiedienstverlening’ en ‘ISO 20889 – de-identification techniques’ beschikbaar. Daarnaast verschijnen er steeds meer guidelines zoals die van ENISA ([ENIS19]) en de Personal Data Protection Commission Singapore ([PDPC18]). Ook sectorspecifiek zijn er richtlijnen voor praktische toepassing van de-identificatie, zoals het IHE Handbook De-identification ([IHE14]). Daarmee wordt het steeds beter haalbaar voor organisaties om een goede oplossing in te richten.

Case: pseudonimisering voor de risicoverevening

Zorgverzekeraars hebben de opdracht om te concurreren op prijs en kwaliteit. Wegens de in Nederland geldende acceptatieplicht is de verwachte schadelast per verzekeraar niet gelijk. Het Zorginstituut berekent daarom jaarlijks per zorgverzekeraar de vereveningsbijdrage per zorgverzekeraar op basis van de Regeling Risicoverevening ([Over18]) bij de Zorgverzekeringswet. Daarmee worden verzekeraars gecompenseerd voor onevenredige schadelast in de verzekerdenpopulatie en wordt een ‘level playing field’ gecreëerd waarbinnen de verzekeraars met elkaar kunnen concurreren. Om deze berekening te kunnen uitvoeren is een grote hoeveelheid (gevoelige) gegevens benodigd. Figuur 3 geeft een overzicht van de organisaties die een rol hebben bij de gegevensverwerking in het kader van de risicoverevening. Jaarlijks worden honderden miljoenen datarecords verwerkt binnen het stelsel. De verwerking kent een grondslag in de Zorgverzekeringswet. Hierin is expliciet opgenomen dat voor het doel van de risicoverevening de verwerking van medische persoonsgegevens en het burgerservicenummer noodzakelijk is.

C-2020-1-Vlaanderen-03-klein

Figuur 3. Stelsel Risicoverevening. [Klik op de afbeelding voor een grotere afbeelding]

Aan de linkerzijde staan de organisaties die input leveren voor het vereveningsmodel. Via pseudonimiseringssoftware worden jaarlijks gegevens aangeleverd aan enerzijds het Zorginstituut voor het berekenen van de vereveningsbijdrage; anderzijds worden gegevens geleverd aan jaarlijks te contracteren onderzoeksbureaus die in opdracht van het ministerie van Volksgezondheid, Welzijn en Sport belast zijn met onderhoud en doorontwikkeling van het vereveningsmodel. Na gebruik van de data worden deze eerst in een kortetermijnarchief geplaatst. Tot slot wordt het CBS voorzien van de data voor statistische doeleinden. De groene vlakken laten zien hoe een burgerservicenummer (BSN) wordt omgezet naar verschillende pseudoniemen voor verschillende afnemers.

Omdat het College Bescherming Persoonsgegevens ([CBP07]) de gegevensverwerking als een van de meest gevoelige verwerkingen in Nederland heeft bestempeld, zijn uitgebreide maatregelen getroffen om de persoonlijke levenssfeer van de betrokkenen te beschermen. Naast onomkeerbare pseudonimisering van de direct identificerende gegevens wordt voor de indirect herleidbare gegevens generalisatie toegepast in de vorm van aggregatie en het coderen van gegevens naar klassen. Figuur 4 beschrijft de functionele keten waarlangs gegevens gepseudonimiseerd worden. Een lokale pseudonimiseringsmodule leest het aangeboden bronbestand in en brengt na controle van de aangeboden gegevens eerst een scheiding aan tussen de direct en indirect identificerende gegevens. Op beide datadelen vindt vervolgens een bewerking plaats: respectievelijk pre-pseudonimisering en generalisatie. Het resulterende pseudo-ID en datadeel worden vervolgens voor definitieve pseudonimisering aangeboden aan de pseudonimiseringsdienstverlener. Deze dienstverlener fungeert als Trusted Third Party die uit oogpunt van de eerdergenoemde functiescheiding enkel toegang krijgt tot het pseudo-ID-deel. Het datadeel is door middel van PKI versleuteld voor de eindontvanger. Na definitieve pseudonimisering worden beide delen via een ontvangstmodule opgehaald door de eindontvanger. In de module worden de afzonderlijke delen samengevoegd, waarna het resultaatbestand wordt aangeboden. Het resultaat van deze operatie is een effectieve doorbreking van de relatie tussen brongegeven en gepseudonimiseerd afgeleide. Geen van de partijen kan zonder samen te spannen met een van de andere partijen de keten doorbreken.

C-2020-1-Vlaanderen-04-klein

Figuur 4. Operating model voor onomkeerbare pseudonimisering. [Klik op de afbeelding voor een grotere afbeelding]

Governance

De grootste succesfactor van de pseudonimisering voor de risicoverevening is dat regelmatig aandacht aan wordt gegeven aan zowel de technische als de organisatorische maatregelen. De methodebeschrijving van het pseudonimiseringsalgoritme is openbaar en voorziet in functies op het gebied van sleutelbeheer waarmee sleutels en toegepaste encryptiestandaarden kunnen worden vervangen. Ook interoperabiliteit is in de methode belegd, waardoor het mogelijk is om gegevens over te dragen aan andere aanbieders die de methode ondersteunen. Om ervoor te zorgen dat de data alleen voor legitieme doelen door daartoe geautoriseerde gebruikers toegankelijk zijn, heeft het ministerie een beleid voor datagovernance ontwikkeld. Het beleid voorziet in maatregelen en afspraken met betrekking tot opslag, transport, toegang en verspreiding van de data en wordt jaarlijks geëvalueerd. Daarbij wordt voor alle transacties in het stelsel vastgesteld of er wijzigingen in de specificaties zijn en of deze impact hebben op de herleidbaarheid van de data.

Ontwikkelingen

Er is een aantal veelbelovende ontwikkelingen gaande met de belofte om het gebruik van gevoelige gegevens op grote schaal te verenigen met een privacyvriendelijke opzet.

Synthetische data

Bij synthetische data wordt een afgeleide gemaakt van een (real-world) dataset met behoud van statistische eigenschappen. Het voordeel is dat er geen sprake is van herleidbaarheid naar individuen in de set omdat er een compleet nieuwe dataset wordt gegenereerd met fictieve personen in plaats van een afgeleide van de oorspronkelijke set. Het nadeel is echter dat de techniek nog voornamelijk in de context van wetenschappelijk onderzoek wordt toegepast, nog niet volwassen is en niet op alle vragen past. Extreme waarden in de dataset (uitbijters) kunnen bijvoorbeeld verloren gaan. Bij fraudedetectie wil je die juist zien. Voor het genereren van representatieve synthetische data is een real-world tegenhanger nodig waarop het algoritme dat de synthetische data moet genereren, wordt getraind. Het risico op herleidbaarheid van deze oorspronkelijke set door verspreiding en ongeautoriseerde verrijking van de data kan wel worden ondervangen door een synthetische set openbaar te maken. Het samenstellen van het origineel en/of de trainingsset uit diverse databronnen zou bij een Trusted Third Party kunnen worden belegd. Die rol kan in de praktijk belegd worden bij organisaties als het CBS, maar ook bij private partijen.

Secure Multi Party Computation

Secure Multi Party Computation is een verzameling technieken waarmee data afkomstig uit verschillende bronnen in geëncrypteerde vorm kunnen worden samengevoegd en bewerkt. Alleen het resultaat op populatieniveau wordt opgeslagen in de vorm van bijvoorbeeld regressiecoëfficiënten. Er ontstaat geen permanente samengevoegde dataset. De samengevoegde set wordt met de techniek van Shamir secret-sharing opgebouwd bij een Trusted Third Party die verwerkersovereenkomsten heeft gesloten met de aanleverende databronnen. Omdat de samengevoegde set alleen tijdelijk, in memory en bovendien in versleutelde vorm leeft, is geen sprake van gebruik van herleidbare data buiten het mandaat waarmee deze verzameld zijn. Er is sprake van verenigbaar gebruik.

Conclusie

Pseudonimiseren als zodanig leidt niet tot anonieme data. Organisaties moeten zich afvragen in hoeverre de heilige graal van anonieme én tegelijk betekenisvolle data haalbaar is. De lat voor anonimiteit ligt hoog. Herleidbaarheid dient absoluut uitgesloten te worden op basis van de criteria van herleidbaarheid, koppelbaarheid en deduceerbaarheid. In de praktijk moet een afweging worden gemaakt tussen privacybescherming en het beoogde gebruik van de data. Dat maakt dat verwerkingen binnen de kaders van de AVG moeten opereren. Pseudonimiseren kan daarbij een krachtig middel zijn om het risico op herleidbaarheid binnen een dataset te verminderen. De verwerkingsverantwoordelijke en verwerker(s) kunnen daarmee aantoonbaar voldoen aan de vereiste om passende technische en organisatorische maatregelen toe te passen.

Er is een toenemend aantal normen en richtlijnen beschikbaar voor het pseudonimiseren van gegevens. Deze kunnen helpen om tot een robuuste opzet te komen van pseudonimisering binnen een verwerking. De belangrijkste aspecten die belegd moeten worden, zijn functiescheiding, cryptografisch sleutelmanagement en het op transparante wijze beschrijven van het gevolgde proces en de daarbij geldende afspraken.

In Nederland is de risicoverevening een voorbeeld van het op grote schaal pseudonimiseren van gevoelige gegevens in een stelsel waarbij veel actoren zijn betrokken. De overheid werkt ondertussen aan opschaling in het kader van eID en de Wet digitale overheid.

Secure Multi Party Computation en synthetische data zijn technieken in ontwikkeling die een waardevolle toevoeging lijken te bieden in de continue afweging tussen het beoogde gebruik van data en het beschermen van de persoonlijke levenssfeer van hen op wie de data betrekking hebben.

Literatuur

[AP16] Autoriteit Persoonsgegevens (2016). AP: NZa mag diagnosegegevens uit DIS beperkt verstrekken. Geraadpleegd op: https://autoriteitpersoonsgegevens.nl/nl/nieuws/ap-nza-mag-diagnosegegevens-uit-dis-beperkt-verstrekken

[AP19a] Autoriteit Persoonsgegevens (2019). Beslissing op bezwaar. Geraadpleegd op: https://autoriteitpersoonsgegevens.nl/sites/default/files/atoms/files/beslissing_op_bezwaar_sbg.pdf

[AP19b] Autoriteit Persoonsgegevens (2019). Rapport naar aanleiding van onderzoek gegevensverwerking SBG. Geraadpleegd op: https://www.autoriteitpersoonsgegevens.nl/sites/default/files/atoms/files/rapport_bevindingen_sbg_en_akwa_ggz.pdf

[Bart14] Barth Jones, B. & Janisse, J. (2014). Challenges Associated with Data-Sharing: HIPAA De-identification. Geraadpleegd op: http://nationalacademies.org/hmd/~/media/Files/Activity%20Files/Environment/EnvironmentalHealthRT/2014-03/Daniel-Barth-Jones_March2014.pdf

[Cala19] Calacci, D. et al. (2019). The tradeoff between the utility and risk of location data and implications for public good. Geraadpleegd op: https://arxiv.org/pdf/1905.09350.pdf

[CBP07] College bescherming persoonsgegevens (2007). Pseudonimisering risicoverevening. Geraadpleegd op: https://autoriteitpersoonsgegevens.nl/sites/default/files/atoms/files/advies_pseudonimisering_risicoverevening.pdf

[CBS20] Centraal Bureau voor de Statistiek (2020). About sdcTools: Tools for Statistical Disclosure Control. Geraadpleegd op: https://joinup.ec.europa.eu/solution/sdctools-tools-statistical-disclosure-control/about

[EC14] European Commission: Article 29 Data Protection Working Party (2014). Opinion 05/2014 on Anonymisation Techniques. Brussel: WP29. Geraadpleegd op: https://ec.europa.eu/justice/article-29/documentation/opinion-recommendation/files/2014/wp216_en.pdf

[ENIS19] ENISA (2019). Pseudonymisation techniques and best practices, Recommendations on shaping technology according to data protection and privacy provisions.

[EU16a] Europese Unie (2016). Uitspraak HvJ EU: Patrick Breyert. Bundesrepublik Deutschland, C-582/14, 19 oktober 2016, ECLI:EU:C:2016:779.

[EU16b] Europese Unie (2016). Verordening (EU) 2016/679 betreffende de bescherming van natuurlijke personen in verband met de verwerking van persoonsgegevens en betreffende het vrije verkeer van die gegevens en tot intrekking van Richtlijn 95/46/EG (algemene verordening gegevensbescherming). Brussel. Geraadpleegd op: https://eur-lex.europa.eu/legal-content/NL/TXT/?uri=celex:32016R0679

[Goog] Google (z.j.). Cloud Healthcare API for de-identifying sensitive data. Geraadpleegd op https://cloud.google.com/healthcare/docs/how-tos/deidentify

[IHE14] IHE IT Infrastructure Technical Committee (2014). IHE IT Infrastructure Handbook De-Identification. Geraadpleegd op: https://www.ihe.net/uploadedFiles/Documents/ITI/IHE_ITI_Handbook_De-Identification_Rev1.1_2014-06-06.pdf

[Koot12] Koot, M.R. (2012). Concept of k-anonymity in PhD thesis “Measuring and predicting anonymity”. Geraadpleegd op: http://dare.uva.nl/document/2/107610

[Mour18] Mourby, M. et al. (2018). Are ‘pseudonymised’ data always personal data? Implications of the GDPR for administrative data research in the UK. Computer Law & Security Review, 34.

[Nara08] Narayanan, A. & Shmatikov, V. (2008). Robust de-anonymization of large sparse datasets. In: Proceedings of the 2008 IEEE Symposium on Security and Privacy (pp. 111-125). Washington, DC: IEEE Computer. Geraadpleegd op: https://www.cs.utexas.edu/~shmat/shmat_oak08netflix.pdf

[Over] Overheid.nl (z.j.). Wet digitale overheid. Geraadpleegd op: https://wetgevingskalender.overheid.nl/Regeling/WGK005654

[Over03] Overheid.nl (2003, 20 november). Wet op het Centraal bureau voor de statistiek. Geraadpleegd op 16 februari 2020 op: https://wetten.overheid.nl/BWBR0015926/2019-01-01

[Over18] Overheid.nl (2018, 24 september). Regeling Risicoverevening, Zorgverzekeringswet. Geraadpleegd op 16 februari 2020 op: https://wetten.overheid.nl/BWBR0041387/2018-09-30

[PDPC18] Personal Data Protection Commission Singapore (2018). Guide to Basic Data Anonymisation Techniques.

[Roch19] Rocher, L. et al. (2019). Estimating the success of re-identifications in incomplete datasets using generative models. Nature Communications, 10, 3069. Geraadpleegd op: https://doi.org/10.1038/s41467-019-10933-3

[Swee02] Sweeney, L. (2002). k-anonymity: a model for protecting privacy. International Journal on Uncertainty, Fuzziness and Knowledge-based Systems, 10(5), pp. 557-570.

[Verh19a] Verheul, E. (2019). The polymorphic eID scheme – combining federative authentication and privacy. Logius. Geraadpleegd op: http://www.cs.ru.nl/E.Verheul/papers/eID2.0/eID%20PEP%201.29.pdf

[Verh19b] Verheul, E. (2019). Toepassing privacy enhancing technology in het Nederlandse eID. IB Magazine, 6, 2019. Geraadpleegd op: http://www.cs.ru.nl/~E.Verheul/papers/PvIB2019/PvIG-IB6.pdf

Enterprise content management: securing your sensitive data

Good enterprise content management is a must to secure your sensitive data. Especially given the astonishing pace at which the data volumes keep growing. This growth is driven by the digitization of society and accompanying new opportunities. The objective is to enable organizations to fully profit from (new) opportunities around data and be in control over the use of data. At the same time, laws and regulations (such as the GDPR in Europe, the CCPA in California and the FIPPA in Ontario) are becoming increasingly strict about what can and cannot be done with data. This is challenging for many organizations due to the messy character of large parts of the data. Gaining control over unstructured data is a tough challenge. Unstructured data has been built up for years and is often “hidden” within folders on file servers. How can organizations explore the potential of digitization and at the same time comply with data-related laws and regulations?

Introduction

Governments of the Industrial World, you weary giants of flesh and steel, I come from Cyberspace, the new home of Mind. On behalf of the future, I ask you of the past to leave us alone. You are not welcome among us. You have no sovereignty where we gather.”

These are famous lines from the 1996 declaration of independence by the libertarians, headed by John Perry Barlow. It was a time full of optimism about the societal effects of new internet technology and we had just started to explore the possibilities of this new cyberspace. The libertarians were predicting – or hoping – to build a new information Walhalla and even an independent republic, where governments and corporations had no influence. Almost 25 years later, we could not be further away from that scenario. The largest tech companies (FAANG, Facebook, Apple, Amazon, Netflix and Google) have changed our lives by changing the way we connect with each other and making information and products within hand’s reach. In turn, they have gained massive power or even near monopolies, the web itself has turned very commercial and concerns about the proper use of personal data have become one of the major societal problems. Historically, technology has always had two faces. On the one hand, new technology offers opportunities for progress and innovation. On the other hand, new risks arise, such as the abuse of personal data. The challenge is to foster the positive, while controlling the darker side. The digital transformation is no exception to this. We have witnessed a multitude of useful and sometimes groundbreaking innovations that have made our lives easier and more comfortable. But it has also become clear that we must find (new) ways to deal with the dark side of digital transformation. Considering these factors, it is hardly surprising that governments stepped up their efforts trying to govern what in the early days was intended to be a sovereign place.

A dilemma

Some of the dynamics of this cyberspace are still valid. One of them: information wants to be free. Not only “free” as in “at no cost”, but also “free” as in an “endless space to move around in”. Professor Edo Roos Lindgreen once drew a simple graph with two axes to illustrate this ([Webw12]) (see Figure 1). One axis depicts the decrease of control over the accessibility of data; the other illustrates the extent to which data is publicly accessible. According to Roos Lindgreen, information follows the second law of thermodynamics: the result is maximum entropy. All information will end in the upper right quadrant of the graph. This is a situation of chaos: the information circulates freely in an uncontrolled space. If this model is valid, the evolution towards maximum entropy is inevitable, and data that arrives in the upper right quadrant can never be moved back. Take a viral video: once it is online it can never be fully taken off the internet. The saying that “you can’t unscramble eggs” says it all.

C-2020-1-Jeurissen-01-klein

Figure 1. Accessibility versus control of personal data. [Click on the image for a larger image]

Meanwhile, governments are trying to “unscramble eggs” in their efforts to regulate and improve the governance and security of personal data. In itself, this is understandable as we witness the risks and dangers of the unscrambled eggs nearly every day, such as the abuse of personal data. All in all, this leads to a dilemma where on the one hand information wants to be free and on the other hand laws and regulation aim to install boundaries to this freedom.

At the organizational level

The dilemma between freedom and control is challenging for society as a whole but is also valid for organizations. Many organizations are in the midst of a digital transformation. In this journey, they explore how they can manage and profit from data. This often includes the need for freedom to innovate with data. However, stakeholders expect organizations to process data securely and be transparent about their data processing activities. Laws and regulations, such as GDPR, CPPA and FIPPA, limit freedom accordingly.

It may be tempting to opt for a quite liberal approach when using different organizational data sources, as this helps facilitate data-driven innovation. However, decentralized data processing activities require effective data governance. This governance is not only important to comply with laws and regulations, but also in order to warrant reliable and trustworthy data. Data governance ensures that all parties involved use one version of the truth to base business decisions on. The stakes are high: proper data governance is vital for success in a data-driven society, as being in control over your data means better information to facilitate decisions.

From data to content

One of the solutions to deal with this dilemma is through master data management programs. Many organizations have created significant efficiency benefits and increased the level of information quality by implementing master data maintenance processes. This is because, thanks to these programs, master data objects are stored in one location. That way, other systems that make use of this information communicate with that one location, which serves as a single source of truth. Authorization management concerning these master data attributes only needs to be managed at the source, rather than in multiple locations. In these master data management programs, organizations clearly define which data objects are (strategically) important and implement structural management around these data objects. However, the challenge does not end there. The same principle should be applied to unstructured data as well.

As a result of digitization, data emerges from many new data sources. A significant part of organizational data is unstructured or semi-structured. Despite technological advancements that support the people who carry out business processes, the majority of these processes still require human interaction, and therefore the creation of content in some form. Examples of (semi)structured content are invoices, meeting minutes and photographs. Natural language is required to exchange information between business processes and parties. It is what makes these business processes human. Organizations must find ways to properly govern this part of the data pile too. Especially when it comes to personally identifiable and other sensitive information. That simply should not be dispersed over a chaotic unstructured data landscape.

Enterprise content management

This is where enterprise content management comes in. Content refers to the data and information inside a container ([Earl17]). Examples of such containers are files, documents or websites. Content is of a flexible nature – it can change over time and knows its own lifecycle. Enterprise content management makes it easier to manage information by simplifying information retrieval, storage, security and other factors such as version control. The promise is that it brings more efficiency and better governance over information. Implementing enterprise content management successfully is not a walk in the park. The way content is structured is highly diverse – as it is often entirely dependent on the way of working of its author or the business process responsible. There are often few standards regarding the structure of information across business units. As a result, the majority of organizations still struggle with enterprise content management.

The stakes are high in a time of ubiquitous data where processing information has become a key differentiator: organizations with good information management practices make better decisions and thereby have an advantage over their competitors. This is not because they have all the information available, but because they are able to limit the amount of information to a relevant portion that human brains can deal with. American Author Nicholos Carr ([Carr20]) is one of many who argue that too much information might just destroy our decision-making capabilities.

Moreover, privacy and security (and the laws and regulations in these related domains) are two key drivers for better management of organizational content. The larger the volume of content stored, the greater the risk that it contains sensitive information, which could lead to reputational damage if it ends up in the wrong hands. For instance, shared folders often contain data extracts from operational systems, which in turn, often contain personal data. What’s more, a lack of enterprise content management also leads to inefficiencies. Traditional content management systems force artificial structure through folders. Without a strong search functionality, information retrieval is difficult when the exact storage location of specific content is unclear. Without proper data classifications, unstructured data is difficult to find, use, manage and turn into information.

Enterprise content management model

Our view on content management is that it does not start with implementing tools and techniques. A holistic approach is used instead: a broad analysis of its relevance to an organization. To this end, we use an enterprise content management model based on five pillars: content, organization, people, processes and technology. This model is based on international market standards, such as DAMA DMBOK ([Earl17]), CMMI’s DMM ([CMMI14]) and EDRM ([EDRM]), as well as the publications and experiences of experts in the enterprise content management domain ([Mart17]).

C-2020-1-Jeurissen-02-klein

Figure 2. Enterprise Content Management model is comprised around five pillars. [Click on the image for a larger image]

Content

C-2020-1-Jeurissen-t1a-klein

Organization

C-2020-1-Jeurissen-t1b-klein

Processes

C-2020-1-Jeurissen-t1c-klein

Technology

C-2020-1-Jeurissen-t1d-klein

People

C-2020-1-Jeurissen-t1e-klein

The model is valid for any data architecture. Even in an extremely traditional organization – with content stored in paper files – the approach will trigger the right questions and will lead to a well thought-out solution. Information that is written in natural language can be digitized, as is also the case with photos of letters. OCR enables interpreting and managing the information on these flat documents. The same goes for images: artificial intelligence helps understand images. In fact, over the years we have all contributed to that by validating that we are not robots. Millions of users that perform the Captcha test have trained these algorithms ([OMal18]).

Guidelines for solving the dilemma

As described earlier, we have a dilemma at hand: there is tension between freedom of information and the need to govern all this information. The aforementioned model helps to define a holistic approach, and by exploring the five pillars, organizations enable a tailor-made approach that suits their specific characteristics and challenges.

The following general guidelines may be helpful in dealing with the dilemma.

1 Create awareness that content management is more than compliance

In practice, many organizations explore the options of content management in order to deal with privacy and security concerns, triggered by laws and regulations. This is understandable as the stakes are high and media attention for non-compliance issues exists. However, a better recipe is to start with the virtues of content management for the organization. In the current business landscape, being data-driven is key to success. This means that there are great benefits in developing a controlled vocabulary and curate content about specific topics. Content curation around specific topics that are important to an organization can stimulate innovation and knowledge management. Once the value of this is recognized, it will be easier to keep up in terms of compliance.

2 Use the full potential of clever indexing tools

Indexing tooling offers great opportunities to index content that is stored in a variety of systems, even the highly unstructured ones such as shared file shares, SharePoints and OneDrives. Especially when opting for a decentralized approach, indexing tooling offers quick methods to identify personal information throughout the organization. For example, by using a regular expression for bank account numbers, they may be quickly identified. A regular expression is a sequence of characters (e.g. numbers or letters) that defines a search pattern. To illustrate, to find all Dutch telephone numbers, one could search for strings of 10 numbers long that start with “06” or “+31”. This technique is developed in theoretical computer science and formal language theory. Possibilities go much further than that, however. The application of entity extraction for example, allows for the quick identification of people, places and concepts that may be deemed sensitive. Executing the “right to erasure” is difficult to implement when business processes involve high volumes of content, such as customer letters, data extracts in Excel format and emails. Implementing content maintenance processes mitigates this problem. All personal data can be identified quickly, and the correct follow up action can be taken. Mature organizations automate these processes, based on set data retention periods.

3 Opting for privacy by design

A centralized approach for storing personal information offers better options for the governance of information. Personal information should not be scattered across network servers. By centrally storing personal information, risks are reduced as there is only one location for the application of governance rules. In other systems, pseudonymization techniques can be used to mask personal information. In practice, many of these applications have no need for information that can be traced back to an individual. This central approach creates flexibility to use information in decentralized applications. This way, the group of employees who do have access to personal information can be limited to the employees who truly require access; the customer service department for example. For other activities, such as the management of transactions of the analysis of customer behavior, personal information is removed or pseudonymized, making it impossible for the users to trace that information back to an individual.

Case: GDPR triggers data retention program in bank

As a result of GDPR, a bank had made steps regarding data retention, heavily relying on their employees to cleanse sensitive data. New policies were created to determine what data was collected and for how long it was retained. One of the issues concerned the fact that content can contain multiple types of personal data. Take a CV for example, it contains a name, telephone number, address and sometimes even a date of birth and/or a picture of a person. Because content, such as CVs, were stored on shared file servers and within email boxes, it was difficult for the data privacy officer to quantify the success of the steps they had taken.

We helped quantify efforts: we carried out an analysis to determine how much personal data was left. We analyzed a total of approximately 100,000 emails and 1,000,000 files. 60% of the content we found was redundant, obsolete and trivial (ROT). ROT content is content that no longer needs to be stored, as it does not have business value. A common example: duplicate files, e.g. multiple copies of the same manual stored in different locations. The oldest file in the analyzed dataset dated back to 1997. We found meeting notes from 17 years ago containing client information. Even employee notes calling a customer “very sweet” and another customer “very annoying”. The list goes on, we identified 6,000 social security numbers, 200 CVs and even 500 files containing personal medical information. We created lists with files to be cleansed, these were validated by the business and then automatically deleted by the IT department using an automated script. Within 2 weeks of work, we had reduced remaining personal data by 50% and identified next steps to get that number down to 0%.

Case: Professional services migrates to the cloud

A popular topic is phasing out file shares and moving to the cloud. A professional services company had this same ambition. Their question, however, was how to approach this migration to the cloud. They faced several challenges. Authorizations management on file shares was not effective, due to the use of many different user groups over time. Different user groups as well as individual users had obtained access to specific shares and folders, making it very difficult to determine the owner of specific content. As a result, it was not possible to ask the right owners what data should or should not be migrated to the cloud. What’s more, these authorizations could not be copied to the new environment, as they were no longer up to date. An entirely new authorization concept and structure was required. We helped this client carry out their migration by utilizing technology to simplify the process. We classified existing data, around cases that made sense to the organization’s operations. In this case, these “cases” were projects, clients and departments. For each project, client and department, new environments were created, and the relevant files were migrated to that environment. Files with sensitive information were automatically classified using regular expressions for personal data. The information within a file, was automatically recognized and redacted upon migration. A new version of the document was created, in which the sensitive information was blacked out. It was no longer readable nor retrievable by the end user. The original stored in a secure location, for a predefined period of time to make sure no valuable information would be lost.

Conclusion

In the current era of ubiquitous data, organizations face a new dilemma. On the one hand, information wants to be free to explore the (new) opportunities of this era. On the other hand, the (messy) information within an organization needs to be controlled. Laws and regulations have raised the bar in recent years. It is a complex challenge. The good news is that there are a number of promising techniques and concepts that help organizations deal with this complexity. Organizations that start with defining the benefits of content management – having a controlled vocabulary, better insights for decisions, improved knowledge management – are best prepared to deal with this dilemma. Our model offers them a guiding hand.

References

[Carr20] Carr, N. (2020). The Shallows: What the Internet Is Doing to Our Brains. New York: W. W. Norton.

[CMMI14] CMMI Institute (2014). Data Management Maturity (Dmm) Model (1.0 ed.).

[Earl17] Earley, S. & Henderson, D. (2017). DAMA-DMBOK: Data Management Body of Knowledge. Bradley Beach, NJ: Technics Publications.

[EDRM] EDRM Model. (n.d.). Retrieved on December 15, 2019, from: https://www.edrm.net/resources/frameworks-and-standards/edrm-model

[Eijk18] Eijken, T.A., Molenaar, C., Dashorst, I.M., & Özer, P. (2018). eDiscovery Spierballentest. Compact 2018/2. Retrieved from: https://www.compact.nl/articles/ediscovery-spierballentest/

[KPMG16] KPMG (2016, February). Acht basis soft controls. Retrieved on January 1, 2020, from: https://assets.kpmg/content/dam/kpmg/pdf/2016/04/20160218-acht-basis-soft-controls.pdf

[OMal18] O’Malley, J. (2018, January 12). Captcha if you can: how you’ve been training AI for years without realising it. Retrieved on December 12, 2019, from https://www.techradar.com/news/captcha-if-you-can-how-youve-been-training-ai-for-years-without-realising-it

[Mart17] Martijn, N.L. & Tegelaar, J.A.C. (2017). It’s nothing personal, or is it? Compact 2017/1. Retrieved from https://www.compact.nl/articles/its-nothing-personal-or-is-it/

[Webw12] Webwereld Redactie (2012, March 26). Eén grote vrijwillige privacyschending (opinie). Retrieved on December 12, 2019, from: http://webwereld.nl/social-media/59974-een-grote-vrijwillige-privacyschending-opinie

Privacy pitfalls and challenges in assessing complex data breach incidents

In the past few years we have seen how the introduced data breach notification requirements have affected organizations in dealing with large scale data breaches. When looking at some practical example cases, we have seen that organizations struggle with gathering the right information about the nature and scale of the breach, especially information about the specifically affected individuals that they may need to be notified. Most challenges arise from both a data and a legal perspective. From a data perspective, organizations struggle in getting a complete and accurate overview of all affected data in the breach and the affected individuals. From a legal perspective, organizations need to assess to what degree the breached data can pose a high risk to the affected individual. A complex risk assessment needs to be performed and documented. This article will outline these challenges in detail and will conclude with recommendations for organizations on how to properly prepare themselves.

Introduction

In May 2018, the General Data Protection Regulation (GDPR) came into effect, forcing organizations to comply with a set of legal requirements regarding data breaches. Some countries, such as The Netherlands, have already implemented a similar regulation prior to this.1

When looking into the likelihood of a data breach and the likelihood of having to undergo these data breach proceedings seem to differ per country. In a recent report from DLA Piper, we read that about 25% (40k) of all data breaches within the European Union came from the Netherlands ([DLA20]). With only about 3.3% of the total EU population, this seems out of proportion in relation to the reported breaches in other EU member states. The most sensible explanation is that the Dutch data protection authority is more active in the Netherlands and the fact that organizations already had a reporting obligation since 2016 in the Netherlands. We see that Germany is the runner-up with 37k in reported data breaches. The UK, Ireland and Finland are in 3rd, 4th and 5th place respectively.

When we zoom in on the number of data breaches being reported in the Netherlands, we see that most data breaches (around 73%) concern relative straightforward cases of sending personal information to the wrong recipient, either via e-mail or via physical post, or the loss of a laptop or other data carrier (5%). The more complex data breach cases, however, are the ones that showcase that the legal requirements as set forth in Articles 33 and 34 of the GDPR are a big challenge. Data breaches are related to hacking, malware, phishing or other data theft (4%), or personal data that has been incidentally published or a leak in the system allowing unauthorized third-party access (7%).

The legal playing field

There are two main articles in the GDPR that cover the data breach notification: Articles 33 and 34. According to GDPR Article 33, in case of a personal data breach the data controller should report the incident to the supervisory authority within 72 hours, describing the nature of the breach, assessing the impact of the breach and describing measures taken.

Article 34 states that in case of a high risk to the rights and freedoms of natural persons, the controller will communicate the personal data breach to the data subject without undue delay. The information to the data subject should clearly contain the nature of the breach and at least information about the likely consequences of the data breach and the measures taken or proposed to mitigate possible negative effects. Failure to comply with these regulatory requirements may cause high monetary and reputational damage to the organization.

The next section will further dive into the legal requirements in relation to the more complex data breach cases. These more complex cases will show the financial burden that organizations need to undergo by putting in hours of investigation, legal analyses and decision making in order to comply with all legal requirements. The fact that the supervisory authority is closely monitoring these high-profile cases makes it more important that these requirements are met.

Challenges in assessing legal requirements

In the introduction it was laid out that about 11% of the reported data breaches contain more complex cases (or at least, here in the Netherlands). When a data breach has a malicious source it already becomes quickly evident that the breach will fall into the category of a complex case. We can say the same about cases where there is a vulnerability or a leak regarding a database or server with consumer data. These kinds of cases have taught us in the last few years that the legal requirements of the GDPR can become a heavy burden in case an organization is ill prepared. The next section will – per requirement – outline the challenges an organization may be facing and the impact this will have on resources, timelines and in the end financial or reputational damage.

Reporting to the authorities

According to Article 33 of the GDPR, the data controller should notify the supervisory authority about the data breach within 72 hours. The notification should include the nature of the breach, the categories and approximate number of data subjects involved, and the categories and approximate number of personal data records involved. Next to that, the likely consequences for the individuals should be communicated and the measures to mitigate the negative consequences.

Nature of the breach

The nature of the data breach may in most cases be very clear. In cases where data has been published incidentally or a leak has (potentially) allowed unauthorized third parties to access the data, it is fairly straightforward to explain the nature of the breach. Also, in most cases of malicious intent, the nature is quite clear, when communicated in generic terms (e.g. malware attack, hacking, theft of a physical hard drive). In some cases, where personal data is being compromised and the organization learns of this fact due to external sources, the nature of the breach may not be clear. A thorough incident response investigation will be required to determine this.

Scale of the breach

More challenging than determining the nature of the breach, will be the scale of the breach. The GDPR is fortunately asking data controllers to come up with approximate numbers. This may however be hard to estimate within 72 hours after discovery of the data breach. We have seen cases where multiple systems where compromised during a malicious attack. Consumer data was stored in these systems and often contain data records of the same individual across different systems. The overlap of data subjects and categories of personal data records will make it hard to determine a set of unique data subjects and data records to report to the authorities. Especially in cases where the master data management has not been up to par with industry best practices. Organizations with a large consumer base such as banks, pension funds or insurance companies will face this challenge. We will further dive into this in “Reporting to individual data subjects”.

Likelihood of consequences and mitigating measures

The likelihood of consequences is easy to identify on a generic level. When facing a breach with more generic data such as names, e-mail addresses, phone numbers, etc., the consequences can be found in the area of phishing and scamming activities. When more data is added, more threats and adverse consequences can become apparent, such as spear phishing, extortion, or targeted theft. When assessing the extent to which individual data subjects need to be notified, the analysis of these adverse consequences is critical in complying with the regulatory requirements of a data breach. The result of the analysis and the consequential decision making should be carefully documented. The challenges that come along with this assessment will also be laid out in “Reporting to individual data subjects”.

Reporting the mitigating measures may be difficult to communicate to the authority within 72 hours of discovering the breach, since it is probably still being investigated. This also applies of course to all the other reporting requirements as discussed above. In order to meet data controllers halfway, the supervisory authority can allow data controllers to send a provisional or initial notification which can be adjusted or revoked at a later stage.2 When submitting a provisional data breach notification with regard to a large scale data breach, it is advisable to seek contact with the data protection authority and keep close communication with them with regards to the data breach. A data breach in itself is not (necessarily) a violation of the GDPR. Not handling a data breach in line with the GDPR requirements or without following up instructions from the data protection authority, however, is.

Reporting to individual data subjects

To get a good understanding of the realistic challenges of an organization when it comes to the reporting requirements of the GDPR, we must picture large-scale data breaches, mostly from a malicious external source (such as a hack, data theft or malware related incident). For example, the data breaches of British Airways3, T-Mobile4, Equifax5 or Marriot Starwood Hotels6 are key examples of where these reporting requirements probably took a lot of effort. These cases have in common that a select part of the client data was compromised and that per individual different categories of personal information was exposed to the breach. Assessing this breach and determining the impact for each individual can be a very extensive task, especially when these cases comprise hundreds of thousands or even millions of individuals.

The key question in determining whether or not an individual needs to be notified, is whether or not there is a high risk to the rights and freedoms of the individual. When this is the case, the data controller will communicate the data breach directly to the individual, including the potential adverse consequences and what precautionary measures can be taken by the individual. The European Data Protection Board has provided guidelines about the criteria that should be considered when assessing the likelihood of a high-risk impact for the individual (see Table 1, [WP2916]).

C-2020-1-Idema-t1-klein

Table 1. Criteria to be considered when assessing the likelihood of a high-risk impact for the individual. [Click on the image for a larger image]

When assessing whether or not an individual is exposed to a high-risk adverse event regarding their rights and freedoms, a data controller needs to look at each single individual and determine whether or not they should be notified as well as the content of the notification. From a data perspective, this can be a humongous challenge, especially when the data management practices are not up to par. Determining the level of risk for each data point can also take significant effort, especially when the data has aged. These challenges will be addressed in the upcoming section.

Challenges from a data perspective

When looking into some specific data breach cases of the last two years, we have seen many challenges from a data perspective, for which a few examples will be given in this section. When the data controller is aware of which systems are compromised, the next step is to determine which personal data was stored in these information systems and what this data was about. When the level of maturity of data management practices within the compromised organizations is poor, then assessing the data will probably be the most challenging task in adhering to GDPR data breach reporting requirements.

Let’s focus on the idea that multiple systems containing consumer data have been compromised and the data quality / management within the organization is not of the highest standards. The following examples will provide master data challenges to determine for each impacted individual whether or not they should be notified.

For example, we will look into the fictional individual “Adam Smith”, who is a customer of an airline company. His personal information is in the customer master database, booking database, the payment database and in the Event database, where tickets for troubleshooting are stored. In these three systems, his personal data shows up as shown in Figure 1 (these are exaggerated examples).

C-2020-1-Idema-01-klein

Figure 1. Data challenge examples. [Click on the image for a larger image]

When we want to identify Adam Smith and check the personal data that is being kept of him which has been compromised during the breach, we see different data from different systems. Even data from the same system may indicate different information.

Challenge 1: Aggregate all the data of the same individual “Adam Smith” into one single overview of all his personal data

Since the individual “Adam Smith” is present in four different systems and is even found twice in the master database, we need to aggregate the data to understand which personal data is stored and what risks he may be exposed to across different systems,. Because Adam is registered differently across systems and each system contains different categories of data, there is no single unique identifier to use and identify one single Adam Smith. Ideally, each information system would have a reference to the same unique customer number. In practice, we have seen that this is not always the case and will be the root cause of complex data analytics to create a full picture of every single individual and their corresponding personal data records.

Challenge 2: Which “Adam Smith” data is the most recent data?

We may need to extract additional data from the systems to determine the registration date or last mutation date of the provided data record. Amending source data with additional data to determine the relevant records is going to be an additional layer of complexity to identify the unique users which should be notified under the GDPR.

Challenge 3: What is the age of the data records that is being shown?

A lot of companies struggle with the implementation of proper data retention procedures and controls. As a consequence, a lot of old data is still being stored in the information systems. In order to determine the relevance of this data, one needs a timestamp of when the data entered the system or when it was modified. Some data fields lose their relevance. For example, someone’s home address, telephone number or credit card may change in the course of 10 years. The same applies to someone’s license plate or IP address. These may be irrelevant already within 3 years’ time. Someone’s social security number or medical records are however never subject to change.

Challenges from a legal perspective

In case it is identified what categories of data have been compromised, it would be best to create an overview of all different profiles and tie risk classifications to each profile and determine whether or not these individuals will be personally notified or not (of possibly by what medium). Such a matrix will look like this: (insert example)

To fill in the risk profiles and determine whether or not each individual should be notified, the following activities can be performed:

  • Assess the value of the data (considering the nature of the breach)
  • Assess the potential risks for the individuals
  • Determine the impact of the age of the data (also, ‘actuality’, ‘accuracy’, or ‘timeliness’ of data)
Assess the value of the data

The value of the breached data can play a pivotal role in assessing potential threats. With regards to this whitepaper, the value of data is defined as what people with malicious intent could profit by potentially selling the information they have gained from your systems. Looking into the black market or “dark web” is a good starting point to assess the value. The value of personal information on the black market depends on the type of information and the combination of data available on the same individual. After doing some initial research, we see that the price of personal data varies quite a lot. Some basic information about individuals may provide you with a few dollars per record but adding bank account or credit card data to that will increase the value significantly. In the Netherlands, too, we have seen cases of selling personal data in combination with license plates is quite valuable. Combinations of personal and health information is two or three times the value of financial information alone as there are many more opportunities for fraud or blackmail of wealthy customers. For some example price ranges, please refer to Table 2.

C-2020-1-Idema-t2-klein

Table 2. Market worth of privacy data. [Click on the image for a larger image]

Assess the potential risks for individuals

The second step in the assessment is to identify the potential risks for each individual. The potential risks of the breached information can be categorized under (at least) three threat scenarios: Identity Theft, Scamming and Leaking/Blackmailing. We will provide examples for each threat scenario below.

Identity theft

Customer information can be used to impersonate a customer or employee.

  • Acquiring funds or goods. Identity theft can be a tool to commit fraud to acquire funds or goods. The severity and impact to the individual in this is high, because the customers can suffer from financial losses, unless they can prove they are the victim of identity theft. An attacker could for example order subscriptions or goods online based on the personal information of the victim.
  • Framing for (illegal) activities. Identity theft can also be used to ensure other illegal activities cannot be traced back to the person that committed them. An attacker could scam people on online platforms, such as “Marktplaats” (online Dutch marketplace and subsidiary of eBay), while impersonating a victim of the data breach. The stolen personal data is used to convince the person that is being scammed of the legitimacy of the scammer. As a result, the victims of the identity theft may be harassed by the victims of the scam ([Appe18]).
  • Acquiring more personal information. An attacker can also contact organizations and impersonate a customer in order to obtain additional personal information about the customer. The attacker can directly request insight into the personal information kept by the organization based on GDPR, or ask questions to deduce personal information that the organization has of the victim. The information from the breach is used by the attacker to initially identify as a customer. Obtaining additional personal information is not the end goal, but a means of achieving another goal in one of the three categories. An attacker could for example attempt to obtain the document number for an ID card or driver’s license, which can then be used to create a fake digital copy of such as document. This can then be used in other identity theft schemes that require a copy of such a document, such as renting buildings ([Sama16]).
Scamming

The stolen information can be used in different ways to scam the customer whose data has been stolen.

  • Generic scams. General contact information can be used to send spam, perform phishing attempts and attempt other generic scams. The impact of such generic scams on the victims depends on the success rate of the scams.
  • Tailored scams. Personal information, such as age and medical information, can be used to perform more tailored scams or target weaker groups. For example, older people generally have less digital experience, making them an easier target and chronically ill people are generally more willing to try new things to improve their health. Again, these techniques can be used to obtain money or credentials from the victims.
  • “Spear” scamming. More personal information, such as a BSN and medical information, can be used to attempt to convince the customer that the attacker is from an organization where the victim is registered or from an authority such as the police. The attacker achieves this by providing the victim with information about them, which should generally only be known to such organizations. Providing personal information about the victim increases the credibility of e-mails, letters and other interaction with the victim. Social engineering techniques can for example be used to trick people into transferring money or providing login credentials for online accounts.
Leaking or blackmailing

The stolen information can be leaked, or the victim can be blackmailed for money or other gains.

  • Sensitive information. In case of available personal information, such as medical information of high-profile individuals, like celebrities and politicians, the stolen information can be leaked, or the individual can be blackmailed with the threat of leaking the information.
  • Threatened identity theft. Victims can also be blackmailed with the threat of identity theft. This would have a high impact on them. The leaking of information can result in reputational damages for the victim, whereas blackmailing can result in either financial damage or reputational damage.
Determining the impact of the age of the data

Regulators, legal cases or current black market prices unfortunately do not tell us anything about the relevancy of the age of the data records. It is important to assess to what extent leaked personal data that is relatively old, can still impact the individual and to what extent the notification can help them to take steps to protect themselves from the effects of the breach. Even though leaked personal data is relatively old, the risk still exists that the breach may lead to physical, material or non-material damage for these individuals. This is especially applicable to cases where sensitive personal data is leaked, such as health data. The question that needs to be asked with regard to the impact of the breach for relatively old personal data is: could the breach still result in identity theft or fraud, physical harm, psychological distress, humiliation or damage to reputation of the individual? ([WP2916]).

To help make this assessment, some general statistics can provide some guidance (see Table 3).

C-2020-1-Idema-t3-klein

Table 3. Statistics on data age. [Click on the image for a larger image]

Document decisions and communication

When the assessment concerning the risks for the individuals subject to the data breach has been completed, a communication matrix can be created to determine the risk level for each case (personal data types and data age) and if this risk level meets the threshold of ‘high risk’ as stated in Article 34 of the GDPR. It is very important to document and substantiate the assigned risk level and why it is – according to your analysis – below or above the indicated threshold of Article 34 of the GDPR. This will be your core rationale of why you are going to notify an individual or not.

When the data is prepared and the legal analysis and risk analysis have been completed, a communication scheme can be set up. There are different methods for reaching out to individual data subjects. This can be done by physical mail, e-mail, SMS or even by telephone. Depending on the available contact information and the efficiency, a decision can be made.

When sending out large communications to individual data subjects, one can expect to receive some sort of a response from those individuals. The individuals may have questions about the data loss, they may want to execute their privacy rights, or they may want to have their data deleted. It is highly recommended to anticipate these scenario’s by setting up a call center to answer questions and gather subject requests, set up a specific e-mail address to gather subject requests and complaints and more importantly, reserve resources to follow up on an expected peak of access and deletion requests under the GDPR.

Conclusion and how to prepare

When a more complex and/ or large-scale data breach occurs, an organization is under heavy stress and pressure, regardless of the legal requirements as set forth by the GDPR. Acknowledging this will help organizations understand why it is critical to assess your internal procedures, data management maturity and incident response capabilities thoroughly. Then one will have a decent understanding to what degree these challenges can be resolved effectively and efficiently in a timely manner. When we look at the root causes for the delays and challenges to adhere to the legal requirements that come with a data breach, it is recommended to assess how prepared you are, on the following topics:

  • (Master) Data Management: What is the quality of your master data and is your organization able to create insights on a person level (rather than a product or process level), which customer information is stored?
  • Data Retention: Which records of your customers are you keeping and how are your data retention policies carried out in practice? Do you have insights in the age of your data and whether or not you should still have this data of your customers?
  • Data Minimization: Which records are you keeping of your customers? Are there additional records being kept (for example in open text fields or document upload features) that should not be stored and retained of these individuals, according to your policies?
  • Do you have proper contact details of your customers? Are you able to contact them in an efficient manner and is this contact information up to date?
  • Do you have a data breach procedure? Are you testing or evaluating this procedure and is it robust enough to handle more complex data breach incidents? This may include a crisis management plan and follow-up communication plans.
  • Is your data encrypted at rest and at transit? Are you using encryption techniques that are robust enough to prevent unauthorized access to (potentially) leaked or stolen data?
  • Do you have insight in what data you are processing for third parties and can you isolate this data from the data for which you are data controller? What are the liabilities in the data processing agreement between you and the third party of whom you are processing data?
  • You can offer a credit monitoring service for victims of a data breach, to monitor whether or not identity theft has taken place.
  • Do you have a cyber insurance to cover incidents like these?

The above topics are certainly not a limitative set of steps that need to be taken, but merely a guiding set of questions you might want to ask yourself when preparing for a data breach.

It can be concluded that no data breach is the same and that every case has its unique characteristics, but when handling large sets of data and applying the same legal requirements, the challenges will be of similar nature and can be properly prepared.

Notes

  1. Already pre-GDPR, The Netherlands has implemented additional Articles to the Personal Data Protection Act regarding the reporting of data breaches to the authority, as per January 1, 2012 for telecom and internet service providers and January 1, 2016 for all organizations processing personal data.
  2. The Dutch Data Protection Authority allows data controllers to submit an initial data breach notification which can be revised afterwards.
  3. British Airways was fined GBP 183 million, because credit card information, names, e-mail addresses were stolen by hackers, who diverted users of the British Airways website to a fraudulent website to gather personal information of the data subjects.
  4. In March of 2020, the e-mail vendor of T-Mobile was hacked, giving unauthorized access to e-mail data and therefore personal information of T-Mobile customers. In 2018, unauthorized users also hacked into the systems of T-Mobile to steal personal data.
  5. Equifax systems were compromised through a hack in the consumer web portal in 2017. Personal data of over one hundred million people were stolen. Personal data containing names, addresses, date of birth and social security numbers.
  6. In 2018 and again in 2020, Marriott reported that their reservation system had been compromised. Passport and credit card number of 500 resp. 5 million customers were stolen.

References

[Appe18] Appels. D. (2018, August 10). Gerard zou zwembaden en loungesets verkopen, maar wist van niks. De Gelderlander.

[Armo18] Armor (2018). The Black Market Report: A look inside the Dark Web.

[CyRe18] Cynerio Research (2018). A deeper dive into healthcare hacking and medical record fraud.

[DHHS19] Department of Health & Human Services USA (HHS) (2019). HC3 Intelligence Briefing Update Dark Web PHI Marketplace. HHS Cyber Security Program.

[DLA20] DLA Piper (2020). GDPR Data Breach Survey 2020. Retrieved from: https://www.dlapiper.com/en/netherlands/insights/publications/2020/01/gdpr-data-breach-survey-2020/

[Hofm19] Hofmans, T. (2019, July 23). Naw-gegevens uit RDW-database worden te koop aangeboden op internet. Tweakers.net. Retrieved from: https://tweakers.net/nieuws/155432/naw-gegevens-uit-rdw-database-worden-te-koop-aangeboden-op-internet.html

[Hume14] Humer, C. & Finkle, J. (2014). Your medical record is worth more to hackers than your credit card. Reuters.com. Retrieved from: https://www.reuters.com/article/us-cybersecurity-hospitals/your-medical-record-is-worth-more-to-hackers-than-your-credit-card-idUSKCN0HJ21I20140924

[Sama16] Samani, R. (2016). Health Warning: Cyberattacks are targeting the health care industry. McAfee Labs.

[Secu16] Secureworks (2016). 2016 Underground Hacker Marketplace Report.

[Stac17] Stack, B, (2017). Here’s How Much Your Personal Information Is Selling for on the Dark Web. Experian Blog.

[TrMi15] Trend Micro (2015). A Global Black Market for Stolen Personal Data.

[WP2916] Working Party 29 (2016). Guidelines on Personal data breach notification under Regulation 2016, 679, European Commission.

Trusting algorithms: governance by utilizing the power of peer reviews

Organizations that are able to build and deploy algorithms at scale are tapping into a power for insights and decision-making that potentially far exceeds human capability. However, incorrect algorithms or the inability to understand/explain how algorithms work, can be destructive when they produce inaccurate or biased results. It makes management therefore hesitant to hand over their decision-making to machines without knowing how they work. In this article, we explore how decision-makers can take on this responsibility via trusted analytics by laying out a high-level governance framework that reserves a special position for peer reviews.

Introduction

Over the past decade, we have seen an enormous growth in data and data usage for decision-making. This is likely to continue exponentially in the coming years, possibly resulting in 163 zettabytes (ZB) of data by 2025. That’s ten times the amount of data produced in 2017 ([Paul19]). Obviously, organizations are looking for ways to leverage the huge amounts of data they have. Some organizations sell it, others build capabilities to analyze the data in order to enhance business processes, decision-making or to generate more revenue or gain more market share.

Regarding the latter, organizations tend to increasingly use advanced analytics techniques, such as machine learning, to analyze the data. Although it goes without saying that these techniques show real value and unmistakably perform better than traditional techniques, there is also a downside. Advanced analytics techniques are inherently more difficult to understand as they are more complex. The combination of complexity and huge amounts of data to work with, individual analyses (often referred to as ‘algorithms’) sometimes are perceived to operate as ‘black boxes’. This is a problem for organizations that want to become more data-driven, as decision makers rely on these algorithms. Decision-makers have the responsibility to be able to trust them. They therefore need to balance the value coming from these advanced analytics techniques, with the need for trustworthiness to use them properly.

In this article, we explore how decision-makers can take on this responsibility via trusted analytics by laying out a high-level governance framework. Subsequently, we deep dive into one crucial aspect that should be part of it: peer reviews.

Challenges in trust

Organizations that are able to build and deploy algorithms at scale are tapping into a power for insights and decision-making that potentially far exceeds human capability. But incorrect algorithms can be destructive when they produce inaccurate or biased results. It makes decision-makers therefore hesitant to hand over decisions to machines without knowing how they work. Later in this article, we propose a high-level structure for decision-makers to take on the responsibility to trust the algorithms they want to rely on, but first we need to understand their challenges. Based on our experience, we listed some of the key questions that we receive when organizations aim to deploy algorithms at scale:

  • How do you know if our algorithms are actually doing what they are supposed to do? Both now, as well as in the future?
  • How do we know if our algorithms are actually in compliance with the laws and regulations that are applicable to our organization?
  • How do we know if our algorithms are actually built in alignment with our own, and industry-wide standards and guidelines?
  • How do we know if our algorithms are inclusive, fair and make use of appropriate data?
  • How do we know if our algorithms are still valid when the world around us changes?
  • How do we know if our algorithms are still valid when our organization makes a strategic change, e.g. optimizing on profit instead of turnover?
  • How do we know if our algorithms can still be understood if key people that worked on it leave the organization?

Obviously, for trusting algorithms to achieve their objective and for decision-makers to assume responsibility and accountability of their results, it’s essential to establish a framework (powered by methods and tools) to address these challenges and to facilitate responsible adoption and scale of algorithms. Yet, we also know there is a contradictory force that typically holds back the implementation of such a framework: the need for innovation. Because if we take a closer look how advanced analytics techniques are applied in practice, we notice that algorithms are often the result of cycles of trial and error driven by data scientists and other experts in search of valuable insights coming from data. It is a highly iterative process that benefits from a lot of freedom. If the only goal is to empower innovation, this approach is obviously very helpful. But as soon as the goal is to actually build algorithms that are ready for production, this same level of freedom will probably cause insufficient basis to do so. Because how can a decision-maker trust an algorithm that was developed by trial and error?

High-level framework to govern algorithms

In the previous paragraph, we summarized the challenges of decision-makers and explained why in advanced analytics developments it is of upmost importance to carefully balance innovation and governance throughout a non-linear staged process: insufficient control leads to algorithms that cannot be trusted, while too much control will stifle innovation and therefore negatively impact the competitive power of organizations.

We believe the solution lies in a governance framework that uses a three-phased approach, in which each phase has its own level of control. In the first phase, the level of control is relatively low as this will help empower innovation. It will result in “minimum viable algorithms” that can be further developed in the solution development phase, which holds an increased level of control. Lastly, in the consumption phase, algorithms are actually deployed and monitored. If advanced analytics techniques are applied according to the lines of these three phases, the result should be inherently trustworthy algorithms. Per phase, the framework should consist of specific checks and balances that will help to govern the entire process, balancing the level of control in each phase. During each hand-over moment from one phase into the next, these checks and balances act as entry criteria for the next phase, which can be verified via internal peer reviewers.

C-2019-4-Smits-01-klein

Figure 1. High-level governance framework. [Click on the image for a larger image]

  • Value discovery: in this phase, data scientists, engineers and developers search (‘experiment’) for interesting use cases for advanced analytics solutions and test these in a simulated environment.
  • Solution development: in this phase, as soon as there are ‘minimum viable algorithms’, these will be further developed and made ready for production (agile development of algorithms).
  • Solution consumption: in this phase, the actual algorithms are used in a real-world environment with (semi-)autonomous and continuous improvement cycles.
  • Hand-over moments: during the hand-over moments, the entry criteria for each new phase should be met. A check that can be performed via internal peer reviews.

Balancing impact and control

One of the checks and balances in the value discovery phase is to clearly define the purpose of the algorithm. This will help to assess for instance if an algorithm aligns with the principles (values and ethics) of the organization and if it complies to applicable laws and regulations. Furthermore, a clearly defined purpose should also be the starting point to assess the potential (negative) impact of the proposed algorithmic solution. We believe such an impact assessment is more or less crucial as it will lay the groundwork to enforce the appropriate level of control in the solution development and consumption phase. This is important because it would be a cost-worthy exercise to enforce maximum control over algorithms that have only a relatively low impact. An example of low-impact algorithm is an algorithm that is used in a 5-store building to optimally route lifts to appropriate floors. Though useful, the impact is relatively low. If you compare that to an algorithm that is used to detect tumors in MRI images, obviously it will score much higher on the impact ladder. But what is “impact”? We believe it emanates from an aggregation of three criteria: Autonomy, Power and Complexity (see Figure 2).

C-2019-4-Smits-02-klein

Figure 2. Algorithm impact assessment criteria. [Click on the image for a larger image]

By matching the level of control to the algorithm’s impact, the cost of control ([Klou19]) can be managed as part of the high-level governance framework as well.

Peer reviews

Now that we have introduced a high-level governance framework to govern advanced analytics developments, as stated in the introduction, peer reviews can play a very important role. In the remainder of this article, we will discuss how.

The scientific community uses peer reviews already for decades as a quality control system to help decide if an article should be published or not ([Beno07]). A scientific peer review consists of multiple stages in which scientists, independent from the authors, are reviewing the work done by their peers. From our experience we have learned that parts of such a control can be very helpful in an algorithm context as well as an extra pair of eyes in the development cycle. We are convinced that it helps increase the level of trust in business-critical algorithms before they are deployed into a live environment (e.g. the ‘latest’ phase of our high-level algorithm governance framework).

We will present an overview of topics that we consider most important when performing an external peer review. We will elaborate on how they are positioned in the algorithm development cycle and provide some guidance of relevant aspects to consider when performing a review. Subsequently, we will disclose our most important lessons learned. From there, we will conclude the article by describing how we think the presented peer review topics can help overcome the key challenges as described in the introduction and how organizations can leverage internal peer reviews as part of the high-level governance framework.

Peer review topics

The process of an external peer review is visualized in Figure 3. It basically consists of three stages that cover a specific number of topics. Each stage feeds information into the following.

C-2019-4-Smits-03-klein

Figure 3. Peer review stages and topics. [Click on the image for a larger image]

The basis of a peer review, and therefore the first step, is to get a basic understanding of the algorithm by reading as much relevant documentation as possible. This is combined with getting an understanding of the ways of working of the development team. The next stage is the core of the peer review because it puts focus on the performance and quality of the algorithm itself. This stage has overlap with software quality reviews because topics like “production pipeline”, “tests”, “code quality” and “platform” could be found in a software quality review as well. In the last stage all findings are summarized, aligned and reported to the developers and management team. In the following sections, we will define how a review topic relates to the development cycle of algorithms, and we disclose their practical implications when performing peer reviews.

Way of working

The (agile) way of working for algorithm development team highly impacts its hygiene. It determines if tasks and responsibilities are shared and if single points of failures are prevented. A proper way of working stimulates innovation and consistency.

Implications in practice

  • During a peer review, we look at processes, development roles and maintenance tasks. Think of different permissions in the version control system of the code base, branching strategies, or obligatory data scientist rotations. For example, the latter rotations will enable brainstorming discussions and therefore opens up room for innovative ideas while it prevents single points of failure.
  • Another topic that we assess as part of ‘way of working’ is how the team is managing ‘service tasks’ (e.g. operational activities such as running periodic reports to monitor the algorithm’s performance). Ideally, this responsibility is shared across the team, as it will increase the level of ownership and knowledge by the team members.
Logic and models

In algorithm development, logic and models determine if the output of an algorithm is accurate, fit for its purpose and therefore trustworthy to support business decision making. When we perform a peer review, we investigate the mathematical and statistical correctness of, and intention behind, the logic and models. We assess, for example, whether all assumptions of a statistical model are satisfied. If possible, we also try to suggest improvement points to optimize the algorithm’s performance.

As all production data for algorithm training purposes has incorporated some level of bias, we also need to verify how the algorithm ensures that it will not get biased without flagging or alerting the users of its output, basically a baseline test.

Satellite teams

The various teams that contribute to the core data science team that build algorithms are also commonly referred to as ‘satellite teams’. As part of a peer review, we assess the collaboration between the teams that work together on an algorithm. We focus on the teams that are either involved in data preparation, or teams that have to use the outcomes of a model. We evaluate these teams as part of our review process, to provide a good insight in the end-to-end lifecycle of data-driven decision-making.

Implications in practice

We consider the following teams as satellite teams in data-driven decision-making, amongst others: data-engineering teams or analytics-platform teams, teams that provide the input data, teams that use the algorithm output, and teams that are responsible for error checking and monitoring.

Error checking

In algorithm development, an indispensable factor to increase the overall performance of individual algorithms is performing root cause analysis on incorrectly labelled outputs (such as false positives/negatives or completely inaccurate outcomes). We call this error checking. During a peer review, we evaluate the error checking in place so that we can make sure that the errors made in the past will be prevented in the future.

Implications in practice

Questions to ask when performing a review:

  • What process is in place to review errors?
  • Do you use real-time alerts (continuous monitoring) or do you periodically review logs?
  • Do you make use of tooling to automatically detect errors?
  • Do you have a dedicated team working on root cause analysis of errors?
  • Do you have a way to prioritize the errors for further investigations?
Performance monitoring

Performance monitoring provides insights into how well an algorithm is performing in terms of for example accuracy, precision, recall or others. The performance of an algorithm should be taken into account when decisions are based on the outcomes, as the performance will provide details on the uncertainty of these outcomes. Monitoring on a continuous basis is even better, as it provides insights into the overall stability of an algorithm. For instance, a downward trend of the overall performance might indicate that an algorithm has to be further aligned to certain (external) changes in the sector or market it operates in.

Implications in practice

We look at:

  • How the precision or recall of an algorithm is monitored over time.
  • How fine-grained is the monitoring. For example, in cases of deteriorating performance, are teams able to get sufficient detail from the monitoring dashboards to be able to assess the root cause?
  • How are monitoring teams able to drill down to Key Performance Indicators (KPI’s) and summary statistics of small enough subgroups of the data sample an algorithm is created from.
Production pipeline

The performance and stability of a production pipeline determine the stability and consistency of algorithms over time. In addition, a well-structured pipeline makes the development or update cycles of algorithms shorter.

Implications in practice

Questions to ask when performing a review:

  • Have you implemented a job scheduler? And how is it monitored?
  • How much time does it take for each part of the production pipeline to run?
  • Have you put an alert system in place to notify teams if a part of the pipeline fails?
  • Have you assigned responsibilities for follow up in case of failure?
Software tests and code quality (combined)

Typically, software tests and code quality aren’t directly associated with algorithm development. Both aspects are actually very important to consider. Software tests will help ensure that algorithms are actually doing what they are supposed to do. Good code quality makes updating and maintaining algorithms a lot easier in comparison to algorithms that are built on spaghetti code.

Implications in practice

Questions to ask when performing a review:

  • As part of algorithm development, have you performed sanity checks, unit tests, integration/regression tests and A/B tests?
  • How have you structured the algorithm code? Is it for example modular, or based on one long script?
Platform

From a technological perspective, the basis for algorithm development lies at the tools and resources data analysts have to work with. These tools and resources are typically provided by platforms. Well known platforms are for example Amazon Web Services (AWS), Google Cloud or Microsoft Azure. These platforms typically work with all sorts of open-source frameworks such as Pytorch or Tensorflow.

Implications in practice

Questions to ask when performing a review:

  • Which frameworks, industry standard packages and software libraries do you use?
  • How do you make sure these frameworks, packages and libraries and are up to date?
  • How do you ensure that the platform you are using is stable and future-proof? Will the platform be able to handle the potential growth of data and users, for example?

Experiences: challenges and lessons learned

During our peer reviews on specific algorithms, or their development cycles, we have come across some lessons learned that are very relevant to consider when internal or external peer review processes are implemented as part of a governance framework. We have listed three of them that we consider as the most relevant:

  • Documentation makes not only the peer reviewer’s job easier, but it also will help ensure that the algorithm can be verified by someone else other than the developers. We often notice that documentation of algorithms is only partly available, or not up to date. We believe this is because the return on investment is not high enough and proper documentation slows down the development cycle in general. However, we know from our experience that documentation makes a peer review’s job much easier. Interviews usually give an ambiguous picture, for example because details are often not correctly remembered by the team members, making it difficult for a reviewer to get a comprehensive view on parts of the algorithm which are not properly documented. The traditional auditor’s statement of “tell me, show me, prove me” also applies to peer reviews.
  • Organizational culture influences analytics. From our peer reviews, we have learned that the culture in an organization greatly impacts algorithm developments. In a culture where mistakes are costly, or even a matter of people’s safety, algorithms and software are usually properly documented, tested and formal procedures are in place to manage updates of production code and/or pipelines. In a fail-fast-learn-fast culture, the opposite is often true. In those cases, alternative procedures are required to compensate for the increased risk of failure that is caused by for example a general lack of testing (e.g. better monitoring).
  • Tailoring the reviewer’s communication style enables constructive dialogue. A final experience is that findings of a peer review should be carefully aligned and reported in accordance with the reviewee’s needs. For example, an open team discussion to align and report findings from the peer review will enable a constructive discussion and room for the reviewees to disclose their concerns. On the other hand, a more traditional approach of reporting can help align findings amongst larger groups and enable management to enforce change.

Conclusion

Data science maturity is increasing rapidly. The growing industry is borrowing heavily from good practices in academia, where, especially in domains like high-energy physics, data science has already been running in a production-like setting for decades ([Klou18]). Peer reviews have proven indispensable in these domains because they:

  • ensure that algorithms are fit for their purpose;
  • ensure to identify and remove mistakes and flaws;
  • ensure the algorithms do not solely reflect the opinion and work of only one person.

As we have shown, the peer review method follows a staged approach to examine a wide array of topics, critical to the quality of algorithms in question. If we link this to the need for decision-makers to trust algorithms and their outcomes, we believe that all topics are highly relevant to be integrated as part of a high-level governance framework. The topics “Logic and models”, “Error checking”, “Performance monitoring”, and “Software tests and code quality” need to get specific attention because we believe these topics should be integrated as part of the internal peer reviews during the hand-over moments as well. In this way, a high-level framework that utilizes the power of peer reviews will help decision-makers take a good step forward in taking on the responsibility of trusting the algorithms that they rely on.

References

[Beno07] Benos, D.J. et al. (2007). The ups and downs of peer review. Advances in Physiology Education, Vol. 31, No. 2. Retrieved from: https://doi.org/10.1152/advan.00104.2006.

[Klou18] Klous, S. & Wielaard, N. (2018). Building trust in a smart society. Infinite Ideas Limited.

[Klou19] Klous, S. & Praat, F. van (2019). Algoritmes temmen zonder overspannen verwachtingen. Een nieuwe uitdaging op de bestuurstafel. Jaarboek Corporate Governance 2019 – 2020, p. 79-89.

[Paul19] Paulsen, J. (2019). Enormous Growth in Data is Coming – How to Prepare for It, and Prosper From It. Seagate Blog. Retrieved from: https://blog.seagate.com/business/enormous-growth-in-data-is-coming-how-to-prepare-for-it-and-prosper-from-it/.

Digital auditors, the workforce of the future

Can you – as a financial professional – imagine what your job would be like without Microsoft Excel? We can’t. As hilarious this may be to some readers, we cannot deny that Excel has completely changed the way a financial professional works. However, there are significant limitations of working with Excel. Who hasn’t faced the issue of working with datasets that are simply too large for Excel to handle? When you become a digital (financial) professional you will find new ways to approach these kinds of daily challenges.

Re-inventing yourself as a high-level professional in the current digital era

A solid process in combination with technology and a balanced team is key to delivering services in today’s society. Introducing new technologies in an established industry, such as finance, can be a challenge: the user community and other parties involved need time to adjust to new ways of working. In highly regulated environments the risk-averse attitude is quite high because the organizations need to comply with a multitude of applicable regulations. The proven predominantly manual approach is the known path with its daily struggles and provides limited opportunities for innovations. In practice, you see that innovations are going at a much faster pace than the corresponding laws and regulations. This can lead to a climate in which it can potentially become harder to innovate. Organizations in highly regulated environments can still innovate and profit from the benefits of new technologies if they include sufficient check-and-balances during the development and implementation phase.

We – three colleagues who work fulltime or part-time for the Digital Assurance and Innovation (Daní) department of KPMG – would like to share our personal experience regarding contributions to the ongoing digital transformation. The focus of Daní is the transformation of the financial audit process. One of the main drivers for our transformation is the need to improve efficiency and the desire to improve the quality of our services. These improvements can be made by automation or standardization of procedures, for example. This digital transformation leads to new ways of working. To prepare the organization for this digital transformation we facilitate trainings in data analytics. We feel that for an organization to be able to embrace a digital transformation, its employees should have the necessary skill set to thrive in this changing environment.

In this article, we will focus on the different learning opportunities that are available for financial experts to increase their digital literacy within the organization. First, we will present an overview of six Dutch universities with a wide range of studies related to the digital transformation of the audit process and our journey of becoming a digital professional.

C-2019-4-Lijdsman-t01-klein

Table 1. Overview of studies relating to digital auditing. [Click on the image for a larger image]

Table 1 provides insights into the different learning opportunities that are available for financial experts. In the remaining part of this article, we will share personal experiences of VU and UVA program alumni. One of these alumni will share his experience through a tailored KPMG post-master that was presented at the Jheronimus Academy of Data Science. Overall, we think that all of the above-described learning opportunities can be valuable. Which one would be the most valuable to you naturally depends on your background and personal needs. However, we believe that for every financial expert there is a program available that can improve your digital literacy irrespective of your background.

Perspectives from tech-savvy audit professionals

My name is Aram Falticeanu (senior manager). When I started my career as an auditor, I was eager to learn more about financial statement audits. During the first years I learned a lot of Excel skills and couldn’t imagine a workday without Excel. When I was studying to become a certified financial auditor, I was already keen to learn more about new technological developments. I noticed for example that my powerful Microsoft Excel program was not always suitable for my needs because I was not able to process all the data. During my training-on-the-job I noticed that 1,048,576 is the maximum number of rows with Excel. My datasets were simply too large for Excel and I wanted to explore if there were technical solutions that could help me. Instead of finding more advanced solutions I noticed that a lot of my colleagues figured out how to split, merge, pivot and shuffle a lot of data in such a way that they were able to analyze larger datasets within Excel. The “agile approach” of working with a dataset with millions of rows within Excel could be improved. With a few other tech-savvy colleagues I started making small VBA routines, and later on I extracted the relevant datasets directly from the databases with easy SQL queries into several subsets. This resulted in trying several other new and more advanced IT solutions within my audit engagements. I would often be one of the first users to try these new solutions which, despite some technical challenges, lead to new insights or save time during an audit. As a result, I embraced (new) technical solutions which I incorporated in my daily activities more and more. Nonetheless, this excitement was not always shared by others. It was often quite difficult to convince peers to use these new solutions. This was mainly caused by two challenges: they believe that the mandatory audit methodology was an obstacle; and the unawareness of the available possibilities. To become better at conquering these challenges, I decided to study Digital Auditing at the Vrije Universiteit Amsterdam. I learned how to combine a digital approach with current auditing standards. Furthermore, I learned that dealing with new technologies is relevant, as these technologies could not only increase efficiency, they could also enhance audit quality. For example, doing the cash reconciliation procedure each time with an automated routine in the same way will save time and increase consistency, which will lead to overall efficiency during the audit process. An automated three-way-match routine can, for example, validate the full dataset by reconciling all items instead of a sample on the dataset. The reconciliation of the full dataset will increase audit quality because the auditor can better focus on the outliers and has more insights about the full dataset. These new approaches on cash reconciliation and the three-way-match are examples of digital auditing.

When I brought this knowledge back to my daily work, I met Alwin Lijdsman (senior trainee). Alwin has a background in Data Science, however he is working within financial audit. Resulting in a unique mix of IT and audit knowledge. He taught me some software engineering skills and showed me yet another perspective of technology. I asked Alwin to share his perspective with you as well in this article.

My name is Alwin Lijdsman (senior trainee) and when I started my career as an audit professional, I was surprised by how skilled my colleagues were in using Excel. Nowadays, most people I work with only rely on a keyboard, writing complex formulas and creating crafty macros in their Excel worksheets. Yet, as soon as the words ‘data’ or ‘IT’ come along, most people immediately shy away and refer to the IT auditor in such a way that the silos and segregation between financial auditors and IT auditor will continue to exist. Or they refer to it as something that they don’t understand. I think that is unfortunate, as I believe it is easier to learn the Python for basic data processing than it is to learn VBA for writing macros. (Python is one of the most popular programming languages ([Cass18]) of today for many purposes, including data processing. Visual Basic for Applications is an older programming language developed by Microsoft that can be used to create macros in Excel.)

As an Economics student with a Master’s degree in Data Science (after a short detour in Computer Science), I found that the value of Data Science is in its usage as a tool. Similar to Excel, Data Science – in short – is applying computer science and statistics to solve problems using data in a specific work field. Unknowingly, you might be performing similar tasks in Excel already. However, performing these actions in Python or R is just easier. You can still perform calculations, you can still automate procedures, and you can still visualize data, but all in a more versatile way. Got a large data set? No problem with Python. Do you have to remove special text characters in several columns? A single line of code in R. Imagine how hard these tasks can be within Excel and you can see the value of becoming proficient in using these types of languages.

This makes me wonder: will young financial professionals in 10 or 20 years ask themselves the same question as I did when it comes to using Data Science as a tool? Does combining traditional auditing practices with Data Science techniques lead to success?

In order to truly understand an auditor, you must have some audit experience. In order to become a good programmer, you must understand the basics of computer science. Just put an auditor and a programmer in one room and out comes the audit innovation, right? Extracting and cleaning data? Check. Reading advanced SQL queries? Check. Performing a regression to obtain audit evidence? Check. Unfortunately, it does not work this way, at least not that easily. Not only are programmers with an interest in audit a rare breed, auditors and programmers often do not speak the same language. We hope that the learning opportunities described in this task can help you in becoming the bridge between the two.

Digital Auditor becomes a reality

In order to solve the problem at KPMG, we came up with the Digital Auditor program: we put auditors and programmers in a room for one week and we teach the auditors how to speak the language of the programmers (using the programming language R or Python). At the end of the week, auditors are starting to become fluent and are able to deliver small MVPs (Minimum Viable Products). Auditors can further refine these MVPs by applying them in their daily practice, before they are taken back to the programmers for more robust products. To illustrate this: most of the time the MVP will solve one specific problem and works on a dataset of the auditor that participated within the Digital Auditor program. When the digital auditors refine their MVP, they are allowed to use this within a controlled manner before it will be pushed for full deployment. Most of the time, the digital auditors search for more datasets to validate if the core-functionality is dummy-proof and explore if additional functionalities are necessary.

 Extracting and cleaning data? Reading advanced SQL queries? Performing a regression to obtain audit evidence? Check. All taken care of by the Digital Auditor. Of course, the concept of Digital Auditor requires some more time to realize. It requires efforts from both sides; auditors and programmers. Yet, the initial results are worth the invested time and effort. These Digital Auditors can form their own data-driven-approach and that is an important cornerstone to scale digital auditing.

Perspective for more in-depth knowledge with a tailor-made postgraduate course in Data Science

My name is Ivo Hulman (senior consultant) and when I started my career as a Business Analyst, I was eager to learn more about Data Science in addition to my Master in Information Management. More in-depth knowledge would increase my capabilities as a technical expert and therefore I wanted to further develop my technical skillset.

During my search for development opportunities, I came across a new program. In the challenging market for data & analytics, KPMG had teamed up with JADS, a venture between Tilburg University and Eindhoven University of Technology, to educate their new hires in the field of Data Science. This resulted in a postgraduate course in Data Science, specifically tailored to the needs of KPMG. The first group of participants had almost completed the program and the second group was about to start. I decided to apply for the second group, because this program offered me the opportunity to expand my technical skillset, and at the same time provided insights into how KPMG applies these skills in practice.

Over the course of the next 10 months I learned more about a wide range of Data Science related topics, such as Advanced Data Analytics, Artificial Intelligence, Data Lake & Engineering, Legal & Ethical, and Data Entrepreneurship & Innovation. The group of students, which solely consisted of KPMG colleagues, came from various departments within KPMG. This also had the added benefit of getting to know colleagues from departments whom you normally might not come into contact with. Besides, you get a better idea of the knowledge we already have in-house, but that is organized within different departments.

The program helped me to learn more about new technologies and methodologies that further help me within my job as a Business Analyst. For example, I noticed that the business wants to detect unusual transactions at an earlier stage during the audit. These new technologies can help auditors detect unusual transactions which will give them new insights; this is an example of digital auditing. Overall, I think that the JADS program can be of added value for a lot of professionals who already have some sort of technical background. In addition, I think that every financial expert (auditor, controller, investment advisor et cetera) who is working with data and wants to become more data-minded a data-driven and tech-oriented, this course is very relevant.

I feel that any financial expert who often works with Excel can benefit from programs like this one. This program gives you new insights and can help you approach problems in new ways. It removes the limits of thinking in terms of Excel functions and opens up new possibilities to approach problems you face during your work.

Conclusion

Digital audit transformation is difficult. However, staying competitive is a necessity. It helps us become more productive and offers exciting new business opportunities. Innovation tends to move faster than some parts of the organization. To remove these impediments and foster a culture in which innovation is embraced, we believe that education plays a key role. To bridge the gap between business and IT, we need more financial experts who are data-minded. An organization can only successfully innovate if its employees embrace a culture of innovation and are able to spot areas for improvement by using IT. Even though a natural distinction between a financial expert and a programmer will always exist. Being able to speak the same language is one step towards a future where audit and/or finance and IT are fully integrated.

We have presented three cases of people who are currently contributing to the digital transformation of the audit practice within KPMG. Each person contributed in their own way and took a different route, but the most important aspect is that they are all eager to make the digital transformation a success. They all have improved their knowledge by following a training program that would improve their ability to work in a different way. We believe that it is never too late to learn. The future holds a lot of exciting new opportunities to perform your work in a different manner. Becoming more IT-savvy can help remove inefficient repetitive work and focus on what matters. This also applies for a lot of other professions, such as internal auditors, finance professionals, advisors et cetera. To training all (financial) auditors into digital tech savvy auditors will take time, we are not sure how long it will take, but we all managed to master Microsoft Excel at some point. As a society, we have incorporated  many technical solutions and devices, such as mobile phones, in our daily activities; we are therefore positive that most will pivot their skillset in the coming years.

Reference

[Cass18] Cass, S. (2018). The 2018 Top Programming Languages. Retrieved from: https://spectrum.ieee.org/at-work/innovation/the-2018-top-programming-languages.

Using machine learning in a financial statement audit

Machine learning is a powerful technique that uses artificial intelligence to learn from data. It has uses ranging from virtual personal assistants to consumer preference prediction. However, these techniques are not commonly used in a financial statement audit. In this article we will review examples of unsupervised and supervised methods. We will also have a look at what keeps auditors from applying these techniques.

Introduction

Digitizing the audit is an ongoing effort. It started with the development of a digital filing system of audit work. This provides access to digital sources of information that are subject to the audit or that can assist in the audit work. In addition, audit procedures are now executed on entire data sets rather than on samples taken from it. The next logical step in this process is to replace conventional audit procedures by more efficient data-driven procedures.

There are many different data-driven techniques that are available to the auditor. A particular subset is machine learning, a technique that relies on the development of algorithms and statistical models that the computer can then use to carry out a specific task without further instructions. What’s more, the learning aspect refers to the fact that these techniques improve over time as they get exposed to more data.

Take for example the email Inbox. The email application comes straight out of the box with some instructions (an algorithm) that are used to identify potential junk or spam messages. As the user starts scanning the Inbox, they may have encountered some messages that were missed, and a regular scan of the Junk mail folder may reveal some messages that were inadvertently tagged as spam. Most email applications now use the fact that the user moved messages from Inbox to Junk or vice versa to update the algorithm. This happens behind the scenes; the user doesn’t have to do anything to set this in motion. And as time goes by, the application gets better and better at recognizing spam.

Machine learning in audit is not a widely used application, despite the fact that machine learning has been used in other disciplines. New applications include the personal virtual assistant, product recommendations, search engine result refining, online customer support, and online fraud detection. A good introduction on the various modeling techniques is given by [Hair14]. The authors not only explain how the techniques work; they also provide examples from literature where they were applied. For example, Multiple Regression Analysis is explained by [Hise83], who modeled the performance of retail outlets using 18 independent variables. [Desh82] used Factor Analysis to look at why some consumer product companies make more use of marketing research than others. And [Dant90] used Multiple Discriminant Analysis in their 1990 paper to determine whether there is a difference between the patients of private physicians and those of walk-in clinics. The methods and examples in [Hair14] assist in clarifying the structure of any data problem (are there similarities, is the variable of interest a continuous or a binary/categorical variable). They provide inspiration when solving audit-related problems.

In this article, we first introduce some recent innovations, and then the question why it is so hard to implement these innovations in the auditor’s toolbox will be answered.

Examples of machine learning in the audit

Machine-learning techniques can be split into two classes, unsupervised learning and supervised learning. In unsupervised learning the data scientist ‘lets the data talk’. The computer gets only general instructions, for example in the case of a clustering algorithm the number of desired clusters, which variables to use for clustering, and how the degree to which data points are similar (their distance) is defined. Supervised methods provide the algorithm with specific information on the research question. For example, when the user moves mail messages from or to the Junk mail folder, the algorithm receives information about what constitutes spam and what not, according to the user.

Example 1: Unsupervised learning – ratio analysis

Unsupervised learning can be used for the clustering of financial statement ratios. Assume that the auditor would like a dashboard with no more than six different ratios that collectively summarize the financial performance of the client. The problem is that there are close to 80 different ratios available. Is it possible to choose six of these, so that the information provided is still reasonably complete, and the information shown avoids overlap? In machine-learning terms, groups or clusters of ratios are needed, where the ratios within a cluster are closely correlated, and the correlation between the clusters is as low as possible. The factorial analysis method can help achieve this.

The starting point is to take financial statement information for a large number of companies in a specific industry. The hardest part of this exercise, and something that occurs very often when dealing with voluminous data, is to clean up the data. For example, most of the financial statement data may include numbers for Total Current Assets, and its constituent parts Cash and Cash Equivalents, Total Receivables, and Total Inventories. In some cases, the constituent parts may be missing however, and the face of the balance sheet only provided Total Current Assets, whereas in other cases one or more details are present, but the field of the total may be missing. One solution would be to discard all these cases, but the resulting database may then be dramatically reduced. Instead, going through the painful exercise of reconciling the information available may reward the researcher with a much larger database for consecutive use.

Once the base data are cleaned, the factorial analysis is carried out. The researcher makes a choice about the number of clusters desired; the computer does the hard work. If the user has specified six factors, the computer tries to find six vectors in a six-dimensional space in such a way that the total distance between each of the 80 original ratios and the six resulting vectors is as small as possible. The result of the analysis reveals the six requested factors representing clusters of financial statement ratios, as shown in Table 1. These clusters generally coincide with measurements that are of interest to financial statement users, like liquidity, solvency, profitability, asset utilization, return on invested capital, and financial market. For example, the first factor is related to profitability, the second to liquidity, the third to return on assets, etc. The next step is to choose for each of these factors which particular financial statement ratio correlated with it closest. For example, the Profitability factor (Factor 1) appears to correlate the strongest with the ratio of Cost of Goods Sold to Sales. The resulting six ratios are as dissimilar as possible, and the information contained in ratios that are not displayed resembles that of at least one of the displayed ratios. For example, once the ratio of Cost of Goods Sold to Sales is provided in the dashboard, the ratio of Cash Flow to Sales doesn’t provide much additional information, since both ratios correlate strongly with Factor 1 derived.

C-2019-4-Hoogduin-t01-klein

Table 1. Partial results of a factorial analysis on financial statement ratios. [Click on the image for a larger image]

Example 2: Unsupervised learning – journal entries

A similar approach has been taken to classify journal entries. Using the general ledger accounts and the amounts of the debits and credits, Hierarchical Agglomerative Clustering provides the desired number of clusters of similar entries. A graphical representation is provided in Figure 1. The clusters found are displayed in a two-dimensional scatterplot, with a rotation that is optimized to see as many different clusters as possible. Transactions are color-coded according to auditor knowledge about the business process to which they belong.

This helps in different ways. It identifies the main transaction streams within a company, like purchases, sales, payments, receipts, payroll, fixed asset additions, etc. In the representation in Figure 1, these show up as distinctly separate groups or clusters of transactions. It visualizes the complexity of the bookkeeping process: were control accounts used or not; how often are amounts transferred to another account until they settle in a final destination. Investigating the clusters may reveal unusual entries, for example manual entries, unexpected users or ledgers. And finally, this technique reveals common structures in companies, assisting the auditor in finding relationships between processes and financial statement accounts, as a basis for other (supervised) machine-learning techniques.

C-2019-4-Hoogduin-01-klein

Figure 1. Results of an unsupervised Hierarchical Agglomerative Clustering of journal entries. [Click on the image for a larger image]

Example 3: Supervised learning – regression analysis

The most widely known and least complicated of machine-learning techniques is regression analysis. It uses the presumed relationship between some variable of interest (the ‘dependent’), typically a financial statement account that the auditor wants to examine, and a set of predictors, financial or non-financial data that the auditor believes has a plausible relationship with the dependent variable. The relationship is ‘trained’ on data available. This typically encompasses historical data for time-series applications, or similar data (historical data or from other entities) for a cross-sectional analysis.

Using regression analysis can be a very efficient technique to identify outliers, observations that are so unexpected that they merit further investigation. The absence of outliers allows to assess the probability that the dependent is free of material misstatement. The lower this probability, the less additional audit work is required.

Regression analysis applications may be widely deployed. Obvious examples are: analysis of depreciation charges against the historical cost of fixed assets, interest expense against the balance of long-term debt, or a margin analysis between revenue and cost of sales. Particularly the availability of external data sources like economic indicators, price indices, and industry trends could have a strong effect on the effectiveness of the regression model to identify outliers and obtain audit evidence as to whether the account is materially misstated. For example, Figure 2 shows the relationship between the Revenue of an airline company and passenger seat miles (the total number of miles passengers have travelled).

C-2019-4-Hoogduin-02-klein

Figure 2. Scatter plot as part of a regression analysis. [Click on the image for a larger image]

Example 4: Supervised learning – loan ratings

As explained in Example 3, regression analysis is used on a dependent variable that is continuous, i.e. it can take any value in a certain range. But what if the dependent is a nominal variable (like gender) or ordinal (a sequence of categories in a particular order)? Similar to regression analysis there are machine-learning techniques such as logistic regression to construct models using a set of predictor variables, but rather than using the category representation (which could be completely arbitrary), the statistical technique is employed on the probability of class membership, which is a continuous variable between zero and one.

A useful application is the review of loan ratings. A loan rating is an ordinal variable ranging from AAA (the best rating) to F (the worst). The algorithm trains itself with information on the debtor, the loan, and the collateral to fit a predictive model that helps estimating the most probable class membership for each loan. The auditor then compares them to the ratings established by the client and investigates those loans that show the largest classification differences.

Example 5: Supervised learning – journal entry testing

It is very common, nowadays, that banks and credit card companies send their customers a message when they have identified a suspect transaction. This is a great example of a supervised learning technique on nominal data. The algorithm is trained on large volumes of transactional data, some of which are fraudulent, and others are not. There could be very many predictors, each of which have predictive power in the model. If a customer rarely buys shoes on the internet and suddenly does so, this raises a flag, but it does not for users who buy shoes online on a regular basis.

These techniques can also be used as part of an audit and have been used for a long time in forensic audits. The hardest part in this case is to obtain sufficient examples of fraudulent or otherwise incorrect transactions. This is the reason why these techniques are not very common yet as part of a normal financial statement audit.

Barriers and roadblocks

Despite the potential of these new techniques, their application is not as common as could be. Even though the main barriers, like the availability of good data, statistical software and fast computers that can work with huge amounts of data, have now been overcome, there are a number of remaining issues that need resolution.

  1. Data pooling. There has been much debate as to whether information obtained from one audit client could be used to assist in the audit of another. Does training the algorithms on sets of data from different audit clients therefore constitute a problem?
  2. Audit evidence. Auditors clearly see the advantage of machine-learning tools where it comes to identifying outliers. But the question as to whether the absence of outliers can be regarded as substantive audit evidence has not been solved until recently ([Boer19]).
  3. Data accuracy. Using supervised learning to assess whether or not an account is materially misstated using independent data shifts the burden of auditing the data of the dependent data to auditing the independent data.
  4. Familiarity with statistical models. Auditors have not been sufficiently trained in the use of machine learning and statistics. Field auditors are therefore reluctant to use techniques they don’t understand, and internal and external regulators cannot approve the use of techniques that cannot be explained to them.
  5. Innovation cost. Development of machine-learning techniques for general use in the audit is costly, and the development cycle can stretch over multiple years. It is tempting to use innovation budgets on short-term wins however short-lived they may be.

The way forward

Each of the barriers and roadblocks mentioned before can be overcome. It will require some fundamental discussion, but the outcome will be an audit approach that allows the auditor to reduce spending time on areas that do not merit such a lot of manual work, to provide audit evidence on a much timelier basis, and to focus on high-risk areas. The use of machine-learning techniques is an essential first step that enables continuous monitoring and continuous assurance. There are solutions for the barriers and roadblocks identified earlier:

  1. Data pooling. Rather than pooling data and run an algorithm on the data mass, the algorithm continues to train itself on each new data set. Its effectiveness therefore increases after every single use. This requires that the algorithm does not store any of the data it used for training, but only new coefficients for each of the predictors used.
  2. Audit evidence. [Boer19] explains how the risk of material misstatement should be calculated if a predictive regression model reveals no outliers. Similar techniques can be developed for classification techniques and other predictive analytical procedures.
  3. Data accuracy. There are many data sets publicly available that can be used as independent variables for a predictive model. Data accuracy is verified once by those maintaining the repository, allowing the auditor to rely on its accuracy.
  4. Familiarity with statistical models. The author experiences an increase in auditor willingness to expand their personal skillset to include statistical modelling. Also, many universities now offer data science courses for auditors. As soon as field auditors experience the advantages that machine-learning techniques provide, their skepticism and fear will be reduced.
  5. Innovation cost. Not all innovation needs a multi-million investment. It could be as easy as a single application of a new technique on a single engagement, then share the success and try to use the same approach on similar engagements. Procedures are now in place to enable the sharing of intellectual property between engagement teams, as well as safeguards to ensure that the application works as advertised. Once approved, these applications can then be made available within a country, or even globally.

Conclusion

Auditors have access to vast amounts of data. They can use these to more effectively gather evidence to support their opinion. Machine-learning techniques are very powerful tools that the auditor can employ to reach his audit objectives. Even though these techniques have so far not been widely used as part of a financial statement audit, in other areas they have proven their added value. The barriers and roadblocks that keep auditors from their use can be overcome if needed.

References

[Boer19] Boersma, M., Hoogduin, L., Sourabh, S., & Kandhai, D. (2019). Audit Evidence from Substantive Analytical Procedures. Proceedings of the 2019 American Accounting Association Annual Meeting.

[Dant90] Dant, R.P., Lumpkin, J.R., & Bush, R.P. (1990). Private Physicians or Walk-in Clinics: Do the Patients Differ? Journal of Health Care Marketing, 10(2), 25-35.

[Desh82] Deshpande, R. (1982). The Organizational Context of Market Research Use. Journal of Marketing, 46(Fall), 91-101.

[Hair14] Hair Jr., J.F., Black, W.C., Babin, B.J., & Anderson, R.E. (2014). Multivariate Data Analysis, Seventh Edition. Harlow.

[Hise83] Hise, R.T., Gable, M., Kelly, J.P., & McDonald, J.B. (1983). Factors Affecting the Performance of Individual Chain Store Units: An Empirical Analysis. Journal of Retailing, 59(2), 22-39.

[Hoog11] Hoogduin, L. & Touw, P. (2011). Statistiek voor Audit en Controlling. Amsterdam.

How audits can be transformed when access to data is no longer the bottleneck

Advances in information technology and data & analytics capabilities offer significant opportunities for all layers of an organization to work in a more effective, efficient, and controlled way. Applying data & analytics is often one of the first steps organizations undertake to reach these goals. Although most organizations are aware of the value that can be unlocked, there is much left to be gained in terms of the actual application of data & analytics procedures in the audit, risk, and control domains. In this article, we will illustrate how the Data & Analytics capabilities of in-memory database technology can enable and support all lines of defense.

Introduction

Without a doubt, all departments of an organization are impacted by the rise of data & analytics, but specifically in the audit, risk, and control domain applying technology-supported data & analytics can reshape the way of working and unlock significant value. For those organizations that make use of data & analytics to support the three lines of defense, the typical end-to-end process consists of some form of data copy, e.g. the extraction of ERP data and transfer of data to a Data Warehouse, running data and analytics procedures, and finally consolidating insights from these outcomes. New in-memory database technologies like SAP HANA, however, offer significant opportunities to reshape this end-to-end process.

In-memory database technology introduces the ability to integrate audit analytics much deeper into the audit, which allows the external auditor to perform audit procedures more efficiently, effectively, and accurately. When this process is streamlined, data procedures can be performed shortly after financial periods close while maintaining consistency, flexibility and ease of use, which makes any findings and insights a lot more useful and relevant to the business. Furthermore, when the approach is centralized and harmonized, internal control and audit functions will be able to rely on the results to exercise control and perform audit procedures.

First, we will introduce the concept in-memory database technology offered by one software vendor: SAP AG. Next, the performance promise of this technology is described, as well as the impact on audit procedures. Lastly, we illustrate this impact through a use case in which we industrialized the approach.

Introducing in-memory database technology: SAP HANA

In 2010, SAP AG introduced its SAP HANA database technology. Ever since the introduction there has been a lot of excitement around this new technology. However, many organizations struggle to obtain business value from this technology, as they do not take complete advantage of the possibilities in-memory database technology brings. In the course of this article we will focus on the value SAP HANA technology can bring for an organization.

SAP HANA technology vs. SAP S/4HANA explained

The terms SAP HANA and SAP S/4HANA are quite commonly used in conversations, which poses the question whether both terms can be used interchangeably. The short answer is “no”. There is a difference: SAP HANA is an in-memory database technology which acts as the core technology for both SAP or non-SAP applications, whereas SAP S/4 HANA is a new generation ERP solution which runs on SAP HANA database architecture, and offers new functional updates and applications to streamline business processes.

SAP HANA

SAP HANA technology can be best described as a modern database technology. What makes it different from a classical database technology is that data is stored in a column-oriented way and that data is stored in-memory.

  • Column-oriented storing of data is the concept of storing all data for a database table in one location, instead of the classical approach in which all data for one row is stored in the same location. The main advantage is the possibility to compress similar types of data in a single column, which means that significant volumes of data can be stored in one system.
  • Storing data in main memory instead of on a physical disk provides a magnitude of faster data access possibility and in extension faster querying (data and analytics) and processing. However, if all data would be stored in main memory, this would have a huge impact on the costs. Therefore, SAP developed an approach which they termed “Dynamic tiering” which observes data access patterns, and stores frequently accessed, or “hot”, data in-memory while the less frequently accessed “warm” data is stored on disk, which is less costly.

S/4 HANA

SAP S/4HANA, which is short for “SAP Business Suite 4 SAP HANA”, will form the new ERP SAP core application environment for the coming years. It is the successor of SAP R/3 and SAP ERP and is optimized for SAP HANA in-memory technology. It is expected that SAP S/4HANA will become the SAP standard in the upcoming years, as support for the previous release (ECC 6.0) will be deprecated per 2025. S/4 is an ERP software package which aims to cover all day-to-day processes of an organizations (such as ‘order-to-cash’, ‘source-to-pay’, ‘plan-to-make’ and ‘record-to-report’). As S/4HANA only runs on SAP HANA databases (in contrast to SAP’s earlier products R3 and ECC which could also run on database platforms from other database software vendors) it is packaged as one product: SAP S/4HANA.

The performance promise

In a report published by Gartner in June 2019 ([Idoi19]), it is stated that businesses now commonly deliver business insights via modernized analytics. A second wave of modern platforms that disrupt IT-led enterprises are expanding their capabilities. Data and analytics leaders are looking at in-memory technology to help them expand their analytics modernization to quickly deliver insights to the business and the performance capabilities of SAP HANA technology are key components to this strategy.

Organizations that perform analytics without in-memory database technology encounter difficulties in obtaining data from their complex architecture of IT systems and are often set back due to the huge data volumes. As such, creating unified insights on top of this is often perceived as cumbersome, slow and labor-intensive. SAP HANA technology promises direct reporting and analytics in a central source on top of huge volumes of real-time transactional data.

Impact on the audit

When all ERP transactional data can be accessed, processed and analyzed in real time in one system, this implies the following for audit procedures;

  • Grabbing the momentum. Historically, audit data analytics suffer from throughput times of ‘weeks’ if not ‘months’ to go from data to insights. With real-time analytics, audit insights can be presented at any time to the relevant stakeholders, for instance right after period close, based on a single data copy.
  • Bring analytics to the data, instead of data to the analytical environment. As all data to be analyzed resides in one system, any analytical needs from the business can be fulfilled immediately without having to wait for the data to become available in an analytical environment which is only refreshed periodically.
  • Automation of routine activities. Routine-, standard-, and labor-intensive test procedures can be fully automated, allowing auditors to spend more time on the identification and mitigation of high-risk items requiring significant human judgement and effort.
  • One source of truth: Decisions by all parties involved, ranging from the business to the external auditor, are made based on the same fact sheet.
  • Being quickly able to respond to changes in the risk universe. Opposed to rigid audit procedures it is possible to make use of ad-hoc and tailor-made analytics on a flexible basis to react promptly on changes in the risk universe.
  • Audit continuously. The technology enables companies to turn data-driven audit analytics into real-time monitoring rules that automatically trigger alerts towards the right people in the organization, embedding the control mindset into daily operations.
  • Equipping the business to be in control. Actionable insights, generated on a continuous basis, allow process stakeholders to exercise more control, thereby reducing the work required for the other lines of defense.
  • Focus on putting insights into action. There is significant less effort required in the end-to-end process to go from ERP data to insights, as data sources do not need to be merged or reconciled with each other. This allows process stakeholders to focus on the follow up of the risk insights (automatically) generated.
  • Test fewer systems. We typically find that fewer systems are required to be in scope of an audit as the number of data migrations within the landscape is reduced and risks of data in transit are therefore not run.

To illustrate the aforementioned advantages, we refer to the next section for a use case.

How the global audit changed: a use case

Organization

We look at a leading Fast Moving Consumer Goods company with branches in more than 170 countries. To support their daily operations, a complex IT landscape which consists mainly of software products delivered by SAP AG has been in place for years. Refer to Table 1 for general characteristics of the company and their IT landscape.

As there were a significant number of SAP components and the corresponding interdependencies in the SAP landscape were highly complex, there was notable room left for standardization. For this reason, a program was launched to considerably simplify and rationalize the ERP architecture by introducing SAP HANA technology.

C-2019-4-Emens-t01-klein

Table 1. Characteristics of the organization and their IT landscape. [Click on the image for a larger image]

Introducing the global audit

As this organization is operating on a global scale, it is of utmost importance that the financial audit is not only effective, but also performed efficiently and consistently across the world. Based on this ambition, data & analytics were introduced to create a data-driven audit. In this data-driven audit, procedures previously completed manually for risk assessment, controls evaluation, and substantive testing are supported by data & analytics routines. Instead of having to rely on a sampling approach, it becomes possible to focus on the full population of relevant transactions. An example related to control evaluation is the analysis of segregations of duties in the order-to-cash process to identify whether any business users have maintained sales orders and increased the credit limit of the same customer within the audit period. Another example of a D&A routine related to substantive testing is the identification of high-risk journal entries by analyzing all general ledger entries produced by all entities in scope against a set of predefined criteria.

In total, 160+ scripts are applied on six business processes and more than 50 controls. The generated insights and exceptions are distributed to 100+ audit teams across the globe for the teams to be used in their local procedures to form their audit opinion.

C-2019-4-Emens-t02-klein

Table 2. Key figures of the global audit. [Click on the image for a larger image]

From data to audit insights on a global scale

The aforementioned D&A-supported audit approach was initiated before the introduction of in-memory database technology. To illustrate the impact of this technology, we will describe the steps involved to go from data to insights prior and after the implementation of SAP HANA technology.

Prior to the use of SAP HANA database technology

C-2019-4-Emens-01-klein

Figure 1. End-to-end process to go from data to audit insights prior to the introduction of SAP HANA technology. [Click on the image for a larger image]

Figure 1 outlines the steps involved to deliver audit evidence through data & analytics. The end-to-end process resemblances, on a high level, the one as described by [Loo15] and generic in a sense that it is applicable to all types of ERP systems used to record business transactions. What follows is a more detailed breakdown of the steps involved to go from ERP data stored in the SAP system of the organization to audit insights used by audit teams around the globe.

Data Extraction

The process starts with the extraction of data from the ERP system. Given the sheer number of controls to be analyzed, and depth of analysis performed, it is not feasible to rely on standard SAP reports only to generate insights required. Data is extracted by means of extraction programs deployed in the SAP ERP systems to cope with the large data volumes. In total six processes are being analyzed. Data extracted ranges from master data in these processes to accounting data, logistic data, and configuration data on business transaction level.

Data Transfer

Once data is extracted from the SAP ERP systems it resides on the SAP Application servers. To analyze the data, it needs to be transferred to the IT landscape of the external auditor. Multiple options exist in this stage of the process, ranging from a (well-secured) online file transfer environment to a physical pickup. No matter the carrier, when data is copied, completeness checks are performed to verify that all data that was saved on the ERP system has been copied to the carrier.

Data Upload

Once the data has been transferred, it is uploaded to the external auditor’s analytical environment for analysis. After the upload is completed, data checks are carried out to ensure the completeness and accuracy of the data before the “staged” dataset can be used in the subsequent analysis phases.

Data Analysis

After the data is deemed accurate and complete, 160+ scripts in the external auditor’s analytics environment are executed on the data to combine the extracted raw tables (e.g. master data, sales data, etc.) and generate relevant audit insights.

Insights reporting

In the previous step, relevant audit insights have been generated for more than 50 controls. The insights gained are then split and distributed among the teams in each country, resulting in over 10 thousand files per audit run (160+ scripts and 100+ teams). This is a necessary step since local teams need to evaluate the results because processes (and therefore findings on those processes) may deviate locally from the global standard.

Putting SAP HANA database technology to work

C-2019-4-Emens-02-klein

Figure 2. External audit process using SAP HANA technology in the organization’s IT environment. [Click on the image for a larger image]

Figure 2 outlines the steps involved to deliver audit evidence with the use of SAP HANA technology.

Data & Analysis

Two key characteristics of SAP HANA technology are: all ERP operational data is uniformly and in real-time available in one source, and significant volumes can be analyzed in a fast way. As a result, less work is required related to data extraction and transfer to the external auditor’s environment, as analytics are applied in the system directly, anytime, on this data.

To illustrate based on our use case, the throughput time decreased from two months to less than one week. In the old process, the data that could be analyzed depended on the data that was extracted from the ERP system, and the auditor’s analysis environment may not have all the tables required for ad-hoc analytics. As the analytics are applied in the same system where all the data (tables) reside, this constraint is not applicable anymore. With a throughput time of one week, it becomes possible to run analytics whenever required, as well as to run ad-hoc (new) analytics due to e.g. changes in the risk universe or new insights into a business process resulting from interviews or other observations. Also, in the old situation the extraction of data tables from the ERP server put significant load on the system for multiple days for every audit, and safeguards were put in place to make sure that enough data space would be available on the application server and that the extraction batch jobs would not fail. This is no longer necessary, ensuring a more reliable audit process and – timeline. We furthermore note that data transfer to – and upload in – the auditor’s external data environment is not applicable anymore. Correspondingly, the risks involved related to data integrity and privacy in the data transfer are also mitigated. Lastly, the number of completeness and accuracy checks required has significantly decreased; the number of data files received from the company has decreased from 400+ SAP ERP tables per system, to 50 audit reports in total.

Insights reporting

It is no secret that audit teams work under pressure to complete all audit procedures in time; any delays in receiving the required risk assessment, controls evaluation, or substantive test risk insights following from the D&A approach and used in follow up audit work have a significant impact on the overall timelines of the audit. In the new process, audit insights are available for all teams across the globe, anytime, anywhere, and on any device via online dashboards. The risks involved with any delays in the end-to-end process have therefore been significantly mitigated. In addition, the online web environment has drill-down features for the dashboard user to filter on different data attributes, for instance to support dynamic conversations with the audit client.

Value for the external auditor

The previous section already hints at realized efficiencies and unlocked opportunities in the end-to-end process, given that the number of steps required have significantly reduced. What follows is an overview of the value created for the external auditor.

Real-time analytics result in an efficient and flexible audit process The reduced number of steps involved to go from data to analysis to insights is reduced significantly, as the need for data extraction, data transfer, and completeness & accuracy reconciliations has become obsolete. As a result, audit insights are available right after financial period close and can be followed up directly, instead of weeks or months after the fact. To put this into perspective, audit insights related to the full fiscal year are available at the beginning of January, which means that fewer or no roll-forward procedures are required.
All stakeholders work from the same fact sheet A single source of truth for data and audit facts forms the basis for all stakeholders involved across all layers of the organization (including all layers of defense) as well as the external auditor. As a result, all parties involved work from the same fact sheet, and all communications can focus on risk evaluation, root cause analysis, and an approach for remediation.
Fewer audit procedures required as data in transit is minimized We anticipate that a reduced number of audit tests need to be performed because data is no longer distributed throughout the IT landscape and data at rest forms the basis of the audit. In other words, tests concerning data completeness and accuracy at the transfer phase no longer have to be performed if there is no data in transit between the organization and the external auditor, as well as within the IT organization of the audit client.

Value for the organization

As described by [Daan11], business cases related to IT investments are usually not motivated by the desires of the external auditor to employ an innovative audit approach. Business cases are driven by the desire to improve the business; hence, what follows are important elements for a positive business case.

By actionable insights, first line of defense can exercise more control The solution brings clarity and actionable items which enable the control on processes to users all over the globe. These insights allow users to take a step back from the day-to-day activities and focus on risk and compliance areas that require attention and judgment.
Enabling a feedback loop back from audit insights to process improvement The solution is the first step in facilitating continuous control monitoring. With building blocks such as ‘alerting’ and ‘follow-up for remediation via workflows’, the loop can be closed in facilitating all lines of defense, ensuring appropriate processes for sustainable risk identification and mitigation.
Shift audit effort to high-risk findings and follow up When minor findings are resolved automatically and in a timely manner, all lines of defense can shift the focus to high-risk insights and follow-up, reducing efforts on manual and labor-intensive audit –and compliance support activities with little incremental value for the organization.
Basis has been established for an analytics-driven business The knowledge, skills, and capabilities gained to set up analytics on a global scale open the doors to incorporating other types of analytics in the business, for instance in the growth and efficiency domains (
[Donk14]). Rapid changes in the organization’s environment can be quickly analyzed as all data is always available (and not archived) for analysis.

Conclusion

In view of the significant advances in information technology capabilities available on the market, we have described how one of these technologies, in-memory database technology, can transform the way an audit is performed, and how control is exercised in business processes. As all required audit data resides in one system and can be analyzed in huge volumes in a fast way without involving data copies to analytical environments (e.g. data warehouses), it becomes possible to automatically generate risk and audit insights on a real-time basis and enable stakeholders to primarily focus on risk remediation and mitigation. This doesn’t just put the business in control; it also offers a single source of truth to all risk stakeholders ranging from the first line of defense to the external audit. Also, any analytical needs from the business can be quickly fulfilled without having to wait for the data to become available, for instance to respond to changes in the risk universe.

We illustrated this with a SAP HANA technology use case in which the external auditor’s data-driven audit approach significantly changed the risk and controls efforts executed by all layers of the audited organization.

It can be concluded that there is an exciting future is ahead for organizations that want to analyze large volumes of ERP transactional data in real time. However, we would like to conclude with three key takeaways which should be kept in mind:

Data & Analytics happens between the ears. No matter the superiority of the technology, the strength of the analysis performed, or efficiencies gained, the process to get from data report to relevant and actionable insights “happens between the ears”. Technology can enable the business in generating results in a fast, complete and easy to use way; it is, however, the step of getting actionable insights from the results that make an impact on the business; insights alone don’t initiate a change.

Top down and bottom up should come together. The technology supporting the delivery of relevant audit insights is one that is ‘top down’ in nature as all ERP data of all businesses is analyzed and insights are made available at a central level. However, these insights delivered are also a call for action; most value is generated when actionable insights are followed up by employees throughout the organization to ensure a better control of processes. This way, there is both a “push and pull principle” for risk insights, follow-up, and remediation.

A new way of thinking is necessary. Embracing a data-driven approach requires organizations to prepare their personnel and end users to work and think in new ways. Employees in the business are uniquely positioned to bring in anecdotal evidence based on their experiences from the past to put the figures from a report into perspective. Both worlds need to learn from each other: end users can benefit from a better understanding of how their systems and data & analytics work to adopt a data & analytics driven mindset. Vice versa, auditors should listen to the anecdotes presented by business employees and bring that perspective into their understanding of the process and the data.

References

[Daan11] Daanen, H.T.M., Biggelaar, S.R.M. van den & Veld, M.A.P. op het (2011). Audit Innovation. Compact 2011/0.

[Donk14] Donkers, J.A.M. (2014). Maurice op het Veld en Bram Coolen over Data & Analytics. Compact 2014/2.

[Idoi19] Idoine, C., Richardson, J. & Sallam, R. (2019). Technology Insight for Ongoing Modernization of Analytics and Business Intelligence Platforms. Gartner Research 2019/06.

[Loo15] Loo, L.P. van, Zegers, A.T.M. & Haenen, R.C.H. (2015). Data analytics applied in the tax practice: Turning data into tax value. Compact 2015/1.

Data-driven insights to Robotic Process Automation with Process Mining

Many organizations are making efforts in automating their mainly manual processes. However, there’s currently a large amount of guess work and subjectivity involved in assessing the processes that might qualify for automation and keeping track of improvements. Process Mining can be a powerful ally in bringing data-driven insights to support and substantiate process owners’ and developers’ decisions as well as quantify enhancements brought about by automation.

Introduction

Robotics Process Automation (RPA) has become an interesting topic within organizations, as it provides a quick and efficient method to implement and execute processes. There are many enterprise automation tools available for organizations. RPA uses software-based robots that are at the top of the IT infrastructure to perform high volume tasks without changing the existing architecture and allowing for agile implementation of an RPA project.

Organizations are moving towards standard back office processes to cut costs and improve efficiency. RPA is frequently implemented in such cases, with the idea that high volume and repetitive tasks can be automated. This leads to an increase of first-time right (limiting human error), a decrease in labor costs, and freeing resources to focus on more value adding activities where human creativity can bring competitive advantage for a business. However, several RPA projects fail to stay within budget, and time and return of investment is usually not delivered as expected. This is often caused due to false notion of process complexity and lack of transparency on how processes are being executed ([Kirc17]).

Process mining technology offers a set of novel tools and techniques for factual driven analysis of business processes. This technology uses the abundance of event data to provide an end-to-end and transparent view of processes. This paper explains how process mining can be leveraged to accelerate and improve the quality of RPA projects and measure its results.

In this article we will first introduce process mining along with its most common techniques. This is followed by an introduction to RPA and the different stages of a typical RPA project. We will then dive into how process mining can be applied for a successful RPA implementation. This is also further contextualized with the help of a running example. Lastly, we will conclude this article with how RPA projects can benefit from process mining techniques.

Setting the Scene

In every organization, process execution data is constantly been logged in different source systems. This data, also known as event logs, contains information about the events that are being executed for each instance of a process. For example, a patient treatment process in a hospital may consist of the following events: the registration of the patient, first appointment, examination, diagnosis, preparation of the care plan, etc. Process mining learns a process by example from these event logs and provides insights into and transparency about how the business processes are being executed. One of the most common techniques of process mining is process discovery, where information from an event log is extracted to build a process model. These models represent the as-is process within the business. Using process mining, it is possible to detect different variations of a process or compare a process between regions, periods of time, suppliers, customers, etc.

Furthermore, process mining provides insights into the distribution of the different users active in a process (e.g. manual users versus, system users) and handover of work between them.

Other important process mining techniques are conformance checking and model enhancement. Conformance checking is done by mapping the extracted log against the discovered or hand-drawn process model. This mapping is used to detect and capture deviations that are caused due to the difference in the behavior of the logged data and the business process. Model enhancement is used to extend a process model with additional information extracted from the event log. For example, the additional information can be extracted from timestamp information (time perspective) or from data attributes that characterize the process (data perspective). This can be further used to repair and alter the process structure ([Aals16]). The presented set of techniques, when combined, can be leveraged to obtain valuable insights for RPA projects.

RPA is an umbrella term for tools that operate on the user interface of other computer systems in the way a human would ([Aals18]). In other words, technology is used to configure computer software robots, also named bots, to emulate human executions of business processes in digital systems. RPA bots use the user interface to capture data and manipulate applications in the same way humans do.

There is a range of processes that has been tried and tested, making them ideal options for RPA. Checking vendor invoices, handling routine insurance claims, or processing loan applications are just a few examples where RPA has been used successfully. In general, all processes that are high-volume, business-rule-driven and repeatable are perfect candidates for RPA.

C-2019-3-Bisceglie-01-klein

Figure 1. RPA project lifecycle. [Click on the image for a larger image]

In order to understand how Process Mining can aid an RPA project, it’s necessary to understand how such projects are carried out and the stages they typically go through. Figure 1 shows the four different stages of an RPA project lifecycle and is explained in detail as follows:

  1. Assess: Before starting an RPA project, it’s important to understand the existing processes that potentially qualify for automation and how they unfold within the company. Once the candidates are chosen, a series of interviews with the process owners follows, aiming to map the process, its steps, and decision points. This phase can be very lengthy due to conflicting accounts from various process owners, which then need to be aligned to form a clear picture. This occurs because organizations don’t always have a clear overview of how a specific process should be carried out, let alone how it unfolds daily. After a process structure has been pieced together, the clear and defined activities and their sequence are turned into the logical basis for the bots.
  2. Program & Test: The following stage in the RPA lifecycle is to turn the devised process logic into a script that will be followed by the configured bots. The program is tested and the process owner and RPA team can assess whether its purpose is being fulfilled. As expected, a few iterations are needed to ensure the process is performed flawlessly by the bots. It’s worth mentioning that it’s not always going to be possible to automate 100% of the cases, because they might contain exceptions ruled by more complex logic. The bots are tested in a controlled environment, preferably using synthetic cases.
  3. Mobilize & Implement: Once the testing is complete, the bots can be deployed to start handling day-to-day occurrences of the newly automated process. The deployment format depends heavily on the client’s preferred approach. It can be gradually implemented across departments or by switching the procedure for the entire enterprise overnight. Regardless of the chosen methodology, employees need to be trained in the new process and which actions they need to perform within this process.
  4. Measure & Sustain: As seen in Figure 1, the project doesn’t end with the implementation of the bots. Even after extensive testing, the programming of the bots is not impervious to errors caused by sudden changes to the process (e.g. software updates). Consequently, it is crucial to routinely monitor the bots’ performance in order to detect such problems and quickly update the program to accommodate the changes. Furthermore, continuous monitoring of the amount of cases handled by bots and how that relates to their maximum usage is key in accounting for the project gains and computing return of investment.

How can Process Mining help?

Process Mining can aid most phases of an RPA Project, generating valuable insights that reduce project timeframes and promote more informed decisions. In order to better showcase the added value, a running example with a Purchase to Pay process is given throughout this section. However, the methodology is process agnostic and therefore similar benefits can be achieved for other processes.

Process discovery removes the intrinsic subjectivity of the interviews when mapping the process and significantly shortens this lengthy step. By mining an event log instead, it’s possible to get the most accurate representation of the as-is process as well as different variants that occur. This analysis is especially interesting when drilled down to relevant dimensions, because it allows to spot possible discrepancies. Once singled out, these can be either standardized or marked as exceptions to the main process.

The event log also provides information indicative of the current automation rate as well as the processing time of each activity. The current automation rate refers to the ratio between the number of activities performed by a system user and the total of activities performed. This can be calculated both for the whole process or by specific activity. The manual processing time of each activity refers to the time a manual user (employee) spends actively performing that task. This information paints a clearer picture about which parts of the process are in greater need for automation and would yield the highest returns: those with lower automation rates and higher manual hours. This preliminary analysis helps narrow down the activities that are worth inspecting further.

For the selected activities, an individual analysis can be made. It is possible to visualize all paths going in or out of each activity, giving more insight into their suitability for automation. The paths going in and out of each activity provide insight on the possibility of automating a sequence of activities instead of just one. If the process is straight-forward in a way that several activities don’t have complex decision points and do not require human verifications, bots can be programmed to automate the entire batch of activities (or in some cases the whole process).

This analysis can be leveraged to create a business case for the automation of each activity or batch thereof. Consequently, it allows for quantitatively prioritizing which automations should be carried out and in which order they should occur so returns can be maximized. In sum, process mining is a powerful tool to accelerate project timeline and provide information for well-based, data-driven decisions in the assessment phase of RPA projects.

Running Example

Using process discovery, it’s possible to immediately see the as-is process, with no room for subjectivity about the order in which the activities were performed as showcased in Figure 2. On the left side, the process is displayed with all activities and paths that occur in the selected variants on the right side (four variants with highest frequency are chosen). The numbers on the arrows in the process mark the number of cases within the current selection in which that connection occurs. The percentages below the label of each activity indicate its automation rate and the colors are associated with an arbitrary scale that marks red when the automation rate is lower than 45%, yellow between 45% and 55% and green above 55%. For a good balance between process variant representation and comprehensive visualization, we chose to display only the top 4 variants, which cover 75% of cases as seen in the lower right corner. It also shows an astounding 252 variants, most of which are unwanted.

Also noteworthy is the occurrence of change activities. The mined process flow shows that “Change Price” occurred more than 7.000 times just in the considered variants. Change activities are often a byproduct of human error and indicate process rework and consequently lengthier process throughput times. Automating the creation of the purchase order could help reduce the number of change activities significantly, and, therefore, the rework needed.

C-2019-3-Bisceglie-02-klein

Figure 2. Process model discovered for four variants of the example Purchase to Pay process with highest frequency. [Click on the image for a larger image]

C-2019-3-Bisceglie-03-klein

Figure 3. Scatterplot of the Manual Rate versus Manual Time for each activity in the process. [Click on the image for a larger image]

Figure 3 sorts activities based on the manual execution rate and the total time spent on manual execution of the activities. By having a closer look at the manual execution rate per activity and the total hours spent on them, it’s possible to narrow down the number of automation candidates to ‘Create Purchase Order Item’ and ‘Book Invoice’. As illustrated in Figure 3, activities ‘Create Purchase Order Item’ and ‘Book Invoice’ are executed often manually (70% and 65% respectively) and the total time spent on manual executions of the these activities are around 6.800 hours for ‘Create Purchase Order Item’ and 5.750 hours for ‘Book Invoice’.

For these two activities, a more in-depth analysis of the paths going in and out of each was made. The following analysis will focus on ‘Create Purchase Order Item’. As seen in the top table of Figure 4, activity ‘Create Purchase Order Item’ is executed 39.244 times after activity ‘Create Purchase Requisition Item’ which is in accordance with how the process should be carried out. Examining the activities following the creation of the purchase order item in the bottom table of the same figure, it’s clear there are no complex decisions to be made: the next activity should be ‘Send Purchase Order Item’ (for 45.588 purchase order items, the sequence <Create purchase order item, Send purchase order> is observed). It also shows a significant portion of the created purchase order items (1.123) get refused. If the refusals are caused by human errors, automating the purchase order item creation could help bring down the refusal occurrence. However, if the refusals are governed by a more complex logic that would require human interference, it already indicates that automating a sequence of activities following the creation of the purchase order item might not be feasible.

C-2019-3-Bisceglie-04-klein

Figure 4. Tables showing activities preceding and succeeding ‘Create Purchase Order Item’. [Click on the image for a larger image]

Finally, a rough Business Case was put together for the ‘create purchase order item’ based on:

  • number of manual executions;
  • targeted automation rate;
  • average processing time;
  • full time employee (FTE) yearly hours;
  • FTE annual salary average.

As seen in Figure 5, the last four criteria are customizable which allows for more accurate projections of FTE and monetary savings. Based on the Business Case, a decision was made to simulate the automation of ‘Create Purchase Order Item’ with a targeted automation rate of at least 80%. This number considers that it might not be possible to automate 100% of cases due to input from a different source or in a different format from those the bots are programmed to handle. Possible fluctuations in the automation rate due to external factors such as software updates are also considered.

C-2019-3-Bisceglie-05-klein

Figure 5. Process mining supported Business Case. [Click on the image for a larger image]

Moving forward in the project, process mining can be used to compare the bots to non-RPA supported executions of the process during testing. This gives a better overview of case coverage and process changes. The latter encompasses unexpected desirable and undesirable alterations caused by the automation. The positive ones can be incorporated whereas the negative ones can be used for improving the bot scripts in order to be avoided. However, bot-handled cases at this stage are limited by constraints of the chosen test method. As they cannot be trained for all scenarios, more insights will be gained once they start operating real cases and are confronted with situations that could not have been anticipated. Those may be caused by different factors, for example software updates.

As multiple iterations are needed to perfect the final script the bot will run on, benchmarking the executions of each script to the other allows for comparing throughput time, case coverage and key process indicators (KPIs) on each iteration. Once the bots are ready to go live, it’s possible to visualize the progression of the main KPIs and the process itself throughout it. Process mining facilitates managing the implementation progress with greater refinement and precision of the meaningful dimensions for each process and enterprise.

After the bots are fully operational, the process can be monitored live to guarantee the RPA benefits are consistently upheld and to immediately spot alterations in the KPIs that suggest a need for adjustments in the bot scripts. Additionally, end-to-end monitoring evinces unforeseen or previously unmeasurable benefits, such as sharp drops in the amount of rework by reducing human error. Furthermore, as event logs may also contain information regarding users (both humans and bots), it is possible to keep track of how many activities are being performed by each bot and the extent of the new processing time. Finally, since all these insights are backed by solid numbers extracted from the event log, they can be used for calculating gains and computing return on investment.

Running Example

Using information extracted from the event log, it was possible to create a clear view of the progression of the automaton rate throughout RPA implementation and afterwards. Figure 6 shows the simulated trend of the automation rate of activity “Create Purchase Order Item” during the 2-month implementation phase and over the following two months. We observe that during the implementation phase the automation rate fluctuates, as it would be when the bots would be implemented across departments, considering possible final fixes needed in the bot’s scripts. After implementation is completed, the automation rate of the activity increases and remains relatively stable.

C-2019-3-Bisceglie-06-klein

Figure 6. Automation rate progression throughout RPA project implementation. [Click on the image for a larger image]

Mining the event log also brings solid numbers regarding the status of KPIs that are otherwise hard to measure, such as the number of process variants and the manual hours spent on the process or the automated activity. This can be seen in Figure 7 where we compare the as-is process before the RPA implementation against the process discovered from the event log that was generated after the RPA implementation. The automation rate has increased by 11,3%, total frequency of manual activities decreased by 70.000, and total (manual) processing time has decreased by 17.400 hours. Moreover, it sheds light into a by-product gain of the automation initiative: reduction of change activities throughout the rest of the process and the consequential increase in process standardization. This is evidenced in Figure 7 by a 74,4% decrease in the number of change activities and 21% decrease in the number of process variants. By bringing data-based numbers regarding the occurrence of change activities, it’s easy to quantify the improvements made in process efficiency.

C-2019-3-Bisceglie-07-klein

Figure 7. Process variants and KPI comparison before and after an RPA project. [Click on the image for a larger image]

Finally, the new number of manual executions combined with the input given before the automation effort allowed us to monitor the business case created before the RPA project and keep track of the financial gains obtained. For this running example, Figure 8 shows a decrease in the number of FTEs currently needed to perform this activity 4,23 (as shown in Figure 5) to 1,5, a drop of 64,5%. Similarly, the figure shows the saved processing time amounted to 5.460 hours and roughly estimated monetary savings achieved € 101k after the activity “Create Purchase Order Item” was automated.

C-2019-3-Bisceglie-08-klein

Figure 8. Updated process mining-supported Business Case. [Click on the image for a larger image]

Conclusion

In conclusion: process mining techniques can provide a basis for assessing where business processes can be automated. These techniques allow for data-driven decisions at different stages of an RPA project, eliminating guess work and reducing failures. By analyzing the as-is process for automation, a fact-based assessment can be done to analyze the process fragments that can benefit from automation. Furthermore, these techniques can be extended to analyze the automated process during the testing and implementation phase. Such data-driven decisions in combination with the continuous monitoring of RPA implementation leads to reduced costs and risks. This has been shown with the help of a running example on a purchase to pay process which has been implemented within the KPMG RPA Scout app in the Celonis platform.

References

[Aals16] Aalst, van der, W. (2016). Process mining: data science in action. Heidelberg: Springer.

[Aals18] Aalst, van der, W., Bichler, M., & Heinzl, A. (2018). Robotic Process Automation. Bus Inf Syst Eng.

[Kirc17] Kirchmer, M. (2017). Robotic process automation – pragmatic solution or dangerous illusion? Retrieved from BPM-D: https://bpm-d.com/bpm-d-exhibiting-at-btoes-2/.

IoTT: Internet of Trusted Things?

The value of trust in data and information has increased with the adoption of new technologies such as the Internet of Things (IoT). In terms of control, experts often mention security measures of the devices, but forgo advising measures to control the data flowing between these devices. In this article we will highlight the importance of controlling data and give concrete examples along six dimensions of control on how to increase your trust in your IoT applications.

Introduction

Until recently, most big data initiatives focused on combining large internal and external datasets. For instance, an organization that sees a reduction in sales to customers under thirty, but have difficulty pin-pointing the reasons for this decline. Insights distilled from the combination of their internal customer data with external sentiment analysis based on social media then shows that this specific customer group has a strong preference for sustainability when purchasing products. The organization can respond to this insight by launching a new product or specific marketing campaign. Such initiatives are typically born as proof-of-concepts, but are gradually developing into more frequently used analytical insights. Some organizations are already moving towards transforming these (ad-hoc) insights into more business-as-usual reporting. The transformation from proof-of-concept to business-as-usual leads to the necessity of processing controls, consistent quality and a solid understanding of the content, its potential use and the definitions used in both systems as well as reports. This means that for the above-mentioned analytics on customer data and social media data, it is necessary to be certain that the data is correct. Data might need to be anonymized (for example for GDPR – data privacy requirements). It has to be validated that the data is not outdated. And the meaning of the data must be consistent between systems and analysis. The need for control, quality and consistency of data & analytics is growing, both from a user perspective, wanting to be certain about the value of your report, as well as from a regulatory perspective. So, it’s critical to demonstrate your data & analytics is in control, especially when the data is collected from and applied to highly scalable and automated systems, as is the case for the Internet of Things.

Awareness of the value of data in control

Whether it is a report owner, a user of Self-Service-BI, a data scientist or an external supervisory authority, all require insight into the trustworthiness of their data. As said, this process of bringing analytical efforts further under control is a recent development. Initially, organizations were more focused on the analytical part than on the controlling part. But more importantly, controlling data the entire journey from source to analysis is usually complex and requires a specific approach for acquiring, combining, processing and analyzing data. So, although companies are increasingly proven in control, this progress is typically rather slow. The primary reason is that obtaining this level of control is challenging due to the complexity of the system landscape, i.e. the amount of application systems, the built-in complexity in (legacy) systems and the extensive amount of non-documented interfaces between those systems. In most cases, the underlying data models as well as the ingestion (input) and exgestion (output) interfaces are not based on (international) standards. This makes data exchange and processing from source to report complex and increases the time it takes to achieve desired levels of control. Organizations are currently crawling towards these desired levels of control, although we expect this pace to pick up soon: all because of the Internet of Things.

Wikipedia [WIKI18] defines the Internet of Things (or IoT) as: “the network of devices, vehicles, and home appliances that contain electronics, software, actuators, and connectivity which allows these things to connect, interact and exchange data.” Or simply: IoT connects physical objects to the digital world.

IoT seems as much a buzzword as big data was a few years ago ([Corl15]). The amount of publications on the topic of IoT and IoT-related pilots and proof-of-concept projects is rapidly increasing. What is it about? An often-used example is the smart fridge, the physical fridge that places a replacement order via the internet at an online grocery store when the owner of the fridge takes out the last bottle of milk. While the example of the refrigerator is recognizable and (maybe) appealing, most of these sensors is far simpler and has much higher potential due to its scale for organizations than merely automating grocery shopping.

A practical IoT example of sensor data used in a very practical manner is developed in the agricultural sector. Dairy farmers have large herds that roam grasslands. Nowadays, cows in these herds are being fitted with sensors to track their movement patterns, temperature and other health-related indicators. These sensors enable the dairy farmers to pin-point cows in heat within the optimal 8-30-hour window, increasing the chance the cow will become pregnant and therefore optimize the milk production.

For organizations, IoT provides the opportunity to significantly increase operating efficiency and effectiveness. It can mitigate costs, for instance when used to enable preventive maintenance which reduces the downtime of machines – sometimes even by days. Sensor data can be derived from smart (electricity) meters and smart thermostats at your homes, the fitness tracker around your wrist. But similarly, also from the connected switches within railroads, smart grid power breakers or humidity sensors within large agricultural projects to fine-tune irrigation. All these devices and sensors collect and analyze data continuously to improve customer response, process efficiency and product quality.

Given this potential, it is expected that more and more companies are setting up initiatives to understand how IoT can benefit their business. We predict that the IoT will be commonplace within the next five years. The effect is that due to the number of sensors and continuous monitoring, the data volume will grow exponentially, much faster than the current growth rate. This means that the level of control, quality and consistency required will grow at least at the same rate. At the same time, IoT data requires more control than ‘traditional’ data. Why? IoT has its owns specifics, best illustrated by the two examples.

Example 1: smart home & fitness trackers

For both smart home devices and fitness trackers, it’s typically the case that if the data stays on the device, controlling the data is mostly limited to the coding of the device itself. If the device is connected to an internal corporate system, control measures such as understanding where the device is located (e.g. is the device in an office or in a laboratory) must be added. And once the data is then exchanged with external servers, additional technical controls need to be in place to receive and process the data. Examples include security controls such as regular security keys rotation, penetration testing and access management. Furthermore, when tracking information on consumers that either reside in a house or wear a fitness tracker, privacy regulation increases the level control required for using data from these devices. This requires additional anonymization measures for example.

Example 2: Industrial IoT (IIoT)

Although, consumers are gaining understanding of the value of their data and require organizations to take good care of it, the industrial application of IoT is also growing. Companies in the oil and gas, utilities and agricultural industries are applying IIoT in their operations;We do believe there is an important role for the industry (manufacturers, platform operators, trade associations, etc.) to ensure that their products and services offer security by design and would come ‘out of the box’ with security measures in terms of encryption, random passwords, etc. ([Luca16]).

For example, imagine a hacker targeting a switch on the point of failure in an attempt to derail a train.

Understanding where risks lie, how reliable insights are and what impact false negatives or false positives have is therefore essential to embedding IIoT in the organization in a sustainable manner.

The platform economy1

We see the sheer volume of IoT data, the fact that captured data needs to be processed (near) real-time and the amount of controls as the main drivers for the development and growth of so-called ‘IoT platforms’. An IoT platform is the combination of software and hardware that connects everything within an IoT ecosystem – such an ecosystem enables an entity (smartphone, tablet, etc.) that functions as a remote to send a command or request for information over the network to an IoT device. In this way, it provides an environment that connects all types of devices. It also can gather, process and store the device data. To be able to do that in a proven and controlled manner, the platform should contain the required controls. Examples include having an anonymization function, the ability to set up access controls and having data quality checks when data is captured by the platform. And lastly, the platform allows the data to be either used for analytical insights or transferred to another platform or server. In some cases, the data generates so much value by itself that it is not shared but sold ([Verh17]). The platform than act as a market space where data can be traded. This is called ‘data monetization’ and its growth mirrors the IoT platform growth.

Controlling your data – a continuous effort

Being in control of your data from source to analysis is not an easy effort. As mentioned, controlling data is complex due to differences within and between (IoT) devices or systems that capture data. The fact that data is exchanged within organizations, where there is a consistent use of data, is usually a challenge. But also, with external parties, which usually leads to even bigger differences between data, data quality and data definitions. Both internal and external data exchange therefore increase the need for e.g. data quality insights, data delivery agreements and SLAs). This is further increased by the growing regulatory requirement for data & analytics contributes. GDPR has been mentioned earlier in the article. Yet there are other less well-known regulations, such as specific financial regulations like Anacredit or PSD2. Yet, complex doesn’t automatically mean that it is impossible. The solution is having a standard set of controls in place. This set needs to be consistently used within and between systems – including the IoT platform. To illustrate: when the data enters the IoT platform, the data quality must be clear and verified, the owner of the data must be identified and the potential (restrictions for) usage of the data must be validated. The continuous monitoring of and adhering to these controls means that organizations are perfectly capable of being in control.

In short, controlling the data from the device to usage means that different measures need to be in place of the data flow. These measures are related to different data management topics,2 as visualized in Figure 1.

C-2018-4-Verhoeven-01-klein

Figure 1. The six dimensions considered of most influence to managing IoT data. [Click on the image for a larger image]

Ad 1

To ensure that changes to the infrastructure, requirements from sensors or processing and changes to the application of the data are adopted within the processing pipeline and throughout the organization, decent data governance measures should be in place. For instance, a data owner needs to be identified to ensure consistent data quality. This will facilitate reaching agreements and involve the people required to address changes in a structured manner.

Ad 2

The consistency of data is to be ensured by metadata: the information providing meaning or context to the data. Relevant metadata types such as data definitions, a consistent data model, consent to use the data as well as corresponding metadata management processes need to be in place. The need for robust and reliable metadata about IoT data in terms of defining its applicability in data analysis became painfully clear in a case we recently observed at an organization where data from multiple versions of an industrial appliance was blended without sufficiently understanding the difference between these versions. In this case, the manner of which an electricity metering value was stored in the previous version was with a 16-bit integer (a maximum value of 6553,5 kWh), while the metering value in the most recent version was stored with a 32-bit integer (a maximum value of 429.496.729,5 kWh). Since the values observed easily exceed 6553,5 kWh, the organization had implemented a solution to count the number of times the meter had hit 6553,5 and returned to 0 kWh. Their solution was simple: a mere addition of 6553,5 kWh to a separately tracked total for each of their devices. This however, had caused spikes in the results that seemed unexplainable to business users and caused confusion with their end customers.

Ad 3

Data security measures should be in place such as access and authentication management, documented consent of the data owner to let the data be used for a specific purpose, regular penetration testing and a complete audit-trail for traceability of the data ([Luca16], [Verh18]). Awareness of this topic is growing due to a stream of recent examples of breached security through IoT devices, such as the hacking of an SUV and a casino’s aquarium ([Will18]).

We do believe there is an important role for the industry (manufacturers, platform operators, trade associations, etc.) to ensure that their products and services offer security by design and would come ‘out of the box’ with security measures in terms of encryption, random passwords, etc. ([Luca16]).

Ad 4

For decent interoperability of data between sensor, processing nodes and the end user, exchange protocols to move the data need to be specified and documented, preferably based on international standards when available, such as ISO 20022 (standard for exchanging financial information between financial institutions, such as payment and settlement transactions). Important to consider are the physical constraints that traditional data processing don’t often pose. In the case of the dairy farm, the farmer places a limited number of communication nodes on his fields. This means that the cows won’t be in range of these nodes continuously. Furthermore, these field nodes are connected wirelessly to a processing node on the farm, which, in turn, is connected to the cloud infrastructure in which information of all cows worldwide is processed.

Ad 5

Even if the sensors, processing nodes and infrastructure are reliable, a good deal of attention should be paid to identifying to which data quality criteria these components should be measured against. In the case of IoT, the question is very much focused on what is important for a specific use case. For cases in which the information of interest is dependent on averages, such as body temperature or dimensions, such as distance travelled, missing out on 5 to 10% of potential measurements doesn’t pose an enormous risk. On the other hand, in a scenario in which anomalies are to be detected obtaining complete data is essential. Examples include response times of train switches and security sensors. In other cases, the currency (or: timeliness) of the measurements is much more important when immediate action is required, such as in the case of dairy cows showing signs of heat stress. Determining which quality dimensions should be monitored and prioritized must be decided on a use case by use case basis.

Ad 6

Examples of data operations include storage replication, purging redundant, obsolete and trivial data, enforcing data retention policy requirements, archiving data, etc. Like data quality, organizations should start by identifying which specific data operations aspects should be considered. The best method to address this is through use cases, as these aspects are important for use cases that, for example, rely on time series analysis, (historic) pattern detection or other retrospective analyses.

Conclusion

Increasing control of Internet of Things applications is necessary to apply trusted insights in (automated) decision-making. In practice, trusted insights derived by Internet of Things applications data often turns out to be a challenge. This challenge is best faced by not only focusing this control from a system or application point of view. Controlling secure access and usage, or the application of the insights from a privacy point of view is a good start for trusted IoT insights. But it also requires a fundamental reliance on the insights received, quality of data and the applicability of data per defined use case. This means that the total set of required measures and controls is extensive. When you increase the controls and measures, the trustworthiness of IoT insights increases. But it also important not to drown in unnecessary measures and controls. Better safe than sorry is never the best idea due to its complexity and volume. By using a sufficient framework, such as the KPMG Advanced Data Management framework, organizations know the total amount of required measures and controls – which mitigates the impulse to be over complete. And at the same time by having a complete framework, an implementation timeline for controls and measures can be derived based on a risk-based approach.

Notes

  1. For the sake of this article, we limit our consideration of the IoT platforms to their data management functionalities.
  2. The topics mentioned are part of the KPMG Advanced Data Management framework that embodies key data management dimensions that are important for an organization. For the sake of this article, we have limited the scope of our considerations to the topics most applicable for practically managing IoT data. A comprehensive overview of data management topics can be found here: https://home.kpmg.com/nl/nl/home/services/advisory/technology/data-and-analytics/enterprise-data-management.html

References

[Corl15] G. Corlis and V. Duvvuri, Unleasing the internet of everything, Compact 15/2, https://www.compact.nl/en/articles/unleashing-the-internet-of-everything/, 2015.

[Luca16] O. Lucas, What are you doing to keep my data safe?, Compact 16/3, https://www.compact.nl/en/articles/what-are-you-doing-to-keep-my-data-safe/, 2016.

[Verh17] R. Verhoeven, Capitalizing on external data is not only an outside in concept, Compact 17/1, https://www.compact.nl/articles/capitalizing-on-external-data-is-not-only-an-outside-in-concept/, 2017.

[Verh18] R. Verhoeven, M. Voorhout and R. van der Ham, Trusted analytics is more than trust in algorithms and data quality, Compact 18/3, http://www.compact.nl/articles/trusted-analytics-is-more-than-trust-in-algorithms-and-data-quality/, 2018.

[WIKI18] Wikipedia, Internet of things, Wikipedia.org, https://en.wikipedia.org/wiki/Internet_of_things, accessed on 01-12-2018.

[Will18] O. Williams-Grut, Hackers once stole a casino’s high-roller database through a thermometer in the lobby fish tank, Business Insider, https://www.businessinsider.com/hackers-stole-a-casinos-database-through-a-thermometer-in-the-lobby-fish-tank-2018-4?international=true&r=US&IR=T, April 15, 2018.

Data-driven pricing

The market competition in the field of Dutch non-life insurance is fierce. The ability to compare insurance policies online enables consumers to find the lowest prices for the products they need. This compels insurance companies to quote increasingly competitive premiums, whilst claims and operating costs show an increasing trend, resulting in decreasing profit margins. Therefore, now is the time for non-life insurers to reform their pricing strategies. We strongly believe a data-driven pricing strategy will become the new market standard, and have developed an open source-pricing platform to assist insurers in the transition.

Introduction

The Dutch non-life insurance market is under pressure, and has been for a while. High combined ratios are common for several insurance products and a few big players dominate the market. However, market competition is fierce. The ‘old way’ of buying all your policies at the local insurance office has disappeared. Consumers are now more than ever able to compare insurance policies that cater to their needs, often causing them to search for the lowest available prices. This forces insurers to set competitive premiums, whilst managing claims and operational costs. These competitive premiums, combined with the trend of increasing claim levels and operational costs, result in decreasing margins with an even higher pressure to maintain a stable portfolio with profitable clients.

However, not only consumers have more possibilities to benefit from the increasing availability of information, also the insurance companies can profit from these. For example, insurance companies have more detailed insight in their consumer’s behavior, and the underlying risks, and are therefore able to transfer from traditional pricing strategies to more modern ones.

Traditional pricing strategies originate from insurers knowing their clients personally, and as such the characteristics of their claims. Current strategies mostly rely on established (but old-fashioned) statistical techniques that set the premium on a group level, based on data provided by the policyholders, and are often not regularly recalibrated. Therefore, premiums are not optimized.

The more insight you have in the characteristics of your policyholders, the better you can estimate the corresponding individual risks, and tailor the premium accordingly. The increasing availability of data facilitates this. We consider the following criteria to be fundamental to fully utilize the advantages:

  • a scalable IT infrastructure;
  • internal data of high quality;
  • the possibility to combine internal data with external datasets (open and commercial);
  • updating pricing strategies with modern analysis and modeling techniques, like machine learning.

These points open the door to set a competitive premium on a more individual basis, and updating it directly when new claim data is obtained, or when changes occur in an individual profile. We call this approach a data-driven pricing approach, and strongly believe that this approach will quickly render traditional approaches obsolete. In order to facilitate the change, KPMG has developed an open source analysis platform that meets the criteria set out above, which can be used by insurers to clean, combine and analyze their data. We have described this pricing analysis platform in the box about ‘KPMG open source analysis platform’.

Pricing strategies

Traditional strategies

Traditionally, insurance companies used to have unique portfolios, for example due to their strong regional presence in the market. People bought insurance from insurance companies present in their area, resulting in portfolios with unique characteristics for the region. Insurance companies used to know the people they insured personally, and could set adequate premiums based on this. With the introduction of buying and comparing insurance policies on the internet, these geographic dependencies started to dissipate, and competition between insurance companies increased. Nowadays it is easy to find ‘the best deal’ for one’s specific insurance needs and buy a policy in a matter of seconds, without any human interaction. For the insurers this results in more geographically dispersed portfolios, with indifferent characteristics. Therefore, these traditional strategies evolved to forms that are supported with data provided by the policyholders and established statistical methods using this data: generalized linear models (GLMs), which were introduced in 1972.

While the market is changing, many insurance companies still apply traditional or old-fashioned GLM-based methodologies to derive their premiums. So how can an insurer set a competitive premium nowadays? For this, we distinguish between cost-based pricing approaches and value-based pricing approaches, which are set out in Figure 1.

C-2018-4-Valkenburg-01-klein

Figure 1. Non-life insurance pricing strategies. [Click on the image for a larger image]

Cost-based data-driven pricing strategies

A cost-based pricing strategy involves investigating the risk of a policy, and finding a premium that will cover this risk. This can be done from pooling risk without diversification (pay-as-you-go), to trying to find unique characteristics that forecast the underlying risk of the policy (risk premium augmented data). The latter requires reliable data as input for statistical models. The more unique characteristics can be used, the more individual the risks can be estimated, and therefore the more individual the premium can be set to better cover the risks.

Insurance companies already possess a large amount of data on their policyholders. The digitalization of insurance even enables them to collect more than before, and store the data in a more structured and centralized way. In addition, the availability of open and commercial datasets is ever increasing. For example, the Netherlands Vehicle Authority (RDW) publishes an open dataset with a substantial amount of vehicle information, and the Dutch central agency for statistics publishes regional and demographic information. Using such additional datasets can enhance the insurers’ data, by missing data imputations or replacing low quality data in its own set, and enriching it by adding new variables to the set. This provides the insurer extended insights into characteristics of its policyholders and insured objects. However, in our experience insurance companies often face technical difficulties with combining datasets due to different data formats, legacy systems, and an absence of a uniform data analysis platform. If this problem can be overcome and additional data can be used in the pricing procedure, even old-fashioned statistical techniques (like GLM) can be used to set a more precise premium than premiums solely based on internal data. By still finding unique characteristics in the insured portfolio, it is possible to outperform the market with a traditional cost-based pricing approach.

Access to substantial amounts of relevant data also opens the possibility to utilize modern analysis and modeling techniques, like machine learning and deep learning. With these techniques an insurer can extract extensive intelligence from its data in an almost fully automated matter, if desired. Where human interpretation of statistics and modeling choices based thereon are key in traditional methods, these modern techniques automatically find less obvious, but significant causal relationships in the data, which are easily overlooked in a manual assessment. This ultimately results in even more precise and individual premiums. One should remain wary of undesired effects when applying a fully automated approach, like indirect discrimination. For example, regulation prohibits the usage of gender as a pricing variable for motor insurance policies, but very granular car type and color variables might (partially) act up as a proxy for gender effects.

Value-based data-driven pricing strategies

The methods discussed so far derive the premium with a cost-based approach. They all aim to predict future claims of a policyholder based on certain characteristics, so that an accurate premium to cover these expected claims can be quoted. Another data-driven pricing approach is the concept of value-based pricing. This approach derives the optimal premium based on a customer’s willingness to pay for the product. The willingness to pay can roughly be divided in product benefits, service benefits, and brand benefits. Outperforming the competition on these elements can attract new clients, even if the price is higher. Awareness of what the target audience is willing to pay per element is key in optimizing profits. Also, for the value-based pricing approach, the availability of data and modern analysis and modeling techniques are of utmost importance.

KPMG open source analysis platform

We consider a data-driven pricing strategy with both the cost-based approach and the value-based approach as the new market standard for pricing non-life insurance policies. Viable premiums arise from combining:

  1. high quality data from internal and external sources;
  2. modern day analysis and modeling techniques;
  3. management information.

To support insurance companies in the transition to a data-driven pricing strategy, KPMG has developed an open source-pricing platform: the platform does not, and will not, bear any licensing fees. On this platform modern day data handling and visualization capabilities are combined with up to date modeling techniques to derive an optimal premium. It features a functionality to:

  • combine datasets;
  • analyze and clean the datasets (data quality checks, pre-production);
  • derive premiums with traditional GLM techniques to gain insight on a cost-based approach;
  • analyze correlation structure of all variables to enrich the GLMs with cross variables and higher order terms;
  • optimize premiums in a value-based approach, e.g. by means of pricing elasticities or competitor information;
  • derive premiums for a cost-based and value-based approach with modern machine learning and deep learning techniques;
  • visualize portfolio statistics (claims, risk profiles, etc.);
  • visualize pricing performance (old/new premiums versus claims).

The platform can easily be deployed by the insurance companies own data scientist, and can be tailored to the organization. The premium can then be optimized following the approach in Figure 2.

  • In the preparation phase initial data quality checks are performed and datasets are combined for analysis.
  • During the data exploration phase the combined data is analyzed to find well-suited input parameters for the modeling phase.
  • Both traditional and modern models are applied to the combined dataset in the modeling phase.
  • In the optimization phase parameters are adjusted to find the statistical optimal premium.
  • The results are visualized in the dashboard and adjustment phase.
  • Based on the statistical and visual interpretation of results and management information, the models can be fine-tuned iteratively.
  • New data can be added on a real-time basis, can be used to update the pricing models frequently, and provides direct insight in portfolio developments.

C-2018-4-Valkenburg-02-klein

Figure 2. Data-driven pricing approach. [Click on the image for a larger image]

KPMG has experience and credentials in assisting non-life insurers in every step of the way in implementing the approach above, leading to optimized premiums and portfolios. In this matter KPMG offers support from multidisciplinary teams with expertise from both a data and analytics perspective, as well as an actuarial perspective.

Conclusion

The pressure and tight margins in the Dutch non-life insurance market forces the market to move to a new pricing approach. Many insurance companies still apply traditional methodologies to derive their premiums. Implementing a data-driven pricing strategy can outperform traditional strategies, and can either be achieved by optimizing the cost-based pricing approach by means of using modern analysis and modeling techniques, but also by further development of the value-based pricing approach.

Process mining in de assurance-praktijk

PGGM verstrekt Assurance Standard 3402- en Assurance Standard 3000-rapportages die specifiek zijn per klant. Process mining is binnen PGGM gebruikt om aan te tonen dat een aantal processen ook multi-client getest kan worden, omdat deze processen generiek zijn voor meerdere pensioenfondsen. In dit artikel wordt uitgelegd wat process mining is. Daarnaast zijn de ervaringen van PGGM met betrekking tot process mining beschreven en wordt er een praktijkvoorbeeld uitgewerkt. Daarna wordt de impact op de werkzaamheden van de auditor van het Standaard 3402- en Standaard 3000-rapport en de randvoorwaarden beschreven. Ook wordt geschetst hoe process mining mogelijk in de toekomst ingezet kan worden om de uitvoering van de controle efficiënter en met een hogere kwaliteit uit te voeren.

Inleiding

PGGM is een van de grootste pensioenuitvoeringsorganisaties van Nederland. Zij is verantwoordelijk voor het beheer van de pensioenadministratie voor meerdere pensioenfondsen, waaronder het Pensioenfonds Zorg en Welzijn (PFZW). Om richting haar klanten aan te tonen dat processen op een juiste wijze worden beheerst, verstrekt PGGM Service Organisatie Control (SOC)-rapportages volgens de Assurance Standard en Assurance Standard 3000. Deze Standaard 3402 en Standaard 3000-rapporten worden specifiek per pensioenfonds verstrekt.

PGGM en de auditor hebben besproken welke mogelijkheden er zijn om het proces van het testen van interne beheersingsmaatregelen ten behoeve van de SOC-rapportages op een efficiëntere manier vorm te kunnen geven. De wens van PGGM is om de Standaard 3402- en Standaard 3000-rapporten specifiek te houden per pensioenfonds. In het geval dat een aantal processen multi-client getest zal worden, is het van belang dat kan worden aangetoond dat deze processen en bijbehorende beheersingsmaatregelen daadwerkelijk op een generieke manier plaatsvinden voor alle pensioenfondsen. De techniek van process mining is hierbij van belang, om aan te kunnen tonen dat bepaalde processen inderdaad op een generieke manier worden uitgevoerd voor meerdere pensioenfondsen. Daarom is PGGM een experiment gestart met process mining, met als doel meer efficiëntie en een hogere kwaliteit.

In dit artikel zal in de volgende paragrafen worden beschreven wat process mining is, wat de ervaringen zijn van PGGM en de auditor, en hoe process mining in de toekomst verder toegepast kan worden.

Wat is process mining?

Process mining is een techniek die nieuwe inzichten mogelijk maakt in processen op basis van ‘event data’. Het meest gebruikelijke voorbeeld van event data, zoals deze gebruikt wordt binnen process mining, is de logging data uit workflow-systemen, bijvoorbeeld de stappen ‘goedkeuren lening’, ‘autoriseren betaling’ of ‘aanmaken order’. Deze workflow-stappen in de logging kunnen zowel worden geïnitieerd door een persoon als door voorgeprogrammeerde software binnen het workflow-systeem. De process mining-tooling plaatst vervolgens de geüploade events in een chronologische volgorde, op basis van de tijdsaanduiding die aan de logging is toegevoegd op het moment dat de workflow-stap wordt uitgevoerd. Door het gebruik van de logging data op deze manier achter elkaar te zetten, biedt process mining inzicht in hoe transacties daadwerkelijk in een proces plaatsvinden. Daardoor kunnen afwijkingen, bottlenecks of stappen die wellicht niet nodig zijn binnen het proces onderkend worden. Process mining kan gebruikt worden binnen een grote verscheidenheid aan processen, zoals Purchase-to-Pay, IT-management of de uitvoering van de pensioenadministratie.

Zoals [Rama16] al schrijft, zijn er vier categorieën binnen process mining te onderkennen, zijnde process discovery, conformance checking, enhancement en process analytics:

  1. Binnen process discovery wordt de data uit de log gebruikt om een weergave van het proces op te stellen, zonder gebruik te maken van informatie over het proces. Op deze wijze wordt een model weergegeven dat niet gebruikt wordt om te sturen of controleren, maar alleen om de realiteit te ontdekken.
  2. Bij conformance checking wordt een model van het proces (bijvoorbeeld het model uit process discovery) gebruikt om afwijkingen of alternatieve wegen in het proces te onderkennen.
  3. Process enhancement omvat het uitbreiden of verbeteren van procesmodellen op basis van data over het daadwerkelijke verloop van een proces. Hier worden bijvoorbeeld bottlenecks aangepakt of alternatieve paden onmogelijk gemaakt.
  4. In process analytics worden verdere analyses gemaakt op basis van de eventdata en de procesmodellen, bijvoorbeeld om toevoegingen beter te begrijpen, toekomstige stappen te voorspellen of opvolgingsacties te definiëren.

Binnen de controlepraktijk kan process mining gedurende meerdere fases in het controleproces worden ingezet:

  1. Tijdens walkthroughs. Hierbij wordt process mining ingezet om de walkthrough te visualiseren op basis van de eventdata. Het voordeel hiervan is dat niet alleen de happy flow in kaart wordt gebracht, maar alle mogelijke paden binnen een proces.
  2. Als basis om steekproeven of deelwaarnemingen op te baseren. Hierbij kunnen bijvoorbeeld alleen items met een hoger risico worden gecontroleerd, omdat deze niet via de happy flow, maar via een alternatief pad lopen.
  3. Voor compliance checking. Hierbij kunnen bijvoorbeeld beheersingsmaatregelen als een vier-ogenprincipe in een proces voor de volledige populatie getest worden.

In deze casus is process mining ingezet om initieel een lijncontrole uit te voeren van de processen bij ieder van de vier klanten van PGGM. Vervolgens zijn deze vier process flows met compliance checking naast elkaar gezet om zo ook aan te tonen dat ieder van de vier pensioenfondsen precies dezelfde stappen volgt binnen de processen, zoals die in deze casus benoemd worden.

Toepassing van process mining

Ervaringen met process mining bij PGGM

Voor het toepassen van process mining is bij PGGM een multidisciplinair projectteam samengesteld met kennis over de uitvoering van pensioenenprocessen, procesanalyse en data-analyse.

De eerste fase van het experiment was gericht op het ontdekken van de mogelijkheden van process mining en de tooling. De toegevoegde waarde van process mining werd snel zichtbaar, door het geven van inzicht in de werkelijke uitvoering van de processen, inclusief knelpunten. Zo werd duidelijk dat er sprake was van het onnodig en veelvuldig doorsturen van activiteiten, en dat de wachttijden hoog waren bij de overdracht van werkzaamheden tussen afdelingen. PGGM heeft deze knelpunten kunnen oplossen door een herinrichting van de processtroom. Andere voorbeelden van geïnitieerde procesverbeteringen zijn:

  • verkorten van de doorlooptijd en het creëren van klantwaarde door het elimineren van activiteiten die niet van toegevoegde waarde zijn voor het proces;
  • realiseren van een betere procesbeheersing door inzicht in ‘first time right’;
  • ontwerpen van een multi-client procesuitvoering in plaats van een fonds-specifieke uitvoering;
  • toepassen van Robotic Process Automation op processen. Hierbij worden repeterende menselijke handelingen in administratieve processen uitgevoerd door softwarematige robots.

De volgende stap was onderzoeken hoe process mining in te zetten is voor het verkrijgen van inzicht in de beheersing van de processen. Daarbij zijn de uitgangspunten gehanteerd dat process mining leidt tot:

  1. efficiëntere uitvoering van de controls;
  2. tijdsbesparing van de controlewerkzaamheden voor de tweede en derde lijn;
  3. op termijn mogelijk meer zekerheid, doordat volledige populaties worden betrokken in plaats van deelwaarnemingen.

Process mining kan aanvullende zekerheid bieden, omdat het uitgaat van een integrale analyse van de volledige populatie. Het selecteren van deelwaarnemingen, vaak de huidige methodiek, is hierdoor overbodig. De techniek laat namelijk alle handelingen en onderliggende relaties voor de volledige populatie zien. Voorbeelden van toepassingen van process mining op een volledige populatie is het vaststellen of alle aan de deelnemers verstuurde brieven zijn gecontroleerd door een medewerker, of dat voor iedere mutatie een controle-technische functiescheiding is uitgevoerd.

Beperkende factoren van process mining zijn vaak (en dit heeft PGGM ook ervaren) dat de data-architectuur niet is ingericht op een eenvoudig gebruik van process mining. Datapreparatie kost veel tijd, omdat de benodigde informatie uit verschillende systemen komt. Daarnaast worden niet alle handmatige activiteiten binnen het workflow-systeem gelogd, met als risico dat niet alle processen door de data kunnen worden gedekt. Een goed ingerichte data-architectuur is essentieel om optimaal gebruik te kunnen maken van de tooling.

Uitwerking van de PGGM-casus

Ter verduidelijking wordt op basis van een praktijkvoorbeeld het toepassen van process mining bij PGGM nader toegelicht. Als voorbeeld is het proces ‘Excasso’ uitgewerkt.

Het startpunt voor de process mining-analyse was een overleg met alle betrokkenen van het excasso-proces binnen PGGM. Het doel van dit overleg was om de haalbaarheid van het multi-client uitvoeren van de testwerkzaamheden te bepalen. Naar aanleiding van het overleg is geconcludeerd dat het proces Excasso in aanmerking zou komen om multi-client uitgevoerd te kunnen worden. De daadwerkelijke haalbaarheid zou onder meer door process mining moeten worden aangetoond.

In het excasso-proces worden de pensioenrechten en -toekenningen van deelnemers omgezet naar een daadwerkelijke uitbetaling. Een belangrijk onderdeel hierin is de omrekening van het bruto toekenningsbedrag naar de netto uitbetalingsrechten: de bruto/netto-berekening. Verder zitten er in het proces diverse controles en fiattering, die vanwege het karakter van het proces zeer evident zijn. Het excasso-proces omvat drie hoofdactiviteiten, zie Figuur 1.

C-2018-4-Stoof-01-klein

Figuur 1. Excasso-proces. [Klik op de afbeelding voor een grotere afbeelding]

De eerste stap in de analyse was het creëren van een eventlog. Als databron is het betaal- en fiscale systeem gebruikt. De data zijn vervolgens ingeladen in de process mining-tool.

De eerste resultaten op basis van de eventlog waren nog niet toereikend, waarop de eventlog is verrijkt met data uit andere bronnen, waarbij de auditor de trail van de data kan volgen. De definitief gecreëerde eventlog heeft uiteindelijk geleid tot het overzicht zoals weergegeven in Figuur 2.

C-2018-4-Stoof-02-klein

Figuur 2. Uitkomst process mining. [Klik op de afbeelding voor een grotere afbeelding]

De uitkomst van de analyse in Figuur 2 laat zien dat de processtromen voor de vier pensioenfondsen op eenzelfde wijze verlopen. Allereerst wordt er een brutobestand gegenereerd in het systeem, waar de pensioenrechten worden geadministreerd (processtap: ‘Brutobestand’). In het brutobestand zijn de bruto pensioenrechten opgenomen. In de volgende stap vindt de omzetting plaats van de bruto pensioenrechten naar de netto uitbetalingsrechten. Dit wordt uitgevoerd door een externe partij (processtap: ‘Bruto/netto-berekening’). Vervolgens wordt het netto uitbetalingsbestand retour ontvangen (processtap: ‘Nettobestand’). Hierna vinden er controles plaats of de bruto/netto-berekening correct is verlopen, waarna de fiattering en goedkeuring van het netto uitbetalingsbestand plaatsvindt (processtap: ‘Fiattering’). Ten slotte wordt dit uitbetalingsbestand verstrekt aan de uitbetalingsafdeling, die de uitbetaling verricht bij de bank (processtap: ‘Uitbetaling’).

Een andere benadering die kan worden gehanteerd is dat process mining de volledige processtroom laat zien. De cases die in de ‘happy flow’ zitten, worden aangemerkt als ‘in control’. Interessant zijn de excepties die zichtbaar worden; die moeten worden geanalyseerd en verklaard. Deze stromen zijn in het kader van procesbeheersing immers niet wenselijk. Zoals te zien is in Figuur 2 waren er in dit proces geen excepties.

Door middel van de analyse en uitkomst, zoals weergegeven in Figuur 2, wordt aangetoond dat de processen voor meerdere pensioenfondsen identiek worden uitgevoerd. Door middel van process mining is zichtbaar gemaakt dat alle activiteiten in het proces, ongeacht welk pensioenfonds, dezelfde processtroom volgen. Voor de vastlegging van deze conclusie is een beschrijving van de log en de wijze van extractie naar de workflow-tool opgenomen. Ook is beschreven welke filters zijn gehanteerd in de tool, en zijn de controls geplot op de procesplaat. Naast de inzet van process mining is de analyse verder onderbouwd door interviews met materiedeskundigen, een walkthrough en een inspectie op onder meer werkinstructies, beleid en handleidingen.

Op basis van de ervaringen van PGGM zijn de volgende ‘lessons learned’ opgesteld:

  • Zorg voor een adequate inrichting van de data-architectuur;
  • Maak gebruik van de aanwezige kennis in de organisatie en schakel deze in. Denk aan data-analisten, SQL-specialisten, procesanalisten en auditors;
  • Focus niet alleen op process mining, maar maak gebruik van een combinatie van data-analysetechnieken.
  • Experimenteer en sta open voor nieuwe inzichten en technieken.

Impact op de auditwerkzaamheden van de auditor en randvoorwaarden

In het voortraject is er tussen PGGM en de auditor veel gesproken over de randvoorwaarden en mogelijkheden om process mining toe te passen in het kader van de Standaard 3402/3000-audit, om aan te tonen dat bepaalde processen voor meerdere pensioenfondsen op een generieke manier worden toegepast.

Uitgangspunt van PGGM is om de Standaard 3402/3000-rapporten specifiek te houden per pensioenfonds. In het geval dat een aantal processen multi-client getest zal worden, is het van belang dat kan worden aangetoond dat deze processen en bijbehorende beheersingsmaatregelen daadwerkelijk op een generieke manier plaatsvinden voor alle pensioenfondsen.

Hierbij is vanuit de auditor een aantal zaken van belang, dat hieronder verder wordt uitgewerkt:

  • Scoping. Van tevoren dient nagedacht te worden over de scoping, waaronder welke pensioenfondsen, processen, processtappen, et cetera tot het auditobject behoren;
  • Het kunnen aantonen van de betrouwbaarheid van de gebruikte data is van belang. Zo is het nog niet voor alle systemen mogelijk om de data te ontsluiten die gebruikt kan worden voor process mining;
  • Andere procedures dan process mining leveren aanvullend controlebewijs op om vast te stellen of het proces en de beheersingsmaatregelen generiek zijn, waaronder het doornemen van procesbeschrijvingen;
  • Toelichting over deze aanpak in het Standaard 3402/3000-rapport.

Omdat er bij PGGM gebruik wordt gemaakt van twee verschillende applicaties waarin de pensioenadministraties worden geadministreerd, is de beslissing genomen dat daarom niet voor alle pensioenfondsen een generieke methodiek kan worden gevolgd. Voor vier pensioenfondsen waarvan de pensioenadministratie in één applicatie wordt uitgevoerd, is gekozen om dit verder te onderzoeken.

Door middel van process mining kan worden aangetoond dat processen dezelfde flow volgen voor alle pensioenfondsen. Dit geeft inzicht in het feit dat de processen en bijbehorende beheersingsmaatregelen in de applicatie op een generieke manier worden behandeld. Voor de auditor was het van belang dat door PGGM duidelijk is vastgelegd hoe men tot deze conclusie is gekomen. Dit houdt onder meer in dat PGGM voor de auditor inzichtelijk heeft moeten maken hoe zij de analyse door middel van process mining heeft uitgevoerd, en wat daarbij de conclusies waren. Ook de analyse en toelichting van de uitzonderingen is door de auditor ge-reperformed. Ook was van belang dat de betrouwbaarheid van het gehanteerde databestand, met daarin de populatie waarop de process mining heeft plaatsgevonden, kon worden vastgesteld. Dit houdt in dat herleidbaar moet zijn hoe de data (zogenaamde ‘information produced by the entity’) zijn verkregen vanuit het systeem, en dat deze juist en volledig zijn. Hierbij is onder meer van belang dat vastgesteld moet kunnen worden dat er na het downloaden van gegevens uit de pensioenadministratie geen handmatige aanpassingen meer hebben plaatsgevonden.

Voor de auditor is het daarbij ook van belang om vast te stellen dat de processen die als multi-client behandeld zullen worden door één team worden uitgevoerd, in plaats van door specifieke klantteams, waardoor het risico kan bestaan dat bepaalde controls toch op een andere manier worden uitgevoerd. We hebben aan de hand van procesbeschrijvingen vastgesteld dat er sprake was van één Shared Service Center, dat de betreffende processen generiek uitvoert voor alle pensioenfondsen.

Ook is het vanuit het oogpunt van de auditor van belang dat in het Standaard 3402/3000-rapport duidelijk wordt toegelicht aan de gebruikers dat niet alle processen separaat zijn getest voor die specifieke gebruiker, maar dat voor een aantal processen dit op basis van een multi-client-aanpak is uitgevoerd. Zowel PGGM als de auditor lichten dit duidelijk toe in het rapport. Process mining kan daarmee een toegevoegde waarde leveren voor de gebruiker van het Standaard 3402/3000-rapport. Naast een schriftelijke toelichting is het aan te raden om de pensioenfondsen hier tijdens periodieke besprekingen tijdig en mondeling over te informeren.

Toekomst

Op dit moment wordt ook gekeken naar de toekomst, waarbij onder meer wordt onderzocht wat de mogelijkheden zijn om process mining te integreren in de beheersingsmaatregelen. Een voorbeeld hiervan is dat een medewerker voor de pensioenadministratie aan de hand van process mining voor een volledige populatie over een bepaalde periode vaststelt of er geen excepties zijn geweest ten opzichte van het standaardproces, en als dit wel het geval is, deze excepties analyseert. Een voordeel van deze methodiek is dat de volledige populatie wordt meegenomen in de uitvoering van de beheersingsmaatregel, en de auditor zich ook meer op volledige populaties baseert, in plaats van een aantal deelwaarnemingen te selecteren en op basis daarvan een conclusie te trekken.

Op deze manier kan op een efficiënte manier assurance worden verstrekt over de volledige populatie, wat ook een toegevoegde waarde kan zijn voor de gebruiker van het Standaard 3402/3000-rapport. Daarnaast zou process mining ook ingezet kunnen worden als continuous monitoring-tool, waarbij de data wellicht continu zou kunnen worden ingeladen om afwijkingen binnen het proces direct te detecteren.

Conclusie

Tijdens de controle van de Standaard 3402-rapporten door PGGM heeft deze in samenspraak met KPMG process mining ingezet. Hiermee is aangetoond dat vier van de pensioenfondsen hetzelfde proces volgen, en hierin ook gebruikmaken van dezelfde controls binnen het proces. Process mining biedt inzicht in de gehele populatie, terwijl de auditor normaal gesproken gebruikmaakt van deelwaarnemingen. De volgende stappen in het gebruik van process mining bij PGGM liggen zowel in de combinatie met andere processen, als het invoeren van process mining als control binnen de Standaard 3402/3000-rapportage. Door process mining in te zetten als control komt continuous monitoring een stap dichterbij.

Referentie

[Rama16] E. Ramezani Taghiabadi PhD, drs P.N.M. Kromhout Msc RE CISA and ir. M Nagelkerke RE, Process mining: Let data describe your process, Compact 2016/4, https://www.compact.nl/articles/process-mining/, 2016.

Is data the new oil for insurers like VIVAT?

It has often been stated: data is the new oil ([ECON17]). In one perspective, this may be true: the potential may be compared to the era where oil started to transform society in many ways. However, this mantra is also a bit misleading, as it suggests this potential should be easy to harvest. As easy as drilling for oil in an oil field.

The reality about data strategies in many organizations is that ideation about the benefits is the easy part; the hard work is a makeover of the organization, its systems and processes. There is no doubt that data is an important fuel for a company in the digital world. In order to really reap the benefits of data, organizations must transform into data-driven enterprises where everyone realizes how data contributes to the strategic success.

This article elaborates on the best approach to do so. It also shows the lines along which Dutch insurance company VIVAT is evolving into a data-driven organization, and the obstacles it has encountered in this journey.

How VIVAT explores data opportunities

The mission of VIVAT [VIVA18] – mother company of insurance brands Zwitserleven, Route Mobiel, Reaal and nowGo, and asset manager ACTIAM – states that: “VIVAT delivers advanced and smart solutions to our customers in a customized and simple way. VIVAT leverages state of the art technologies and excels in efficient business processes. VIVAT fosters an agile culture where our customer service improves continuously, and employees grow.” VIVAT generated € 2.9 billion in gross written premiums (GWP) in 2017, which makes VIVAT one of the top five insurance companies in the Netherlands. VIVAT has € 56,7 billion of total assets, more than 2,5 million customers and 2.500 employees. VIVAT’s strategy is built around understanding and responding to customer needs, making VIVAT future proof, and a smart application of innovation.

Data is one of the four strategic pillars of VIVAT (Customer Centricity, Digitalization, Innovation and Data), similar to many insurance companies nowadays. Data is in most cases an essential ‘raw material’ for the other strategic pillars. VIVAT fully realizes that this implies fostering data as the most important fuel of this strategy. The promise is apparent in three domains: better service to clients, improving operational excellence and a more effective and efficient way to deal with risk and compliance processes.

The board of VIVAT started the process of becoming a data-driven organization when Ron van Oijen joined VIVAT as a new CEO. He is innovation and data-minded, and sees the opportunities to strengthen VIVAT with the use of data, and started cooperating with universities and educating VIVAT people as data scientists. Charlene Xiao Wei Wu, the Chief Transformation Officer of VIVAT, brought in the knowledge from China: using data for cross-selling and the development of new propositions.

How to get started?

Next to innovation, customer focus and digitization, regulations were a strong force in the transformation towards a data-driven organization as well, such as the Solvency II regulation. VIVAT took the following route in their journey of becoming a data-driven company:

  1. board and management commitment to data;
  2. Data and Analytics maturity assessment;
  3. evangelize data within the organization;
  4. building the data organization foundation;
  5. define an enterprise-wide data strategy and action plan.

Before entering this journey, a few basics needed improvement. The first action was to get the basics right, in order to comply with Solvency II, and later with other regulations. The prerequisites of data and analytics were completed by setting up a logical data warehouse and implementing ready-to-use tools. Furthermore, VIVAT started initiatives in which value is created with data and analytics, to be used as compelling use cases in the organization.

C-2018-4-Sloots-01-klein

Figure 1. High-level strategy data plan. [Click on the image for a larger image]

Next to these focus areas, long-term actions were defined for improving data maturity. The long-term actions will be described next.  

Accelerating the data organization

After the basics in the organization were established by executing the actions as mentioned in Figure 1, VIVAT started the strategic conversations in their business units (products lines). In this acceleration phase, VIVAT recognized the following five aspects were very important.

1. Board and management commitment to data

Leadership is important to make impact in the area of data and analytics, as this involves change in many respects. It is not just a matter of hiring a bunch of data-savvy professionals. In fact, their efforts do not make any sense when other departments don’t grasp the importance of the effort of these professionals in executing the strategy. For example: customer service professionals should realize that they are the ones that can warrant reliable and up to date customer data, and thereby contribute to the long-term success. Leadership will emphasize the importance of data whenever there is an opportunity, thereby achieving top-down impact on the organization.

2. Data maturity assessment

With the help of KPMG, VIVAT executed a data maturity assessment. VIVAT was tested on four aspects of the KPMG data and analytics maturity model:

  1. realize data strategy and governance;
  2. implement data architecture and technologies;
  3. data and analytics organization;
  4. data operations.

An elaborate explanation of the KPMG data maturity model can be found in the box: “Getting the basics right: using the KPMG framework to improve data and analytics maturity”.

At the time KPMG did the data maturity assessment, VIVAT was transforming from a reactive and business-oriented data organization towards becoming proactive and applying data and analytics – not just to the separate businesses, but the entire organization. Awareness sessions on data were organized for every business in the VIVAT organization, in which the business leaders were challenged to come up with data and analytics initiatives. VIVAT is still working on improving its data and analytics maturity level, with the goal to make fact-based decisions with the use of data and analytics, and have it embedded in the organization.

3. Evangelize data within the organization

After the data maturity assessment took place, several workshops were organized with the management teams of VIVAT product line departments. Data awareness was enhanced through these workshops, with a focus on gathering ideas for the use of data in VIVAT’s product lines.

Next to that, VIVAT offered extensive education and training programs for a considerable part of the workforce (named Data Academy). The company partnered with Amsterdam Data Science (University of Amsterdam), Rotterdam School of Management, University of Groningen and Jheronimus Academy of Data Science (JADS), to considerably raise the competence level of their employees. The choice to cooperate with universities was a conscious one. In the summer of 2018, around 150 employees had participated in the Data Academy. They act as ambassadors of a data-driven culture in their working environment.

As part of the data evangelism in VIVAT, Bart Rentenaar was appointed as IT Manager Data and Marcel van de Lustgraaf as Deputy Data Governor. Van de Lustgraaf: “Originally, data was gathered to support primary processes and management information. The shift from process and management information to value generation with the use of data and analytics is taking place right now.”

In order to facilitate the business in their steps towards data-driven decision-making, supportive tooling was implemented. A few of these tools are the enterprise-wide roll-out of MS Power BI and setup of a data shop, providing each user with the relevant data they are looking for.

4. Alignment with business

Business managers are focused on improving the financial and/or commercial performance of their unit. Consequently, data initiatives should be aligned with their goals to make an impact. The good news is that business cases are plentiful. Better use of data offers excellent opportunities to optimize risk analyses and prospective information, and may result in better churn rates, opportunities to detect fraud, increase cross-selling and optimize dynamic pricing models. For instance, with the use of data and analytics, VIVAT has estimated to detect an additional € 10 million of insurance fraud each year.

There is also the phenomenon of cold feet in middle management. Although the positive effect of using data in the business is proven, not every business manager is ready to fully incorporate data in their decision-making. Business managers are in doubt if the data algorithms in use are effective, even if they have proven to do so. Another dilemma is that some initiatives may pay off in the long run, while business managers are focused on the short term. Effort is still needed to make them trust the data and their outcomes.

Before a data and analytics project is started, first the potential benefits are identified. Business and IT work together to prepare the business case and create support from management level.

To conclude, there’s also the dilemma of the chicken and the egg. Business managers may at times argue that on the one hand, data quality required to support data initiatives is not at the desired level; while on the other hand, investing in data quality – for instance by initiatives in the customer service units – is reluctantly encountered by that same business manager, as they don’t see the immediate value.

All in all, strong use cases that align with the P/L thinking in middle management and good cooperation with IT are needed to overcome these dilemmas, together with company-wide investments in data quality.

5. Define an enterprise-wide data strategy and action plan

Becoming a data-driven organization requires appropriate preparations. The most important step is to formulate a strategy to have a clear view on the perils of data – and how data and analytics contribute to the digital ambitions – what changes are needed in processes, people and systems. VIVAT defined four complementary strategic domains in this respect:

  1. data-driven culture (have a data-driven mindset);
  2. data utilization (create value with the data);
  3. data engineering (have the right data available);
  4. data management (have the correct data).

Given the importance of data and analytics, these activities were repositioned from the Finance function to a more independent position. Originally, data and analytics were in the Finance function, primarily focused on creating management information and financial statements. By setting them up more independently, data and analytics are positioned to support all business functions across VIVAT.

In order to improve the awareness among the company, the ITC (Information Technology & Change) department was renamed: Data, Technology and Change (DTC). This better reflects the broad and fundamental nature of the challenge of this shift.

Getting the basics right: using the KPMG framework to improve data and analytics maturity

Having mature data and analytics in place requires the translation of business needs into practical steps and initiatives. At the same time, it requires a solid foundation to support these steps and initiatives. In order to accomplish the solid foundation, we distinguish the following set of measures.

C-2018-4-Sloots-02-klein

Figure 2. KPMG framework for improving data and analytics maturity. [Click on the image for a larger image]

1. Data strategy and governance

Data strategy and governance focuses on the development, strengthening and enhancement of data management activities within the organization. It provides the foundation and outline of best practices, policies and organizational structure regarding the long-term strategy of data, and is the basis of shared decision-making across the organization. Data strategy also aligns the overall data-related initiatives to broader organizational goals and strategic milestones. Governance crosses various levels, from strategic to operational, to ensure that ownership and accountability is in place, and standardized processes are available to achieve data value ([Staa17]). Both need to be translated into KPIs, to realize embedding and adaptation within the organization. Both strategy and governance should be sponsored by the strategic organizational level (e.g. CEO or Board of Directors). The strategy should also include a change approach: communication and awareness building activities are vital to changing the business into a data-driven organization.

2. Data architecture and technologies

A data architecture is a holistic view of the data landscape, represented through schematic diagrams on an application level or data field level. This view aims to bridge the gap between business and IT by representing business data requirements, and mapping these to technical data requirements, and visualizing applications and data flows in application blueprints and data flow diagrams. Having these available helps to justify short-term data initiatives, as these can be aligned with the overall view on data and its storage, and processing within the existing systems and applications. A dimensional analysis, where all data elements are identified and defined, builds the foundation for the Enterprise Data Model, as well as meta data management. This also encompasses master data management, which is:

  • managing of shared data to meet organizational goals;
  • reduce risks which are associated with data redundancy and duplication;
  • ensure higher quality of data;
  • reduce costs related to data integration and use of data between different systems, processes, analytics initiatives and reports.

It focuses on a timely and relevant version of the truth for each product, business partner, place, person, organization or reference data. And lastly, it consists of the tooling for data quality and data governance. These tools support the data & analytics capabilities within an organization.

3. Data and analytics organization

Having a data and analytics organization in place enables consistent management of both data (e.g. consistent data quality and definitions) and analytics (e.g. algorithm lifecycle management, but also using the data aligned with the given consent) ([Verh18]). Key is to ensure enough data capabilities, as data & analytics is still an evolving domain.

4. Data operations

Data operations consist of:

  • Data quality management, i.e. the planning, implementation and control of activities that apply quality management techniques to data. It encapsulates the criteria, tools and processes required for increasing value added from data initiatives. In a structured five-step process (initiate, assess, design, cleanse, monitor) data is profiled and analyzed. From these analyses, business rules are distilled and implemented to increase data quality.
    The role of good data quality management is increasing due to the growing embedding of data within organizations. To minimize the risk of poor-quality data, and be more in control of the correctness and trustworthiness of data, organizations need to plan and execute on data quality management.
  • Data interoperability, i.e. connecting systems and data, whilst making their interaction patterns and interdependencies transparent within source systems, data warehouses/lakes, specific data stores and reporting/calculation engines, for example by data lineage or flow diagrams. This is a requirement for e.g. data-driven regulation, such as: IFRS, GDPR and Solvency II.

Organizations implementing data & analytics should use such a framework, preferably based on international standards (e.g. DAMA DMBOK [DAMA17]), legislation, but also consider that the framework should be flexible and sustainable. As said, data & analytics is a domain still under development, so flexibility and sustainability are key. The framework that a company uses to implement data & analytics should consist of solutions, that together deliver the end-to-end view on data & analytics.

Conclusion

Becoming a data-driven organization is a massive transformative goal. Experience shows that thinking big is great and stimulating, but also that it is vital to not confront the organization with an overload of new activities. One example in the case of VIVAT is a data-driven risk analysis, used to detect possible insurance claim fraudsters within a specific insurance portfolio. The result of this analysis showed more than 150 clear-cut cases. However, the best way to achieve tangible results was to start small, by asking the professionals in charge of fraud detection, to follow up on a limited selection of potential fraudsters. This will hopefully be so successful that it will seduce the VIVAT professionals to do more. And it will also stimulate that processes become more data-oriented. VIVAT has still a long way to go, but it realizes that data is the new oil to fuel their business.

VIVAT is well on its way to becoming a more digital oriented insurer based on data. The basics are now at the desired level. The challenge is to embrace change in a controlled manner, so that VIVAT becomes a real data-driven organization. The data journey has started.

References

[DAMA17] The Global Data Management Community, The DAMA Guide to the Data Management Body of Knowledge, DAMA International, https://dama.org/content/body-knowledge, 2017.

[ECON17] The Economist, The World’s Most Valuable Resource is no Longer Oil, But Data, The Economist.com, https://www.economist.com/leaders/2017/05/06/the-worlds-most-valuable-resource-is-no-longer-oil-but-data, May 6, 2017.

[Staa17] A.J. van der Staaij and J.A.C. Tegelaar, Data management activities, Compact 2017/1, https://www.compact.nl/articles/data-management-activities/.

[Verh18] R.S. Verhoeven, M.A. Voorhout and R.F. van der Ham, Trusted analytics is more than trust in algorithms and data quality, Compact 2018/3, https://www.compact.nl/articles/trusted-analytics-is-more-than-trust-in-algorithms-and-data-quality/.

[VIVA18] VIVAT, About us, VIVAT.nl, https://vivat.nl/en/visie-en-missie, 2018.