


Trusting data for analytics provides challenges and opportunities for organizations. Companies are addressing data quality within source systems, but most are not yet taking sufficient steps to get the data used for analytics under control. In this article we will take a closer look at how the more traditional data management functions can support the dynamic and exploratory environment of data science and predictive analytics. We look at existing customer challenges in relation to these topics as well as the growing need for trusted data.
Verify your trust in your data & analytics
Organizations become increasingly dependent on data and results of analytics. For more traditional purposes such as Business Intelligence or reporting, there is an increasing awareness of the value of good data quality. This awareness is also in place for organization which focus on innovation, they have developed detailed analyses to understand customers better, which has led to made-to-measure products, pricing and services for their clients. Next to that, data-driven regulation is fast expanding, which also relies heavily on good data quality. The well-known GDPR (data privacy) is an example of such data driven regulation, but also BCBS#239 (collecting data on risk aggregation for Banks) and Solvency II (proving in control data for insurers) for financial services as well as data requirements for EU food regulations. In order to be able to keep up with all these – quite fast-changing – developments, organizations increase their usage of data and analytics for their reporting, better understanding and servicing their customers and to comply with regulation.
As the value of data & analytics increases, so is the awareness of users of associated products, e.g. report owners, management, board members as well as (external) supervisory authorities. And with that increasing awareness comes the growing need to rely on trusted data and analytics. These users are therefore looking for insights that ensure trustworthy data and analytics ([KPMG16]). For instance, understanding that the data they use is correct. Or from an analytics perspective that analyses are done in accordance with ethical requirements and meet the company’s information requirements. Trustworthy data quality is not a new topic; in the last decade, organizations have focused on data quality, yet mostly in source systems.
With the further maturing of these analytics initiatives, many organizations now want to extend data quality from source systems to reporting and analytics. One of the side effects of this development is that the analytics pilots and initiatives organizations have in place, are now also examined on how to further mature them, moving from pilots for analytics to sustainable solutions. In short, the relevance of trustworthiness of both data and analytics is increasing. Which requires data quality to provide complete, accurate, consistent and timely insights, and of algorithms used for analytics which are repeatable, traceable, demonstrable and of consistent analytics – in accordance with ethics and privacy requirements ([Pato17]).
This trustworthiness in practice can be challenging for organizations. Although organizations have invested in improving the quality of their data – still the data quality and data definitions are not yet always consistent throughout the entire organization. And as most organization are still at the pilot level for establishing their analytics environment, building trust in analytical algorithms is even more complex.
A good starting point to increase the trust in both data and analytics is a so-called data and analytics platform – for instance in the shape of a “data lake”. In this context, a data platform can be considered as the collection of data storage, quality management, servers, data standardization, data management, data engineering, business intelligence, reporting and data science utilities. While in the recent past data platforms have not always delivered what they promised (in some cases turning the data lake into a data swamp – where data is untraceable and not standardized) ([Scho17]). With that knowledge, organizations already or are currently implementing data-driven initiatives and data & analytics platforms ([GART17]) are now focusing to build a controlled and robust data and analytics platform. A controlled platform can function as the initial step for trusted data and analytics.
Virtual salvation or virtual swamps?
To bring trustworthiness to data & analytics, new technologies such as data virtualization ([FORB17]) are currently being explored. These offerings promise the speed of computation and diversity of integration of a data platform without having to physically store a copy of your original data on a separate environment. Virtualization also offers optimization, scalability and connectivity options with faster access to data. From some perspectives, this sounds even more promising than a data lake. But this increased potential comes with a risk. If a solution that is even more easily “filled” with data is left uncontrolled, the risk of drowning in a “virtual swamp” might be even higher. In general, we see that a trusted data & analytics framework is consistent in bringing trust to ever-developing technology.
Next to the case for trustworthy data & analytics there are several cases which a data platform typically solves:
- reduction of complexity within reporting infrastructure (such as lower replication costs and associated manual extraction efforts);
- increased insights in available data;
- reduction of complexity and dependencies between source applications (by decoupling systems vendor lock-in is reduced when a system change can be absorbed with standard data models and customizable system connections (APIs) in the data platform infrastructure).
Given the potential values of the data platform, it is essential that the risk of turning the prized data platform in a swamp (see box “Virtual salvation or virtual swamps?”) is mitigated. In the following section we present a control framework that will keep the beast at bay and will allow a healthy combination of data exploration to coincide with a data platform under control.
Data platform under control
For decades, data warehouses have supported reporting and BI insights. They applied a so-called “schema on write” approach, which simply means that the user is required to predefine the structure of a table (called “schema” in technical terms) to be able to load (or “to write”), use and process data. Having a predefined structure and extraction, transformation and loading processes developed specifically for your data set ensures predictability and repeatability. However, the structure that the data is written into is typically created for a pre-defined purpose (a report, an interface, etc.). Furthermore, the process of defining, and even more so combining these schemas, is usually time consuming and diminishes flexibility, a crucial aspect in fast-changing environments.
Data platforms bring the flexibility that changing environments require. They offer an alternative “schema on read” approach that allows a user to load data onto the platform without caring for which schema it is loaded into. The platform technology simply takes the data as-is and makes it available to the user as-is. This decreases the time spent on defining schemas or complicated modelling efforts and allows the user more time and flexibility to apply the data. This approach is already taking place: companies have on-boarded as much of data as possible into a data platform, making investments in the expectation that merely making this data available to an user base will kick-start their data-driven business.
As always, the reality is more complex, caused by the fact that the user base is ill-defined, a lack of quality and semantic agreements and context of the available data. This results in data overload that will refer users back to the traditional environments (such as, data warehouses, traditional BI tools or even Excel spreadsheets) and will limit existing users to the data (sets) they know. Furthermore, with the enforcement of the General Data Protection Regulation (GDPR) in place since 25 May 2018, on-boarding sensitive (personal) data onto a platform where many users can access this data without proper access controls and data protection controls (incl. logging and monitoring), exposes the organization to large compliance risks, such as fines.
In the following paragraphs, we opt for an approach to on-board data sets that combines a blended approach of measures for both data and analytics, controlling the ingestion of data sets sufficiently to support compliance, while still enabling innovative data exploration initiatives. The following steps are defined within this blended approach; setting preconditions, deliver prepared data, standardize the data, exposing ready-to-use data, enable traceable analytics and keep monitoring. Figure 1 visualizes these steps.
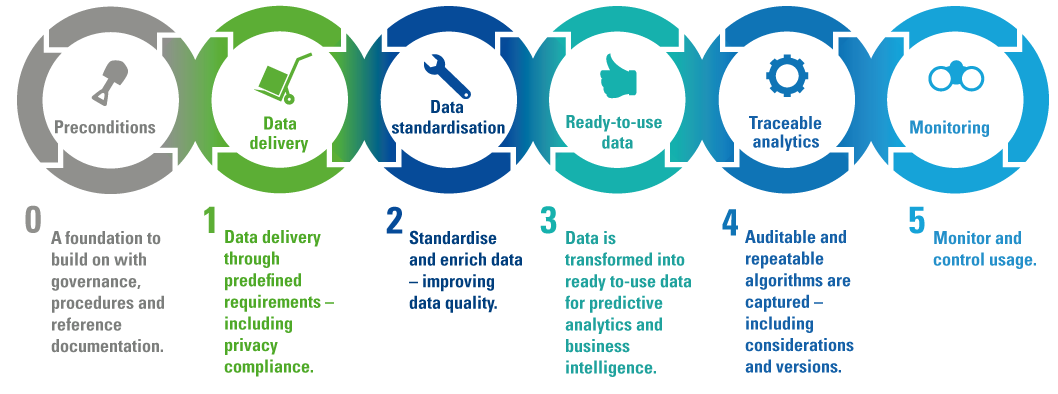
Figure 1. The KPMG Data Platform Under Control framework with relevant preconditions and 5 steps for practical trust in analytics. [Click on the image for a larger image]
Step 0: Set up the platform
Setting up a data platform is typically perceived as a technology solution. Considering the challenges indicated in the previous paragraph however, the technical implementation of a platform and its interfaces to source systems should go hand-in-hand with the creation of reference documentation, agreement on standard operating procedures and implementation of a data governance framework.
Sufficiently detailed reference documentation should at least be partially in place. We can distinguish three main categories: enterprise IT and data architecture, a data catalogue and an overview of tooling used throughout the data lifecycle. These documents should be easily available and automated in such a way that users can quickly find the information they are looking for during on-boarding or development activities.
Standard operating procedures should be in place, providing guidance for data processing processes and procedures within the data platform. Examples include: on-boarding of new data sets, data remediation activities, how to deal with changes, incident and limitation procedures. These procedures go hand-in-hand with the data governance framework, which consists of a list of roles involved within these processes and procedures and their corresponding responsibilities. Key critical roles within this governance framework are the user community (data scientists, data engineers), the data operations staff (data stewards, data maintainers) as well as the roles that have accountability over a data source such as a data owner. Ownership should also be considered before the data delivery is started. It encompasses involving the right functions, responsible for the data in the source system and connecting them to the persons responsible for building the data platform. Establishing end-to-end ownership can be a goal, but of primary importance is the focus on agreements on data delivery service levels and the division of responsibilities throughout the data delivery processes at first, so that aspects like sensitivity or intellectual property loss or privacy are given the proper attention and the usability of the data set is tailored to the end-user.
Step 1: Control the data delivery
Data delivery is the correct transfer of data from source systems to the data platform. For data on-boarded on the platform, clear provenance (understanding the origin of the data) must be available. This provenance must also contain the source owner, definitions, quality controls as well as which access rights should be applied. These access rights should specifically be in place to fulfil the increasing demands of privacy regulations such as the GDPR or e-Privacy. After all, the data delivered might contain personal identifiable information details – this needs to be identified when the data is delivered to the data platform and protected by design ([GDPR18]).
Furthermore, when on-boarding data on the platform, the context for data usage must be predefined and the data platform should have controls in place to regulate the usage of data within this context. Next, several measurements should be done to measure the type and quality of the data loaded for use. Of course, the integrity of the data should be ensured throughout the whole delivery process.
Step 2: Standardize the data
Data from different sources are loaded into the platform. This means data will differ in format, definitions, technical & functional requirements and sensitivity. In addition to the access controls of step one, the sensitive data needs to be anonymizatized or pseudonymized ([Koor15]), making it impossible to trace individuals based on their data within the data platform.
After the anonymization, the data is standardized. To be able to perform data analysis, consistent values are required and functional names need to be uniform across different data sets and definitions need to be consistent. Why are definitions important? For example, to do proper marketing analyses, different types of customers need to be distinguished, such as potential customers, customers with an invoice, customers with an account and recurring customers. In case of disagreement between units on these definitions, analyses or decision-making mistakes can be easily made.
Lastly, data quality improvements (or: data remediation) must be applied at this stage to bring the data to its desired quality level to be able support the usage of this data in reports and algorithms ([Jonk12]).
These steps – anonymization, standardization, remediation – occur in this fixed order to realize the data processing procedure. Documenting these activities in a standardized way also ensures the users’ understanding of the data in the data platform (see Step 4). This document contains the followed steps and primarily increases readability and therefore understanding with users and secondarily enables easier integration of processing routines of multiple users of the same data set. Figure 2 shows an example.

Figure 2. An example of why standardized data processing makes collaboration between scientists easier; a standardized processing procedure allows easier reuse of code, standards and rules. [Click on the image for a larger image]
Step 3: Delivery ready-to-use data
After standardization, anonymization and data quality improvement, the data is in fact ready to be used for analysis purposes. The data has reached ready-to-use status when it can meet the needs of the users, that the user knows what the source is, knows how to interpret the data, trusts the data quality of the data and can obtain formal agreement from the data owner for their intended analysis.
Step 4: Enable sustainable analytics
The previous steps are all focused on controlling the data. However, trusted data & analytics also require controlled usage and analysis activities. Algorithm design should be documented and governed in a similar way to implementing business rules for data quality improvement, with the additional requirements for documentation of versioning, ethical considerations and validation that the working of the algorithm should match its intended goal. By documenting the algorithm including its complete lifecycle (from design to usage to write-off) enhances its sustainability. After all, having a complete overview of the algorithms lifecycle, produces traceable and repeatable analytics.
On a practical note; to keep track of all the activities performed on the data platform an audit trail should be kept. Luckily, many data platforms offer this functionality out of the box. Documenting analyses can be done in specialized software that also enables analyses such as Alteryx, Databricks, SAS, etc. This ensures that the documentation is close to the place where analysts use the data and reduces the effort to maintain separate functional documentation.
Step 5: Keep monitoring
Effectiveness of the extent of control of your platform can be verified through continuous monitoring. Monitoring of effectiveness is an essential part but should be proportional to the size, goal, importance and usage of the data controlled on the platform. Through consistent and fit to measure monitoring it is possible to demonstrate and improve the process steps as described above, the related control framework and quality of an information product once provided to a user from the data platform. Insights provided through monitoring will be used to determine compliance with the current control framework and ultimately to evaluate and refine the data platform controls (e.g. modify data quality rules).
With the increasing the development of data platforms, the development of trusted data & analytics is also a recent phenomenon. It all coincides with the rising need of repeatable and sustainable analytics, as well as examples of previous data platforms have turned into the dreaded data swamp. Therefore, this approach has been adopted across sectors, for instance by an international tier-1 bank, an innovation center and a Dutch energy and utilities company. The level of acceptance of this new way of working differs. Where increased compliance is required, this trusted environment helps to support and resolve complex regulatory requirements. However, from a data science / data analytics perspective, analysts in general perceive this control as interfering in their way of working as they were used to a large degree of freedom roaming around in all data available. It is important to align all stakeholders in the new way of “trusted” working, optimally supporting compliance whilst leaving room for freedom to be able to indeed create (new) insights. This balance maintains progress in the acceptance of trusted data and analytics.
Capture the trust
How do you demonstrate that controls exist and are effectively working after they have been put in place? The evidence for these controls is captured in a so-called “data & analytics way-bill”. It contains the documented activities and results as described above in step 1-5, for example the name of the data set, the owner, where the original data resides, for which purpose it may be used, the level of standardization, etc. etc. This way-bill document ideally automatically captures the output of all controls and measures the controlled on-boarding and usage of a specific data set. Furthermore, it connects the tooling used within an organization to support data governance, capture data lineage, measure data quality, keep a backlog of to be implemented business rules, standards and algorithms, etc.
In order to provide trust in data for analytics, the way-bill has proven to be a valuable device to demonstrate the effectiveness of all controls during the entire process the data set is subjected to; from source through the on-boarding and ultimate usage of data within the platform. This overview does not only provide trust in the data itself, but also in the algorithms used, underlying data quality and supportive technology and architecture.
Conclusion
As outlined in this article, trusted data for analytics consist of a step-by-step approach to realize relevant controls in a data platform to support a compliant, dynamic and an exploratory environment of data science and predictive analytics. Our blended approach combines lessons learned from controlling traditional systems (e.g. pre-defined data structures, data management controls, data definitions, governance and compliance) with the benefits of a dynamic and exploratory data platform (e.g. data lake). With a data platform under control, organizations are able to deal with data in a faster, cheaper and more flexible way. Controlled and ready-to-use data for data science and advanced analytics purposes also offers possibilities for flexible, fast and innovative insights and analyses.
References
[FORB17] Forbes, The expanding Enterprise Data Virtualization Market, Forbes.com, https://www.forbes.com/sites/forbescommunicationscouncil/2017/12/12/the-expanding-enterprise-data-virtualization-market/#10a39dfd40ca, 2017.
[GART17] Gartner, Gartner Survey Reveals That 73 Percent of Organizations Have Invested or Plan to Invest in Big Data in the Next Two Years, Gartner.com, http://www.gartner.com/newsroom/id/2848718, 2016.
[GDPR18] GDPR, Art. 25 GDPR Data protection by design and by default https://gdpr-info.eu/art-25-gdpr/, 2018.
[Jonk12] R.A. Jonker, Data Quality Assessment, Compact 2012/2, https://www.compact.nl/en/articles/data-quality-assessment/?zoom_highlight=data+quality.
[Koor15] R.F. Koorn, A. van Kerckhoven, C. Kypreos, D. Rotman, K. Hijikata, J.R. Bholasing, S. Cumming, S. Pipes and T. Manchu, Big data analytics & privacy: how to resolve this paradox?, Compact 2015/4, https://www.compact.nl/articles/big-data-analytics-privacy-how-to-resolve-this-paradox/.
[KPMG16] KPMG, Building trust in analytics, https://home.kpmg.com/xx/en/home/insights/2016/10/building-trust-in-analytics.html, 2016.
[Pato17] J. Paton and M.A.P. op het Veld, Trusted Analytics, Mind the Gap, Compact 2017/2, https://www.compact.nl/articles/trusted-analytics/.
[Shol17] D. Sholler, Data lake vs Data swamp: pushing the analogy, Colibra website, https://www.collibra.com/blog/blogdata-lake-vs-data-swamp-pushing-the-analogy/, 2017.