
A practical view on SAP Process Control

There are numerous tools and systems available that enable organizations to gain control and comply to rules and regulations. Examples of these tools are BWise, MetricStream and SAP Process Control. These tools and systems help companies to document their processes, risks and controls, capture evidence of executed controls, monitor and follow up on issues and report on the compliance status of their organization. Many companies using SAP as their core ERP system tend to choose SAP GRC as their risk and control monitoring system. Therefore, we will focus on SAP Process Control and describe its main capabilities and functionalities, implementation considerations and how custom reporting can be leveraged.

Introduction

In an ever increasing complex and regulated business environment, organizations are faced with challenges on how best to manage internal controls and compliance. Despite the recognition that efficiencies could be gained through a more automated control model, many companies are relying on manual processes. Leading companies recognize the importance and urgency to stay ahead of today’s compliance curve and keep pace with changing regulatory and audit requirements.

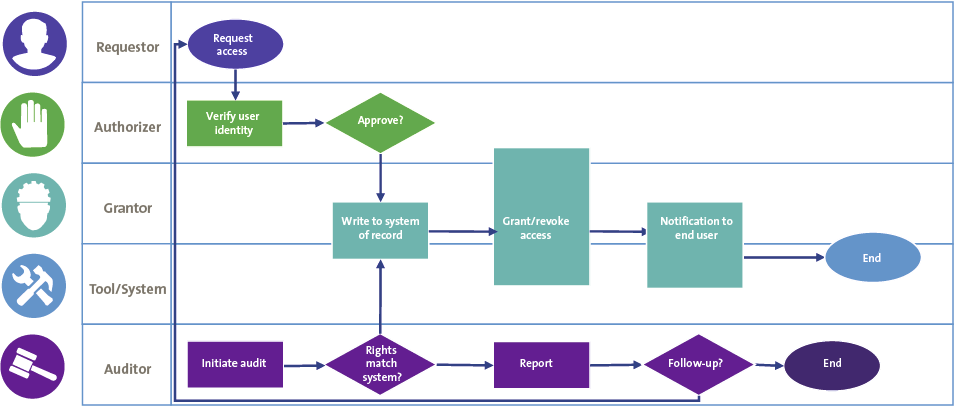
Governance, risk, and compliance (GRC) has become a top executive priority, but many organizations are struggling to manage and control risk effectively today. The ‘three lines of defense’ operating model for managing risk provides a framework that allows organizations to set up their risk and compliance organization. The following lines are defined in the three lines of defense model (see Figure 1):

  1. the first line is business operations management;
  2. the second line includes risk management, compliance, security, and legal departments;
  3. the third line is the independent internal audit function.

C-2017-4-Giesen-01-klein

Figure 1. Three lines of defense model. [Click on the image for a larger image]

There are numerous tools and systems available in the market that enable organizations to gain control and comply to rules and regulations. Examples of these tools are BWise, MetricStream and SAP Process Control (see [Lamb17] article on trending topics in GRC tools in this Compact edition). These tools and systems help companies to document their processes, risks and controls, capture evidence of executed controls, monitor and follow up on issues and report on the compliance status of their organization. Many companies using SAP as their core ERP system tend to choose SAP GRC as their risk and control monitoring system. Therefore, this article will focus on SAP Process Control and describe its main capabilities and functionalities, implementation considerations and how custom reporting can be leveraged.

What is SAP Process Control?

SAP Process Control (PC) is an enterprise software solution which can be used by organizations to manage their compliance processes more effectively and realize the value of a centralized model.

Data forms, workflows, reminders and escalations, certifications, and the use of interactive reports support members of business process teams, internal control and internal audit to carrying out their individual compliance activities. Process Control provides a centralized controls hub in which testing, certifications and policies, monitoring and documentation can take place.

Process Control is a key part of SAP’s GRC software, sitting alongside SAP Risk Management, which enables an organization to define its enterprise risk and responses to those risks and SAP GRC Access Control, which assists in detecting, remediating, and ultimately preventing access risk violations. Although not a requirement for implementation, Process Control can be integrated with these two modules to provide added value to customers of SAP GRC.

Process Control key functionality

SAP Process Control provides the following core functionalities (see Figure 2):

  1. Provides documentation of both centralized and local control catalogs, alignment of compliance initiatives and efficient management of risks and controls through workflow functionality.
  2. Supports scoping through risk assessments and materiality analysis as well as the planning of control testing.
  3. Supports the design and test of the operating effectiveness of controls with online or offline workflow functionality and consistently registers test evidence and issues found from testing. Control testing can be performed manually, semi-automated and fully automated.
  4. Enables the documentation of control deficiencies and issues and provides reporting capabilities to track and correct deficiencies (i.e. re-evaluations).
  5. Leverages sign-off and periodic disclosure survey functionality to formalize management approvals which includes issue tracking and deficiency remediation.
  6. Allows a full audit-trail and log of performed test steps, including documented sign-offs to allow for an independent control audit.

C-2017-4-Giesen-02-klein

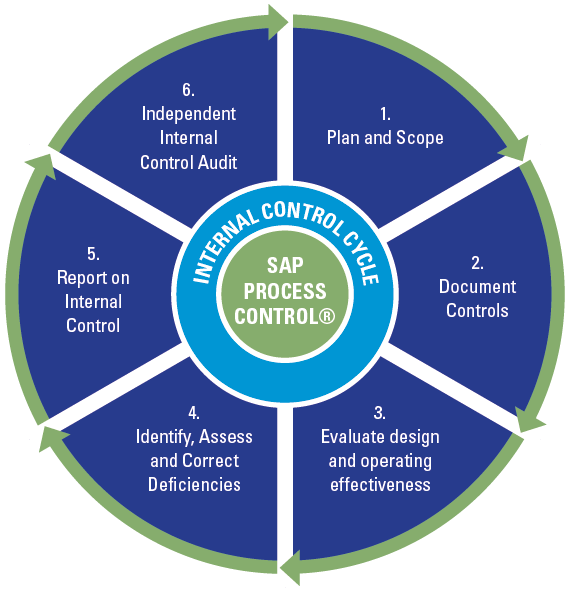
Figure 2. Core functionalities of SAP Process Control. [Click on the image for a larger image]

In practice, some auditors at organizations using Process Control have leveraged the controls description and evidence in Process Control for their (IT) audit procedures. So far, the risk assessment and materiality analysis functionality in Process Control have not been used for this financial statement audit purpose.

SAP GRC Process Control can also perform continuous control monitoring, including monitoring the segregation of duties and critical risks defined in SAP Access Control. Controls can be monitored at a specified frequency (weekly, monthly, etc.) and results can be automatically sent to appropriate control owners.

Considerations for implementing SAP Process Control

When implementing Process Control there are several areas to focus on, including master data setup and workflow considerations. Automated control setup and reporting are summarized.

Besides these focus areas for SAP Process Control it is also very important to consider the use of SAP Access Control and SAP Risk Management and the integration of the various modules in the GRC suite. When all three modules are set up, there will be shared data and integrated functionalities which may need additional attention during the setup of the system.

Master data setup

Process Control master data has two important components: the organization hierarchy and the control library. When setting up the organization hierarchy there are two key questions that need to be answered:

  1. What model will be used to define hierarchies and who should be involved? If multiple GRC components are being installed (the organization hierarchy can be shared by Access Control and Risk Management), multiple teams may need to be involved in the setup of the organizations.
  2. How should the organization report on compliance? This could be on a company code level, line of business, or by region. In some cases, multiple reporting requirements need to be integrated and reflected in the organizational hierarchy. E.g. some organizations require lower level reporting and tend to set up every company code as an organization, whereas other organizations need more high level reporting and set up reporting entities (a group of countries or company codes) as their organizations.

It is important to make decisions around the control framework before loading the control library into Process Control. Here are some aspects to consider:

  1. In case there are multiple control frameworks in the organization, which one should be loaded to the system? Should they be harmonized or should they be separate? What kind of information is most important and should be included in the system, and which information could be discarded?
  2. How to test shared service controls? Will a shared service organization be used in the system or are the individual controls tested and documented by control performers from a shared service center?
  3. All controls need to be assigned to a subprocess, without the subprocesses it is not possible to maintain a control library in Process Control.
  4. Is there a clear distinction as to which controls are performed in which organizational unit? This is necessary for the control to organization mapping.
  5. Will it be required to document account groups, financial assertions and risks covered by the control and control objectives? Process Control has master data available for each of these items that can be setup. This is required if scoping is performed in SAP Process Control.

The master data is the foundation of the system. In the situation in which (Master) Data Management is not thought through or set up correctly and according to the company needs, there could be an impact on reporting and efficiency of the functionalities that are used. If framework integration is not performed properly this could even lead to duplicate controls being tested.

Workflow use cases

The second important area of interest during an implementation is around workflow. The first question to ask here is: ‘What does the organization’s compliance process look like, how are controls to be tested, and should this be documented?’, since it makes sense to only implement workflows that will benefit the organization. Furthermore, it is important to bring all the relevant stakeholders together and agree on the owners of the various workflow tasks and which areas can and cannot be customized. It is also important to agree upon the degree of notifications and reminders that are needed. If users get too many emails, the intent of the emails could get lost and users may end up ignoring them.

Once the testing cycles have started and the system starts being used, it is important to have an administrator to monitor all incoming tests and if necessary reroute, close or even delete them from the system. This must be done with the utmost care and should only be performed by experienced Process Control administrators.

Automated controls

SAP Process Control can perform semi and fully automated testing of controls. The SAP GRC module retrieves the settings from the target system and analyses reports or system settings and validates these against set business rules to determine whether the settings comply or not.

When setting up automated controls, there are different types of controls that can be identified: application controls, master data controls and transactional controls. Even though Process Control offers various integration scenarios, the key is to keep it simple upfront and focus on configuration and master data controls to achieve minimum setup difficulty. The different types are depicted in Figure 3.

C-2017-4-Giesen-03-klein

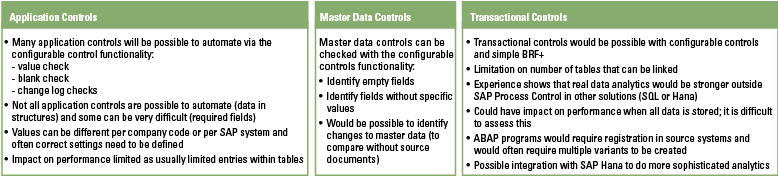
Figure 3. Control types for automation. [Click on the image for a larger image]

The most important integration scenarios to cover these types of controls are:

  • The ABAP (Standard SAP Report) integration scenario (e.g. providing control performers with the RSUSR003 Report). The added value of ABAP report controls is the (workflow) support it provides to internal control staff for retrieving the right data from the various SAP systems and delivering it to the appropriate mailbox for further analysis.
  • The configurable controls scenario (e.g. check whether tolerance limits are set). The configuration controls are stronger than the other two types, on a daily basis and based on a change log that the customized settings in SAP can be verified.
  • The HANA (SAP Advanced analytics platform) integration scenario (e.g. perform advanced analytics to find potential duplicate invoices). The integration with Process Control is to relate the identified exceptions to a control, and assign such controls to the right staff.

While setting up automated controls it is essential that the controls are pre-tested in the acceptance environment and that stakeholders as well as control owners are aware of the potential issues that will be raised as outcomes when controls like these are automatically tested.

Reporting

The topic of reporting is often forgotten during Process Control implementations, despite its utmost importance. In order to get most value out of the reporting the key is to define the different audiences and only provide relevant reports to each audience. When all reports are available to everyone, this could become an overkill of reporting possibilities and confuse the end users.

During an implementation of SAP Process Control reporting requirements should be gathered up front so that they can be used as a guideline throughout the project. As mentioned before, the organization structure plays a vital role in the system and will also impact the way reports can be used and visualized.

If the standard reporting capabilities in Process Control are insufficient for an organization’s management reporting (for instance due to tactical information needs), external dashboards could be created based on relevant Process Control tables. In order to do this, technical knowledge of the system and its data model is required.

<<START ARTIKELDEEL DAT ALLEEN IN LANGE ONLINE VERSIE TERECHTKOMT, WELLICHT NIET ALS COMPACT-ARTIKEL]

<<in marge van korte versie op dit punt toevoegen: >> For the longer version of this article, see www.compact.nl. >>

Master data components and considerations

A key differentiator for SAP Process Control is the shared catalog of master data that comes from a multi-compliance framework. SAP Process Control allows companies to manage requirements from different regulations and mandates (SOX, JSOX, 8th EU Directive, GDPR, FCPA, etc.) from one central place. Test results of a control will be applicable for multiple regulations, which reduces the overall test effort which would result in cost savings. Much of the master data can be shared between the various GRC modules: Process Control, Access Control and Risk Management. Some examples for this shared data are organizational data, mitigating controls, risks for SAP Risk Management and SAP Process Control.

Both central master data (applicable to the entire company) and local master data (organization dependent) are necessary to setup:

Central master data
  • Organizational Structure
  • Risk Library
  • Control Objectives
  • Account Groups and Assertion
  • Central Control Library
  • Regulations and Requirement
  • Policies
  • Indirect Entity-Level Controls
Local master data
  • Organization-dependent Subprocesses
  • Organization-dependent Control
  • Organization-dependent Policies
  • Organization-dependent Indirect Entity-Level Controls

Organizations

The organization structure is the central common master data entity in SAP GRC. The organization structure can be shared among SAP Risk Management, SAP Process Control and SAP Access Control. Often the structure of the company codes in SAP can be used, where company codes are grouped in countries. However, sometimes the reporting entities are not similar to company codes or structures and alternative structures need to be developed, such as by functional area or business unit.

CAUTION  –  Organization Structure Setup

Companies need to determine how they will arrange their organization hierarchy. It is important that this structure is well considered before building this master data in SAP PC. Consider the following:

  1. What model will be used to define hierarchies and who should be involved? If multiple GRC components are being installed (the organization hierarchy is shared by Access Control and Risk Management), multiple teams might need to be involved in the setup of the organizations.
  2. Additionally the key question is how the organization will report on compliance. Is that on a company code level, a line of business level or perhaps a regional level? In some cases multiple of these reporting requirements need to be adhered to, and need to be reflected in the organizational hierarchy.

Organizations can be grouped as nodes in an organization hierarchy, with sub-nodes such as legal entities, plans, profit centers or divisions.

Central process hierarchy

Defining processes and subprocesses is also an essential step in master data setup. A process refers to a set of activities relating to a specific function in an organization’s operations, such as purchasing. A subprocess refers to a subset of activities within a business process, such as accounts payable within purchasing. Controls are created under subprocesses and are assigned to compliance areas/regulations. A process node can have any level of nested child process nodes, or a single child level of a subprocess. A subprocess can only have control as a child (see Figure 4).

C-2017-4-Giesen-04-klein

Figure 4. Process hierarchy. [Click on the image for a larger image]

The entire business process hierarchy exists mainly to provide context for the control; while the amount of information that can be maintained at the process and subprocess level is limited. The control is the main SAP Process Control master data type through which much of SAP Process Control functionality is presented.

TIP – Master data creation and customizations

There are many dependencies when it comes to Process Control master data. It is recommended to create the objects in the following order:

  1. Regulations;
  2. Control Objectives and Risks;
  3. Process, Subprocesses and Controls;
  4. Organizations.

Notes:

  1. Once all the objects are created, master data assignments can be performed, such as assigning subprocesses to organizations.
  2. Multiple organizational views can be created if separate master data is desired for Access Control, Process Control or Risk Management.
  3. Field based configuration can be customized to hide field and/or allow ‘local’ changes to a field. Attribute values can also be edited, which results in changed contents of fields in the controls screen.

CAUTION  –  Audit trail

It is important to note that nearly all of SAP Process Control master data has effective dates (from and to). This helps to drive alignment with regulations, organizational structures, business process models, controls, monitoring rules, test plans, assessments, and surveys that change over time.

TIP – Master data upload

The MDUG tool in SAP Process Control allows administrators to mass upload data for PC Risk Management from a MS Excel Sheet. This enables customers to capture all of their master data in a single place, which makes reviews and signoffs more convenient.

Note: the MDUG template can often take multiple reiterations in order to upload without errors as SAP checks for multiple items, such as mandatory fields. Refer to the SLG1 logs for insight into upload errors.

Workflow capabilities in SAP Process Control

Surveys and test plans

When workflows are to be sent out, there need to be surveys or test plans that guide the user in performing their task.

Surveys contain a number of questions which need to be answered by the user in order to complete the task. The survey questions are set up by the organization itself and can have multiple answer types. The following answer types are supported:

  • Rating: this provides rating buttons from 1 to 5;
  • Yes/No/NA;
  • Choice: you can define your own answers;
  • Text: free text field.

The surveys can be configured in a way where comments are required once an answer is selected. The surveys need to be setup for each workflow (e.g. one for self-assessments, one for control design assessments, etc). When the workflow is planned the survey that needs to be used is selected. Based on this, the workflow task (both online and offline) will be created with questions from the selected survey.

Test plans are slightly more elaborate and need to be created for each control. The test plan includes steps that need to be performed in order to perform the independent test, including the sample size and sampling method. The test plans need to be assigned to controls in the business process hierarchy. When a test of an effectiveness workflow is sent to the users, the test plan assigned to the control is represented in the task. The user that performs the test plan then needs to execute and pass or fail each step. When this is done a final pass or fail needs to be selected for the entire test task.

TIP – Test plan usage

If test plans are maintained for each control: they also need to be maintained in the system for each control e.g. if there are 300 controls, there will also be 300 test plans, all with multiple steps. It can be beneficial to create one generic test plan with the possibility to add control specific attachments.

A manual control performance plan also needs to be maintained for each control for the manual control performance workflow. This allows the control performance steps to be assigned to multiple testers, enabling shared ownership for performing controls and documenting evidence.

Available workflows

To support organizations in carrying out their compliance with regulations and frameworks, Process Control provides several default workflows to capture execution of control assessments and control tests. Table 1 shows the various workflows that are available and how they can be used and customized within a business context.

C-2017-4-Giesen-t01-klein

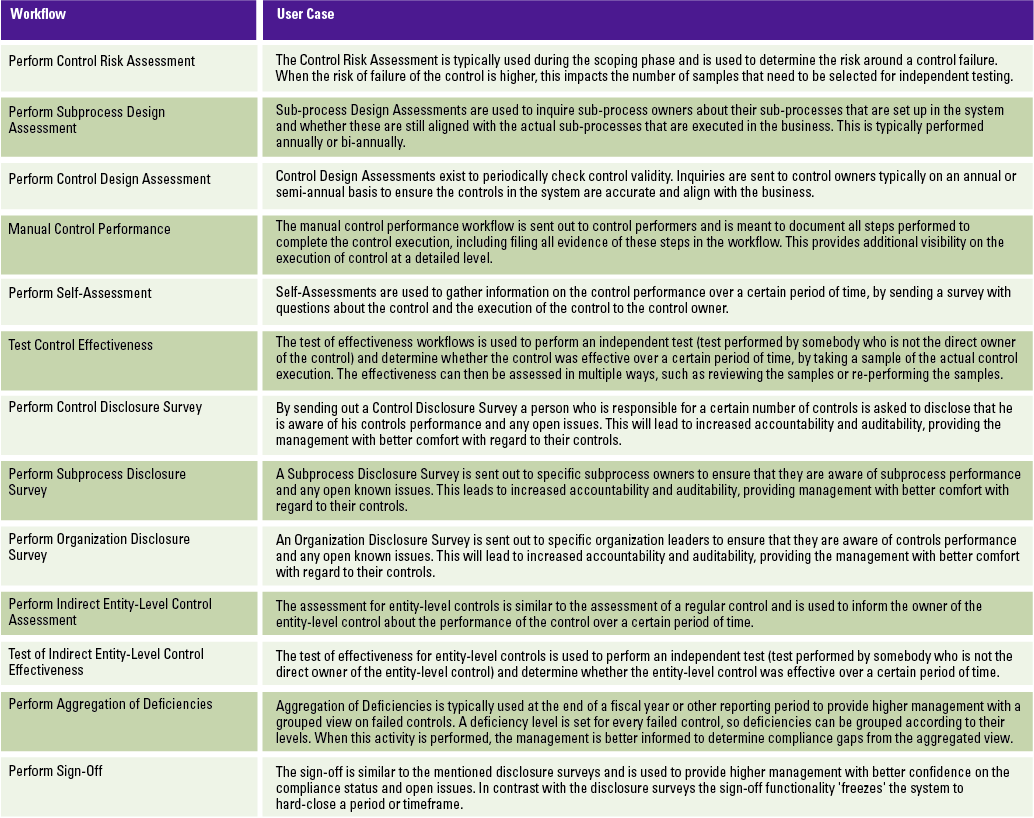
Table 1. Available workflows and corresponding user cases. [Click on the image for a larger image]

TIP – Use of workflow types

Although SAP Process Control contains many different assessment and test types, it is recommended to carefully review the user case for the different workflows in the organization, and not to implement workflows that will never be used.

For all of the workflows where an effectiveness rating is provided there is a built in check which forces the user to create an issue in case the control assessment or test or sub-process assessment failed. When the issue is created, an issue workflow is automatically started. The issue workflow can be leveraged to follow up on the issue and take corrective and preventive actions or start a remediation workflow.

Workflow setup options

As not every organization has exactly the same compliance monitoring processes, SAP Process Control can be customized to better fit the needs of an organization. For all assessment and test workflows a review step can be added in the workflow. The system can also be set up in such a manner that a review step is automatically skipped, based on the rating of the assessment or test (e.g. when the control assessment or test was rated effective the review step will be skipped).

TIP – Different flows in different entities

When the global system is set up to trigger a review for every task performed, but this is not mandatory for all entities within the company, there is a setting in the master data which allows to defer from the standard workflow per organization or per subprocess.

To ensure that stakeholders are aware of the tasks that they need to perform, the system can send automatic notifications, reminders and escalations via email. A notification will be sent to the user that needs to perform a task when the task is created, a reminder is sent to the user some time before the deadline and an escalation is sent to the accountable person just before, or even slightly after the deadline.

CAUTION  – There should not be an overkill of email

When notifications, reminders and escalations are all active, a lot of email will be generated. When too many email are generated, it becomes an overkill and people will get annoyed and set up email rules to automatically reroute or even delete the email from SAP Process Control out of their inbox.

To make the workflows more accessible, SAP Process Control also enables offline processing, making use of Adobe Smart forms. By making use of this functionality, all workflow tasks that are normally performed in the Process Control system can now be performed using interactive PDF files and regular email. When making use of interactive PDF forms, it is really important to monitor the system upon creation of the PDF’s, and that PDF’s are correctly sent out.

TIP – Monitoring the incoming tasks

If the offline Adobe forms are used, it may be beneficial to monitor the process more closely. The following transactions can be helpful:

  • ST22: to troubleshoot short dumps;
  • SLG1: to identify possible inbound emails that have not been correctly processed;
  • SOST: to monitor outbound and inbound email messages.

Monitoring workflows

When workflows are sent out to the internal control community, it is vital to monitor whether workflows are also closed before the set deadline. SAP Process Control provides a standard functionality which shows an overview of all open tasks, which user currently needs to take action on the tasks and whether the task is overdue or not. This overview can be found in the ‘planner monitor’.

When workflow tasks are stuck, it may be necessary to push, reroute or even delete existing workflow tasks.

CAUTION – Workflow administration

Deleting existing workflows must be performed with utmost care. If this is not done properly, workflow tasks could be damaged, or the information of other or all workflows could be removed. When not performed correctly, there can be a large impact on compliance evidence.

Continuous control monitoring

SAP provides functionality to automatically test controls in SAP or in other SAP applications. This can provide great value to organizations and increase efficiencies around control testing. Automated controls often receive a high level of interest from auditors. If they are able to rely on automated controls, there is a potential that their workload will significantly decrease. There are different kinds of integration scenarios possible. In this article, we will discuss the following:

  • the ABAP integration scenario;
  • the configurable controls scenario;
  • the HANA integration scenario.

Continuous control monitoring is set up by connecting the SAP GRC system to other SAP and non-SAP systems. For SAP systems a RFC connection can be leveraged and for non-SAP systems a special third-party connector or an offline connector (with flat files) is necessary. An example of this is shown in Figure 5.

C-2017-4-Giesen-05-klein

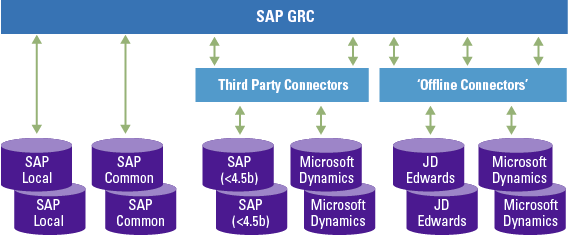
Figure 5. Connection types. [Click on the image for a larger image]

TIP – Automated monitoring requirements

In order to allow automated monitoring in SAP systems, the relevant SAP plugins (GRCFND_A and GRCPIERP) need to be installed in the target SAP system. Additionally a RFC connection needs to be created and a user with the proper authorizations should be available.

Once GRC is connected to other systems, data sources can be created in Process Control. When creating a data source in SAP Process Control, it is possible to link up to five tables together. In order to make use of the programmed or ABAP report scenario, a program or ABAP report needs to be set up for consumption in the SAP target system.

Caution –  Automated controls: ABAP reports

In the case of the ABAP integration scenarios, keep in mind that the ABAP program that needs to be run, needs to be registered in the ABAP Source system with its variant. The variant can be used to make distinctions between organizational entities in SAP. In some cases, additional variants need to be created as part of a SAP PC implementation.

When setting up configurable controls for SAP systems a connection is made to the target system to gather data directly from tables. When the data source has been created (e.g. connection to T001 table) a business rule needs to be set up in SAP Process Control. In the business rule the logic is provided for the system to determine whether values found in the data source are in line with the control (effective) or are not correctly set (ineffective). Based on this logic the system is able to automatically test controls, e.g. when the company code in table T001 is not set to productive (field XPROD equals X), then the control fails.

TIP – Automated monitoring

A configurable control with a daily frequency only checks a certain value once a day. If people know at what time the value is checked, they can still get past the control by changing the value just before and just after the check is done. To prevent this a change log check can be set up. The change log check is similar to a normal configuration control, but provides the changes to the value over a set period of time.

By doing both the regular value check and the change log check it is ensured that the control is effective and has been effective during a set period. This is often the confidence that auditors are interested in.

Many organizations want to make use of the automated controls functionality to monitor transactional or master data controls. However, SAP process control can particularly be used to monitor and test the controls that have actually been implemented in the SAP application itself, so-called application controls. The SAP configurable control functionality can be used for this by performing blank checks (no data has been maintained for specific fields), value checks (values below or above certain thresholds) and change log checks. It is not easy to check for duplicate values within a data source.

TIP – Automated monitoring

A change log check is possible when the change logs on tables have been activated and when the specific table has been flagged to log changes. The change log on a table can be switched on in the target systems via transaction code SE15.

In some cases a combination of different kinds of controls can be used to monitor the actual implementation of the control in the application (required fields within vendor master data) and the effectiveness of the control by monitoring actual data in the system (identifying where required fields have not been populated within master data).

CAUTION – Configurable controls monitoring: what is the real control?

 The automated control functionality supports the testing of controls, but it is important to understand what the actual control is. A useful example is the duplicate invoice check. There are multiple settings required in order to enable the duplicate invoice check. These settings are:

  • the duplicate vendor check in vendor master data (set as a required field LFA1);
  • the warning message that a duplicate invoice has been posted (SAP Configuration – Change Message Control);
  • the setting that the systems need to check on additional fields (transaction code OMRDC).

There are actually three controls that are required to prevent duplicate invoices from being posted. However, the vendor account number is always taken into account in these checks. Nonetheless, most companies still have many duplicate vendor master data records or make use of one time vendors, which would allow the possibility to post a duplicate invoice Iine in the system (or typos made in the actual posting reference number).

A new upcoming solution for control automation is the HANA integration scenario. When there is a connection from the SAP HANA System to the SAP Process Control system, data sources can be set up against SAP HANA calculation view. When this connection is in place a whole new level of analytics and exception reporting can be done with SAP Process Control, by leveraging the powerful and advanced analytical capabilities of SAP HANA.

TIP – HANA integration

SAP advises the use of scripted calculation views in SAP HANA to connect to SAP Process Control, even though both scripted and graphical views can be used.

Note: not all field types are supported in SAP Process Control, e.g. timestamp fields are not supported.

Reporting and dashboarding

Throughout the year, and especially at the end of a compliance cycle, every organization wants to know how they stand against their controls. Thankfully, SAP Process Control comes with many different reports that can help organizations see where they stand. In this section, the most relevant reports for each section are described and the possibilities of customized dashboards are explained.

Master data reports

Reports in the master data section are mostly used to check the integrity and completeness of the master data that has been set up. All changes to master data are automatically captured and can also be reported. The reports are shown in Table 2.

C-2017-4-Giesen-t02-klein

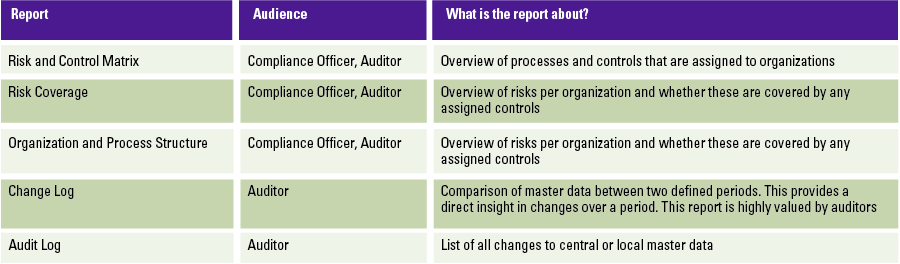
Table 2. Master data reports. [Click on the image for a larger image]

Automated control reports

Automated controls often receive a high level of interest from auditors. If they are able to rely on automated controls, there is a potential that their workload will significantly decrease. The reports in Table 3 can be used by auditors.

C-2017-4-Giesen-t03-klein

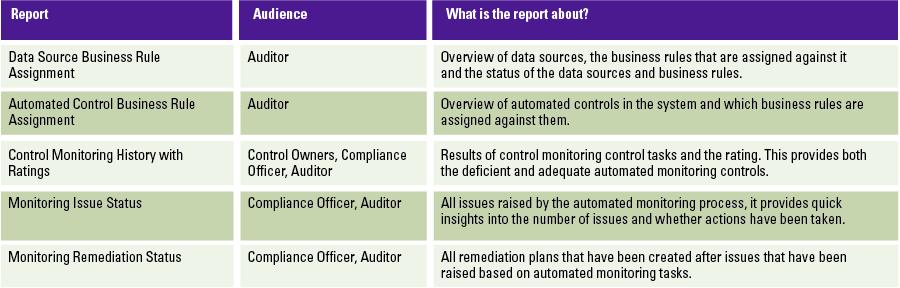
Table 3. Automated control reports. [Click on the image for a larger image]

TIP – Changes to business rules

To report on changes to business rules, the ‘Audit Log’ report in the master data section can be used to report only on business rules. This shows all changes to business rules over the selected period.

Workflow-related reports

The workflow-related reports are used to show the actual compliance status and progress. In the end, compliance is based on the number of controls that are assessed or tested with a positive rating. The reports that provide insights for this are located in the ‘Assessments’ section of the application. The reports in Table 4 are of interest.

C-2017-4-Giesen-t04-klein

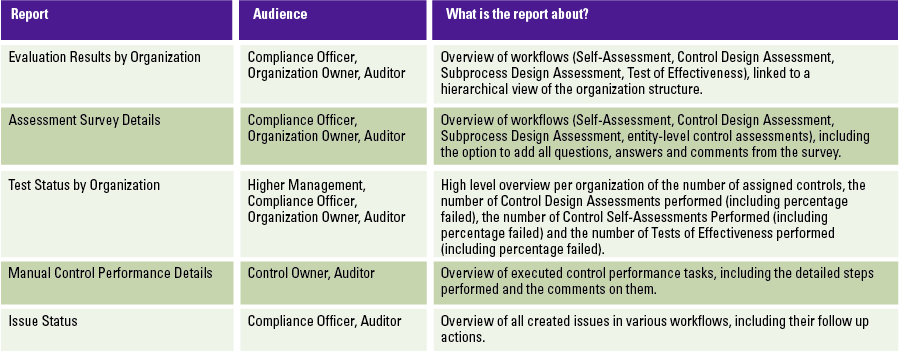
Table 4. Workflow-related reports. [Click on the image for a larger image]

Dashboarding

By default, SAP Process Control provides a number of standard dashboard reports. Even though this dashboard can show results for several workflow types (e.g. Assessments, Tests) and even subtypes (e.g. Control Design Assessment, Self-Assessment), its functionality is limited and does not provide proper information for senior management.

Additionally, SAP Process Control now provides functionalities called ‘side panel’ and ‘entry page’. When the side panel is activated, an additional panel is opened, for instance next to the organization structure. Upon selecting an organization, the side panel will show a small dashboard with assessment or test details and issue details for the controls in that organization. Such a feature can be really useful for end users navigating the system. The entry page can be set up per role and can be used to create an entry page with relevant insights into compliance status, status of control assessments, control tests and issues. This entry page can be customized as part of the implementation.

Custom dashboards can also be developed based on data from the system. When creating custom dashboards, the following aspects must be carefully considered:

  • Data extraction from (other) systems can be performed in multiple ways (e.g. manual extraction, replication to a HANA system).
  • The data must be modeled, so it can be leveraged for a dashboard (there is logic that needs to be applied).
  • Organizations must define their own KPIs. Without proper KPIs, the value gained from the dashboards is limited.
  • Authorizations are different in dashboards: system authorizations are not automatically captured and applied. E.g. if a user is authorized to only display controls for one organization in the GRC system, then this will not be automatically captured in a dashboard as well. This may require separate dashboards or advanced authorizations for the dashboard if this is possible.

TIP – Relevant tables

The master data in SAP Process Control is captured in HRP* tables (e.g. all object names are stored in HRP1000, control details are stored in HRP5304). Other information, such as workflow information, is mainly stored in tables starting with GRPC* (e.g. GRPCCASEAS contains information about assessment workflows).

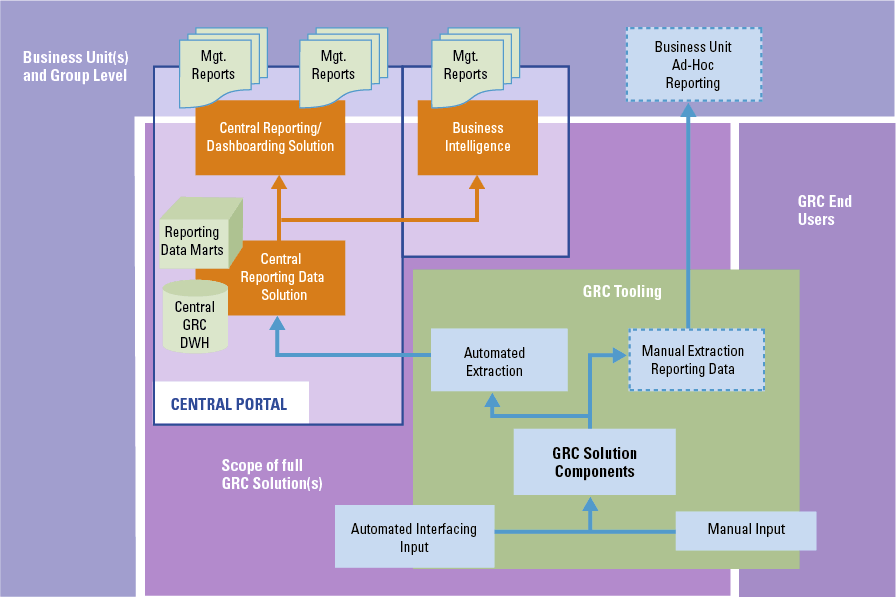
When custom dashboards are created, organizations are free to set up the reporting according to their own interest and level of detail. It is often easier to gain higher level insights and compare different parts of the organization using custom dashboards. Figure 6 shows a possible custom dashboard.

C-2017-4-Giesen-06-klein

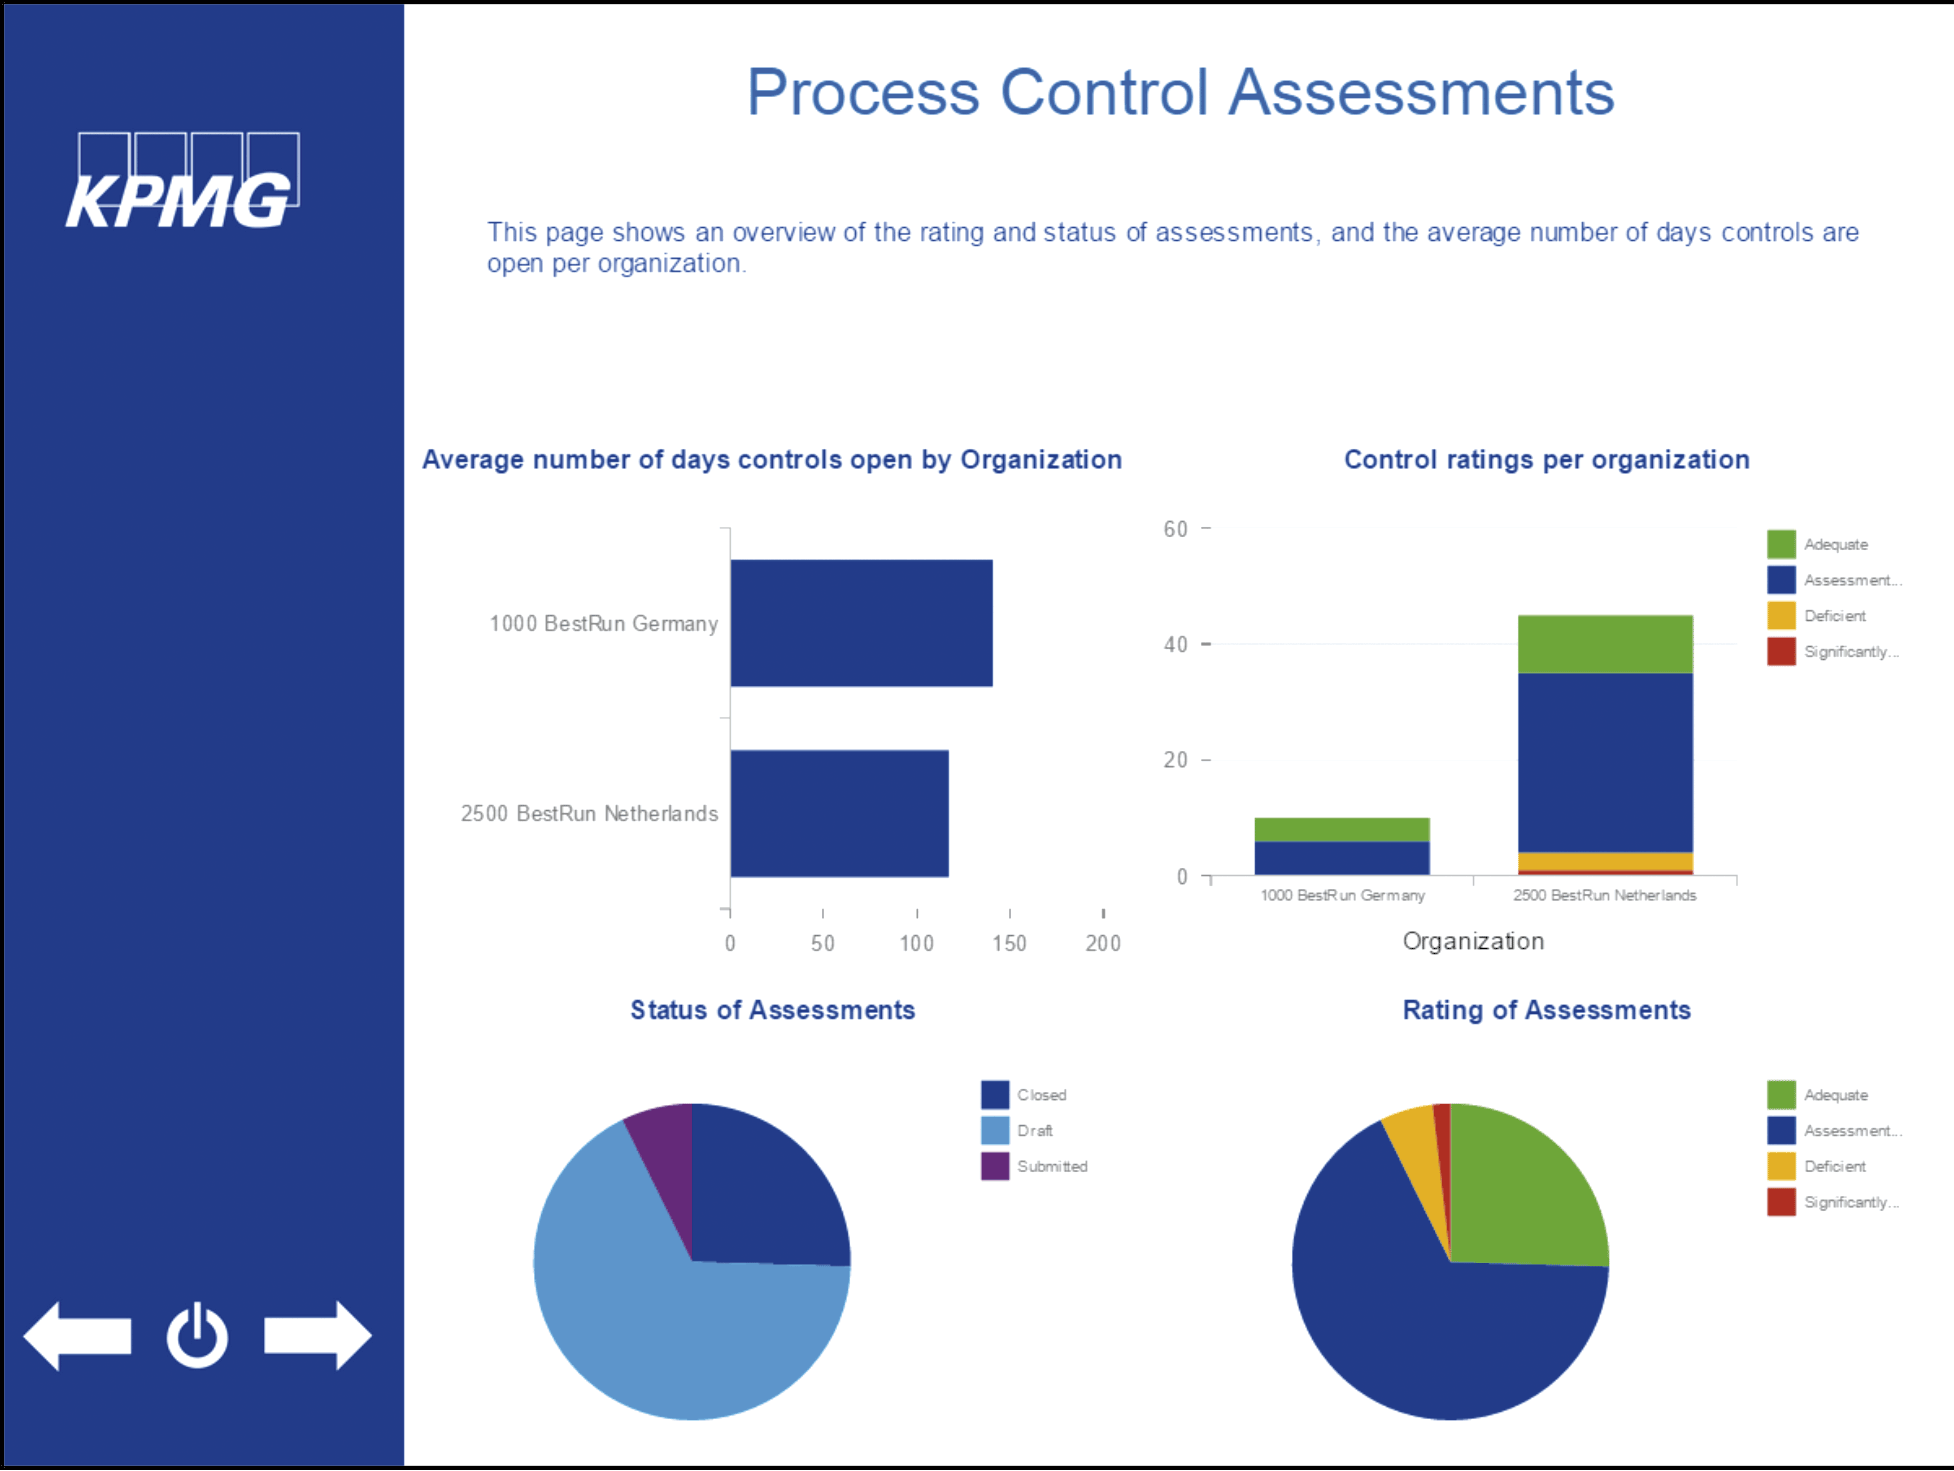
Figure 6. Dashboard example. [Click on the image for a larger image]

Conclusion

In this article, we have emphasized the importance of making the right choices when implementing SAP Process Control. For the master data, it is critical to focus on establishing the right organizational structure and integrating multiple control frameworks. For workflows, it is very important to determine the use cases and really integrate the organization’s way of working into the system capabilities. For reporting, it is all about requirements and determining the right reports for the right audience. Finally, for control automation, it needs to be emphasized that SAP Process Control is not another data analytics tool, but a controls monitoring tool. Therefore, the focus should be on configuration settings. By considering the cautions and applying our suggestions, which are included in the online version of this article, SAP Process Control can be a useful solution to help organizations achieve their compliance goals.

Reference

[Lamb17] G. Lamberiks, S. Wouterse and I. de Wit, Trending topics in GRC tools, Compact 2017/3.

Risicomanagement van uitbestedingsrelaties en ketensamenwerking

Een belangrijke drijfveer voor uitbesteding is dat specialisatie kan leiden tot schaalvoordelen, en uiteindelijk tot kostenbesparingen. Door in ketens samen te werken, worden processen zo veel mogelijk op elkaar afgestemd. Dit kan ook tot besparingen en verbeteringen leiden. De keerzijde van expliciete keuzes – ten aanzien van specialisatie en positionering in de keten – is dat bedrijven en instellingen afhankelijker van elkaar worden. In een steeds meer informatie-gestuurde wereld is daarnaast het bewaken van privacy belangrijk. Uitbesteding en ketensamenwerking vragen om goede kaders en afspraken tussen de betrokken partijen. Bedrijven of instellingen die taken aan andere partijen overdragen, blijven hiervoor uiteraard verantwoordelijk. De overdragende partijen dienen de ‘regie’ te voeren ten aanzien van de overgedragen taken. Dit artikel gaat in op risicomanagement en de rol die informatievoorziening, door middel van tooling en auditing, als onderdeel van de regietaak kan spelen.

Inleiding

Uitbesteding en ketensamenwerking zijn niet meer weg te denken binnen de Nederlandse overheid en het Nederlandse bedrijfsleven. Bedrijven en instellingen lijken constant in beweging voor wat betreft de taken die zij uitvoeren en de samenwerking die zij daarbij zoeken.

Uitbestedingen zijn vaak het gevolg van strategische heroriëntaties, waarbij een focus op ‘core-business’ of ‘core-competenties’ plaatsvindt. Traditioneel gezien gaat het bij uitbestedingen om het overdragen van goed afgebakende processen, zoals bijvoorbeeld salarisverwerking en rekencentra-activiteiten. De introductie van betere, snellere en betrouwbaardere vormen van ICT heeft echter ook complexere vormen van uitbesteding mogelijk gemaakt. Door toepassing van plannings- en communicatiesystemen is het mogelijk geworden dat aanbieders van leermiddelen zich op de inhoud concentreren, omdat het drukken van de boeken en online aanbieden van de leerstof aan derden is uitbesteed. Leveranciers van computers en elektronica kunnen zich op een vergelijkbare wijze focussen op productontwikkeling en marketingactiviteiten, omdat de productiewerkzaamheden gemakkelijk kunnen worden uitbesteed.

Ook ketensamenwerking heeft zich door de genoemde ontwikkelingen op ICT-gebied verder ontwikkeld. Een voorbeeld hiervan is de automobielindustrie, waar de rol van (externe) toeleveranciers bij het ‘just in time’ en op maat produceren van auto’s enorm groot is geworden. In de retail is een vergelijkbare beweging te zien, waar bijvoorbeeld supermarktbedrijven nauw samenwerken met producenten om de voorraden te verlagen en verse waren zo snel mogelijk bij de consument te krijgen. In de bedrijfseconomie staat het actief bewaken van de wijze waarop een product of dienst tot stand komt bekend onder de naam ‘supply chain management’. Specialisatie, het najagen van schaalvoordelen, het aantrekken en behouden van gekwalificeerd personeel en het bewaken van de oorsprong, zoals in het geval van levensmiddelen, worden als de belangrijke redenen voor samenwerking genoemd.

In de publieke sector wordt de samenwerking binnen de overheid steeds intensiever. Een goed voorbeeld daarvan is de samenwerking ten aanzien van het stelsel van basisregisters. Dit stelsel bestaat uit een verzameling databases die het ‘hart’ van de overheidsadministratie vormen. Het gaat hierbij bijvoorbeeld om De Basisregistraties Adressen en Gebouwen (BAG), De Basisregistratie Personen (BRP) en De Basisregistratie Voertuigen (BRV). Het idee achter dit stelsel is dat de overheid slechts eenmaal gegevens van bedrijven of burgers opslaat. Naast kostenbesparing leidt het slechts op één plek vastleggen van gegevens binnen de overheid tot een betere grip op die gegevens, omdat er zo één waarheid ontstaat. Het stelsel van basisregisters maakt het daarbij mogelijk om beter toezicht te houden en meer ‘maatwerk’ te verlenen, voor wat betreft de dienstverlening aan burgers en het bedrijfsleven.

Voor wat betreft ontwikkelingen in de samenwerking kan blockchaintechnologie met recht op het ogenblik een hype worden genoemd. Deze technologie maakt het mogelijk dat er zonder menselijke tussenkomst afspraken worden gemaakt en bewaakt. Alhoewel de toepassingen ervan veelal nog experimenteel zijn, is de verwachting dat blockchain de druk op het risicomanagement verder zal doen toenemen, juist doordat er sprake is van het uitvoeren van transacties zonder menselijke tussenkomst.

Risicomanagement en de toepassing van tooling

Bedrijven of instellingen gaan over het algemeen zorgvuldig te werk bij het afsluiten van samenwerkingsverbanden. Belangrijk bij elke vorm van uitbesteding is dat de betreffende taken zo goed mogelijk worden beschreven en dat de relevante ervaringen hieromtrent worden verzameld. In de overheidssector hebben deze ervaringen met het afsluiten van overeenkomsten met name betrekking op het verzamelen van aandachtspunten ten aanzien van de (verplichte) vormen van aanbesteding of overdracht aan collega-overheden.

In de private sector is sprake van meer keuzevrijheid. Deze vrijheid kan voordelig uitpakken, maar stelt de betrokken partijen ook voor behoorlijke uitdagingen. Door de grootte van de uitbesteding en de hoeveelheid mogelijke aanbieders kan het gevoel ontstaan dat door de bomen het bos niet meer kan worden gezien. Third Party Intelligence (TPI) is een voorbeeld van tooling die kan helpen bij het kiezen of voortzetten van mogelijke samenwerkingsverbanden. Deze technologie meet en projecteert de risico’s van toeleveranciers, door financiële en geopolitieke riscofactoren te monitoren, en daarmee inzichten te geven die direct kunnen worden omgezet in acties. Met behulp van een dashboard maakt TPI de risico’s in het netwerk van toeleveranciers (de ‘supply chain’) inzichtelijk. Dit doet de technologie door gebruik te maken van verschillende soorten data, zoals:

  1. eigen data van de klant (veelal reeds aanwezig, maar vaak onvoldoende benut);
  2. data afkomstig uit vrije, online beschikbare bronnen, alsook afkomstig van betaalde dienstverleners (één van deze exclusieve databronnen kan de KPMG Smart Tech Solution Astrus zijn, zie [Groe16]);
  3. expertise en ervaring van KPMG wereldwijd, inclusief benchmarks.

Daarnaast bestaat altijd de mogelijkheid om de data van de organisatie te verrijken met behulp van vragenlijsten en audits. Dit kan van toepassing zijn indien er onvoldoende data van de toeleveranciers (online) beschikbaar. Vervolgens analyseert TPI deze data en prioriteert de informatie op basis van risico-urgentie, ofwel waar de door de klant vooraf gestelde risicogrens overschreden . De gebruiker ontvangt vervolgens, conform zijn ‘risk appetite’, een overzicht van de toeleveranciers die het meeste risico lopen. Het gaat hier bijvoorbeeld om financiële en reputatierisico’s als gevolg van de afhankelijkheid. Door onder meer de relatieve grootte van individuele toeleveranciers, de mate waarin partners individueel financieel gezond zijn en de geopolitieke spreiding inzichtelijk te maken, kunnen de daarmee samenhangende risico’s worden gemonitord, en op basis daarvan kunnen passende maatregelen worden genomen. TPI maakt hiervoor middels scenarioanalyses de gevolgen van deze keuzes inzichtelijk.

Met de toepassing van TPI kan op risicovolle situaties worden geanticipeerd, zoals een daling van de marktwaarde met zeven procent van de grootste importeur van buitenlandse bieren in de Verenigde Staten, na de verkiezing van Donald Trump als president van de VS. Deze situatie deed zich voor omdat de aandeelhouders zich zorgen maakten door de uitspraken van Trump tijdens de verkiezingen over de verhoging van de importbelasting op bier. Met behulp van TPI zouden de keuzes ten aanzien van de leveranciers van bier vroegtijdig kunnen worden geëvalueerd en bijgesteld.

C-2017-4-Bowier-01

Figuur 1. Screenshot van Third Party Intelligence demo-omgeving.

Regie en risicomanagement bij het beheren van uitbestedingen en samenwerkingsverbanden

Voor het risicomanagement van uitbestedings- en samenwerkingsverbanden is een goede juridische basis, in de vorm van wetten en contracten, een eerste vereiste. In een informatie-gestuurde samenleving is verder – gezien de enorme hoeveelheden gegevens – het gebruik van de juiste zoeksleutels erg belangrijk. In het stelsel van basisregisters betreft dit voor individuele personen het Burgerservicenummer (BSN). Omdat het gebruik hiervan de privacy van individuele personen kan schaden, is wettelijk vastgelegd in welke situaties het BSN mag worden toegepast. De nieuwe privacywetgeving in de vorm van de Algemene Verordening Gegevensverwerking (AVG) beschrijft de rechten van personen waarvan gegevens worden opgeslagen, en de verplichtingen van de partijen die deze gegevens verwerken.

Gezien het belang van betrouwbare informatie bij het aangaan van transacties is onlangs door de politiek het initiatief genomen om het valselijk verspreiden van geruchten wettelijk te verbieden, gezien de gevolgen die dit kan hebben op individuele transacties. Dit zorgt uiteraard voor bescherming, maar ook voor een wettelijk kader, waarmee rekening dient te worden gehouden bij het aangaan van uitbestedings- en samenwerkingsverbanden.

Risicomanagement ten aanzien van individuele verhoudingen is met name gebaseerd op de informatie die verkregen is in aanvulling op de financiële informatie. Het gaat dan om de resultaten van de dienstverlening, eventuele afwijkingen hierin en de oorzaak daarvan. In de meeste gevallen wordt deze informatie uitgewisseld tijdens relatiebeheergesprekken, of door middel van periodieke rapportages. Als er Service Level Agreements (SLA’s) zijn, wordt deze informatie meestal aangeduid als Service Level Reports (SLR’s). Voor het opstellen van deze rapportages is het van belang dat er afspraken worden gemaakt over Key Performance Indicators (KPI’s) en Key Risk Indicators (KRI’s). Verder dienen er afspraken te worden gemaakt over drempelwaarden waarbij directe escalatie plaatsvindt. Voorbeelden van KPI’s en KRI’s zijn in het geval van ICT-dienstverlening de ‘uptime’ en informatiebeveiligingsincidenten.

Voor de uitbestedende partij is het – voor het opvolgen van deze informatie en monitoren van de risico’s – van belang dat de verantwoordelijkheid voor de uitbesteding expliciet is belegd. Deze regietaken dienen met dezelfde aandacht plaats te vinden als de aansturing van taken die in huis plaatsvinden.

C-2017-4-Bowier-02

Figuur 2. Screenshot van Third Party Intelligence demo-omgeving.

Auditing

De uitvoering van onafhankelijke audits kan bij risk management van toegevoegde waarde zijn door de onafhankelijke blik ten aanzien van de uitgevoerde werkzaamheden en de daarover gerapporteerde informatie. Vooral als er sprake is van cruciale vormen van uitbesteding, of bij situaties met veel regulering, kan dit van belang zijn. Een audit en de opvolging daarvan helpen bij het aantoonbaar ‘in control’ zijn. Onze ervaring is dat audits – door het expliciteren van de verhoudingen in samenwerkingsverbanden en ketens – bijna altijd bijdragen aan het risicomanagement, door de verduidelijking die deze teweegbrengen.

Conclusie

ICT-oplossingen zullen naar verwachting tot veel nieuwe vormen van samenwerking leiden. Door de verbeteringen en besparingen die dit oplevert, zal de trend van uitbesteding en ketensamenwerking zich in de toekomst verder voortzetten. De afhankelijkheid zal daardoor groter worden, terwijl globalisering ook tot nieuwe risico’s leidt. Risicomanagement is daarom bij het aangaan en beheren van samenwerkingsverbanden een belangrijk onderdeel.

Voor bedrijven en instellingen die stappen zetten op het gebied van samenwerking of uitbesteding zal de informatie over de prestaties van hun partners een belangrijke basis vormen, waarmee zij het risicomanagement verder kunnen vormgeven. Tooling kan daarbij behulpzaam zijn, doordat de informatie overzichtelijk en in perspectief kan worden weergegeven. Auditors kunnen daarbij helpen door de informatie op onafhankelijke wijze te onderzoeken. Het gebruik van tooling of auditors neemt echter niet weg dat bedrijven of instellingen zich bewust moeten zijn van het feit dat zij zelf eindverantwoordelijk blijven voor de uitbestede taken; daarom dienen deze partijen te zorgen voor voldoende regie.

Literatuur

[Groe16] L. Groen, P. Özer, Mitigating third-party risks with Astrus, Compact 2016/4, https://www.compact.nl/articles/mitigating-third-party-risks-with-astrus/, 2016.

Data migration: manage the risks or lose the project

Throughout recent years, organizations have become more and more dependent on IT solutions when it comes to driving business processes and storing their valuable data. Many software vendors keep increasing and optimizing their (ERP) functionality suites in order to persuade organizations in selecting their solution. Implementing a new IT solution will introduce new opportunities to innovate and optimize the business processes; however, this will draw attention from less attractive aspects, such as the required data migration from the current IT solution to the newly implemented application. In this article we will underline the need for a solid migration, by means of describing challenges we encounter at our clients.

Introduction

Imagine your organization just having finished a major project that replaced the financial system used to support the financial processes. Next to your regular responsibilities, you and your colleagues have been intensively involved in the project to complete it on time and on budget. The entire organization is currently gearing down and is absorbing this huge change.

Then, disaster strikes. Payments seem to be going to the wrong creditors, the sales department is missing crucial client information, stock is piling up in the warehouse and the management is losing confidence in the integrity of the financial reports. In-depth analysis reveals that incorrect and/or missing data in the new environment is the cause of all the problems. Suddenly the central question of the organization is how to correct this situation, how to revive the operational processes, and how to explain this to the external auditor.

Although this scenario seems rather theoretical, it can become reality when a data migration does not receive the appropriate amount of attention and is regarded as a minor and isolated project activity. The challenges that projects and their migrations bring should not be underestimated.

Executing IT projects will present a wide variety of activities and challenges that are not regularly faced by the organization. Examples are business process redesign, functional test management and major changes in the IT infrastructure. In many cases a project is performed by team members who, simultaneously, are responsible for the execution of the day-to-day operations.

This landscape can lead to cutting corners and paying insufficient attention to critical activities, such as data migration(s) to meet deadlines. An ironic observation since the data migration track should ensure that the organizations’ data will properly land in the new IT landscape in order to properly drive the business processes, supply management reporting and provide for external accountability.

Earlier Compact articles, such as [Biew17], have elaborated about data migrations as a project activity and possible approaches of adoption. This article will provide insight into typical challenges we see when working on migration related projects at clients. We will also provide a high-level overview on how to overcome them.

Challenges encountered

Typical challenges that occur during migrations, which should be properly managed to avoid a failing migration, are summarized below:

  1. Underestimation of the migration; leading to unavailability of resources and insufficient detailing of the migration process. Data migrations are always complex in their nature, underestimation could result in a migration that is not timely performed or not properly tested.
  2. Insufficient analysis of the required conversion scope, data cleansing and data mapping. This could result in a migration that does not suit the expectations and/or business processes of the organization.
  3. Scattered landscape with different (external) parties that are involved during the migration. Where different parties are responsible for separate migration activities, the risk emerges that activities are not aligned and not performed appropriately.
  4. Custom built tooling that is developed in order to migrate the data. Software that is tailor-made for a migration could contain programming errors causing completeness and/or accuracy issues during migration.
  5. Poor data quality that is not identified. For instance due to an incomplete oversight of the project team or dummy data to facilitate ‘workarounds’ in the current application.
  6. Insufficient knowledge of the source system and its underlying database tables, leading to challenges in exporting the relevant data and/or ways to perform reconciliation.
  7. Insufficient testing activities leading to the situation that completeness and/or accurateness issues are not identified and cause issues in the execution of the business processes. For instance: a visual inspection of only 25 samples on a total dataset of 3500. Another example is testing with data that does not represent the production data; in this case the results will not reflect the actual situation in the production environment.
  8. An insufficient cut-over plan to cater for a solid migration and transfer to the destination system. A solid cut-over plan is crucial to guide the project members in this phase, especially when for test purposes the new environment is synchronized with the legacy system for a limited period of time.
  9. Lack of acceptance criteria that provide the thresholds for a successful migration. This situation would hinder the final acceptance decision, making since migrations typically result in a certain amount of deficiencies. The acceptance criteria should guide management in determining whether the set of deficiencies, and their characteristics, is blocking the acceptance.
  10. The documentation of the conversion is insufficient to provide insight into the migration and the activities that were performed to validate the completeness and accuracy. Certain documentation is crucial for several purposes, such as internal analysis afterwards and external audits.

Further, we have selected three cases to provide detailed insight into the main challenges our clients faced, and the approach to tackle them.

Three cases

Organization A – Custom built tooling and unclear migration requirements

Organization A has implemented a new solution for managing their clients and the services that are provided to these clients. Properly migrating the client and service data was crucial to continue the business processes and to properly invoice clients. However, the technical means to execute the migration are not available in the market. In order to technically realize the migration, a technical specialist was introduced to build a tailor-made script to download the data from the legacy system, convert it and populate the new environment.

Further, the project was under great time pressure to perform the migration and to deliver the new functionality. This landscape resulted in the following main challenges:

  • Due to the lack of a (standard) solution to migrate the data, a custom built migration tool was necessary; bringing major risks of errors caused by flaws in the software code and scripts.
  • Parameters of the migration, such as scope and data mapping, initially were not completely and not sufficiently defined due to the lack of knowledge in the organization and due to a time-restricted project.
An iterative approach

Based on the time aspect it might be tempting to start playing with the migration tooling and to simply populate the new system. Instead, we adopted an iterative approach where all aspects of the migration were refined during different cycles, in order to reach the situation where a complete and correct migration could be performed. This iterative approach also added to the view of the organization regarding their requirements and expectations of the migration.

The cycle started by defining and refining the migration parameters (e.g. scope, renumbering, data mapping, etc). These parameters are input for both the custom built migration tool, as well as input for the review of the migration results. A plan to review the outcomes of the migration was developed, and refined per cycle, to guide the review activities.

Since the migration was performed by means of custom built tooling, it was crucial to track the risk of possible errors in the software and scripts. In response, we were able to obtain independent data reports from both the legacy and new environments as input for a data comparison. Any errors, caused by flaws in the migration script, could be identified by means of this comparison.

The independency aspect of the review, for instance the selection of (independent) sources for the data analyses, is crucial to perform a proper review.

Elements of the migration scope that could not (easily) be reviewed by means of data analyses, for instance due to complex restructuring of specific data fields, were visually inspected.

After a mock migration in the test environment, the reviews were performed to validate the completeness and integrity of the migration. The results of the migration and the (independent) data comparison were presented to the project and relevant stakeholders from the organization. This final step led to valuable insights that were input for the next cycle and a further refinement of the migration.

These steps are visualized in Figure 1.

C-2017-3-Vermunt-01-klein

Figure 1. An iterative approach. [Click on the image for a larger image]

Organization B – Multiple external service providers and unclear data structuring

Organization B has replaced its HR software suite used to support the typical HR processes and payroll. In the meantime a new payroll service provider was selected and introduced.

While helping this organization in coordinating the migration stream we encountered the following main challenges:

  • Several different external service providers were responsible for different parts of the migration; among which the software vendor, technical migration party and other intermediate parties. This scattered landscape resulted in a risk of different views on the migration and a lack of transparency on the tasks and responsibilities of each party.
  • Lack of knowledge regarding the data structuring in the legacy system. Main reasons were inappropriate maintenance of data by different stakeholders and data that was entered in order to facilitate workarounds in the old software solution.
A test strategy that fits the environment

During the commencement of the migration stream we performed inquiries to grasp the quality of the data and the possible need for activities to cleanse or enrich the data. In practice this proved to be challenging, since in this case the data is being managed by different (internal and external) stakeholders. In general, it proves hard to make data quality issues explicit, mainly because people are used to working with the data as it is available. This therefore blocks an objective view of the data itself. This effect is enhanced in the case that external parties are responsible for the maintenance of the data.

In order to test the results of the migration, and to reveal possible data quality issues, we developed a test strategy consisting of different components:

  • Where possible, data objects (such as employee master data) were validated on completeness and accurateness by means of a data analysis. The data analyses used (standard) reports from both legacy and destination environments to provide an overview of the data, such as all employees and their details. These reports were used to automatically compare the complete data sets and easily identify issues.
  • Data objects for which a data analysis was not possible were validated by means of visual inspection. For a sample of the data set, in this case approximately 10%, these values were manually compared.
  • A sample of pro forma pay slips were generated in the destination system, in order to compare the previous pay slips in the source system.

The comparison of the pay slips resulted in insights into poor data quality that caused incorrect pro forma pay slip generation in the new environment. Only after detailed analysis did we learn that specific values were suppressed by the old system as part of a workaround, however, after the migration, the workarounds were reinstated in the new environment and included on the pay slips.

This situation also proves that a migration can be formally performed completely and accurately, however, can still result in a situation that is inappropriate for the organization.

The large number of stakeholders that is involved in the migration calls for strong project leadership. All parties should be aligned beforehand on the data objects to be migrated, but especially during the resolution of the findings that are identified as part of the migration review. In this case, frequent discussions and alignment on the findings between stakeholders fostered an approach to discuss findings and to develop an appropriate mitigation plan.

Organization C – Independency issues and an inappropriate test file

Organization C has replaced their asset management software solution. This solution is used, among others, to manage physical assets, invoicing and the financial administration. As part of this project, a migration was planned in order to migrate all assets and the elements within the realm of financial administration.

Our analysis of their migration approach revealed, among others, the following:

  • The project leaned on the (technical) implementation partner when it came to defining the migration and its review. In particular, the review plan was not independently scrutinized by the project.
  • The migration file lacked elementary insights into the approach of the migration and the strategy that was used to validate the migration outcomes. A migration file is an essential element for the acceptance of the migration by the steering committee or to provide the required insights into the external accountant.
An independent migration approach is essential

Both the migration and the related test strategy were prepared by the implementation partner. However, the various parameters that are relevant for the migration were discussed in the project and documented; in essence, this provides a conflict in the segregation of duties, resulting in the lack of an independent and critical view on the migration and the review activities.

In this case, we noted that the implementation partner only defined tests to validate the completeness of the migration, whereas solid tests to confirm the accuracy were not included in the strategy.

In response, the organization added additional accuracy tests to validate the migration, such as:

  • data analysis to validate critical fields, such as BSN numbers;
  • calculation of hash totals on critical fields, for example the total consisting of the bank account numbers multiplied by the creditor ID.

Further, we noticed gaps in the documentation of the migration. An example is the data mapping, consisting of the data objects to be migrated, which was not fully documented; the results of the migration tests were also not (completely) available.

A solid documentation of the entire migration process and results of the tests is crucial to trace back the execution, review and decision making with regard to the migration; especially when differences are identified afterwards or in order to prove to the external accountant that appropriate steps were taken to perform a solid migration. Also, the file can be the means to easily provide insight to IT auditors into the measures that were adopted to mitigate the risks associated with the migration.

In response, the organization confirmed that, at least, the elementary aspects of the migration are properly documented, consisting of:

  • the migration scope and data mapping;
  • the tooling used to perform the migration;
  • the strategy to test the completeness and accuracy of the migration;
  • all findings that were identified during the migration review, including the resolution and the result of the re-test after the findings were resolved.

Conclusion

Data migrations have been present ever since IT solutions were introduced and extensive research has been performed in order to further optimize the migration approach. Nevertheless the data migration phase remains an activity with many challenges which, to be avoided, require appropriate attention. By means of this article we have attempted to provide insight into the main areas of attention that need to be managed by the project in order to avoid a failing migration.

Reference

[Biew17] A. Biewenga and R. Akça, ERP Data Migration: Migration of transactions or tables?, Compact 2017/1.

Horizontal Monitoring

KPMG is involved in the introduction of Horizontal Monitoring in hospitals and KPMG also issues assurance reports. This means that serious work is being done on the internal control of hospitals in order to meet the operational requirements. This does not only mean process improvement, but also improvement in the management and use of IT. In this article we explain what Horizontal Monitoring is, and in particular what role IT plays in it and what challenges hospitals are faced with.

Introduction

In the recent past the relationship between Dutch healthcare insurance providers and Dutch hospitals was not based on trust, and it still isn’t. Health insurance companies were checking and reviewing hospital care invoices, resulting in a lot of corrections. And, if that was not enough, a large number of these correction tasks had to be executed manually adding up to the administrative work load of the hospital. The insurer was, in turn, again strictly controlled by the Dutch Healthcare Authority (Nederlandse Zorgautoriteit). The accountability that the insurer had to provide to this authority forms the basis for the strict controls they imposed on the hospitals.

This situation did not benefit the relationship between the hospitals and health insurance companies, causing a lot of frustration and distrust. The Horizontal Monitoring project was set up in order to improve this relationship. The concept of Horizontal Monitoring was introduced in the healthcare sector1 in 2016, primarily for medical specialist care (MSC). It is an initiative of three parties: Nederlandse Vereniging van Ziekenhuizen (NVZ, Dutch Association of Hospitals), Zorgverzekeraars Nederland (ZN, Association of Dutch Health Insurers), and Nederlandse Federatie van Universitair medische centra (NFU, Dutch Federation for University Medical Centers).

The slogan on the official website of Horizontal Monitoring reads: ‘Horizontal Monitoring focuses on the legitimacy of care expenses within medical specialist care. This concerns registering and declaring correctly on the one hand, and the appropriate use of care on the other.’2 The text emphasizes the most important issues that health insurance companies are facing, namely: legitimacy of the invoices and the appropriateness of care. Legitimacy is complicated due to a lot of very specific and detailed rules to which hospitals have to comply. Therefore, within the framework of Horizontal Monitoring, the hospitals are challenged to invoice correctly, which in its turn should lead to fewer controls from the health insurance provider. Additionally a trusted third party is there to issue an assurance report ISAE 3000, that would confirm the measures (all included in a so called control framework) taken by the hospital to mitigate the risks and achieve correct invoicing. This would provide the healthcare insurance provider comfort in order to reduce the usual and necessary checks and reviews.

In this article we would like to shed some light on the concept of Horizontal Monitoring in healthcare, what it has to offer in the day to day practice and, within this concept, what challenges the participating hospitals will face in the area of IT.

Horizontal Monitoring practice

Horizontal Monitoring is not a new concept in the Netherlands. It has already been used for the tax billing process. The basis for Horizontal Monitoring is mutual trust. Cooperation is the key word within the concept of Tax Horizontal Monitoring. By making arrangements between the tax authority and a company, that is the company involved in the reporting process, an improved quality of the tax returns can be maintained and improved. This will prevent unnecessary additional work. Naturally, transparency plays an important role within Horizontal Monitoring. Horizontal Monitoring in health is different, because a hospital makes arrangements with multiple authorities instead of just one (health care insurance provider).

The scope of Horizontal Monitoring is legitimacy. The legitimacy of medical expenses consists of correct registration and billing, and effective care and medical necessity.

Legitimacy is based on three principles:

  1. ensure proper spending of current and future healthcare expenditures;
  2. give account of the social responsibility of these expenses;
  3. provide certainty about these expenses to all chain parties in an efficient, effective and timely manner.

The concept of correct registration and invoicing is a straightforward concept, which is covered by controls put in place by hospitals in order to prevent incorrect invoices to the healthcare insurance provider. The use of a specific set of controls makes it clear and testable.

The effective care and proper use on the other hand has more ambiguous characteristics, and is therefore more challenging to test. For instance, a Diagnosis Treatment Combination (DBC) contains a set of painkillers. Sometimes the patient does not need these (e.g. no pain), but receives them anyway, since it is being covered by the health insurance provider. The prescription for painkillers is unnecessary and hence not appropriate. But to detect and make a ruling of such cases takes time and effort.

DBC

DBC stands for Diagnosis Treatment Combination. A DBC is a care package with information about the diagnosis and treatment that the patient is receiving. In the hospital care and geriatric revalidation care the DBC is also being called a DBC-care product.

Another example of proper use of healthcare is an early discharge of patients after a clinical operation with the use of proper nursing support at home. This form of care is much cheaper than care in hospital.

Due to the presented complexity of the appropriate usage a growth model will apply in the coming years. Starting from 2020 the control framework of ‘appropriate usage’ will be ready as a part of Horizontal Monitoring. During this period the elements of the appropriate usage will be added to the control framework.

Contractual agreements, such as agreements about the quality of the delivered medical care, fall outside the scope of the Horizontal Monitoring, at least for now.

C-2017-3-Tsjapanova-01-klein

Figure 1. The scope of Horizontal Monitoring. [Click on the image for a larger image]

In 2016 a pilot was started with a few hospitals and healthcare insurance providers to implement Horizontal Monitoring. In 2016 and early 2017 two of the pioneering hospitals worked closely with KPMG on the evaluation of their control framework. Together the healthcare insurance providers, KPMG and these pioneering hospitals have carried out extensive work to delve into the control framework evaluation. A specially dedicated working group for Horizontal Monitoring was initiated on the national level, in which obstacles and nuances were discussed, and agreements were made appropriately. The pilot resulted in an assurance report type I (design of the control framework) for these two hospitals. At this time, these two hospitals are in phase two, to put in place the type II assurance report on the operational working of the controls. The other pilot hospitals will follow later.

Benefits of Horizontal Monitoring

Once Horizontal Monitoring has been properly implemented, it results in major benefits for the involved parties. Firstly and most importantly, the relationship between the hospitals and healthcare insurance providers will be improved, which should be the basis for a higher level of trust. These two parties will be able to work together towards the solutions, instead of finger pointing (principle one of Horizontal Monitoring is after all well-founded trust).

C-2017-3-Tsjapanova-02-klein

Figure 2. Ten principles of Horizontal Monitoring. [Click on the image for a larger image]

Secondly, the healthcare insurance providers will withdraw controls on the invoices submitted by the hospitals, resulting savings in resources due to a lower control load.

Thirdly, for the hospitals, the discussion with the healthcare insurance providers about the correctness of the invoices will become easier because less errors will be made. This way they can focus on improving the process of registration and invoicing, preventing the possibility of incorrect registration even further. This means achieving the first-time-right registration.

Fourthly, another benefit of Horizontal Monitoring is that the internal processes and mainly process inefficiencies are becoming more visible to the hospitals. That means that there is room for improvement and the use of more automated controls instead of manual ones.

A lot of the manual controls can be automated and even be executed in real time mode, slowly but surely shifting the focus from detecting registration and billing errors to improving the registration process. Hospitals can implement projects that will contribute to improving the registration process. This will further contribute to the first-time-right registration, correct registration at the source, and well-managed IT systems and solutions.

Finally, when Horizontal Monitoring is completely settled, less monitoring will be required. The healthcare insurance providers might settle for a looser form of assurance, depending on the policies and agreements they made with the national supervisory authority.

The starting point for hospitals to achieve these benefits is admitting and facing the fact that real cultural and organizational changes are necessary to ensure correct and complete registration (first time right).

Horizontal Monitoring challenges

An assurance report from an independent auditor is more than merely testing the risks and control measures that the hospitals and insurance companies agreed upon, the reliance on IT becomes crucial, hence the topic of IT.

In order to address the different topics in Horizontal Monitoring, a so called entry model was introduced. The function of this model is that in order for a hospital to participate in Horizontal Monitoring, a certain level of organizational maturity and internal control should reached. Based on the COBIT and COSO principles, the Horizontal Monitoring entry model provides a 5-level3 scoring system on topics such as strategy, enterprise stakeholders, soft controls, and the General IT Controls (GITCs). The hospital should score at least a level ‘3’ (on average), with no score of ‘1’ on any of the topics, in order to be able to enter the Horizontal Monitoring process with the healthcare insurance provider.

A lot of the control measures within the process of registration and invoicing can either be manual or automated. When speaking of the automated controls, the role of the IT components becomes very important. On the one hand the automated controls are time and manpower saving, but on the other the GITCs should provide a certain level of control in order to be able to rely on these automated control measures.

Challenges

One of the challenges that hospitals are facing is being in control of IT, there where the current state of IT maturity in hospitals is rather low. Therefore, a lot of processes and tasks are executed manually or rely on many manual actions in processes.

In the next section we will focus on the parties that can play an important role in helping the hospitals to achieve a higher level of IT maturity.

The cast of Horizontal Monitoring

In this section we will name the actors in Horizontal Monitoring and their roles within Horizontal Monitoring. So far we have already introduced insurance companies and hospitals. Along with these parties we also have the auditors and the software providers. We will elaborate on each of them separately.

Auditors

As described above the management of a hospital is responsible for the correct, complete and timely registration and billing of the delivered care. The risks that have to be considered, must be mitigated by adequate control measures (first and second line of defence). The management will then be able to declare to the medical insurance companies that they have set up the system of control measures adequately and that it also functions as such, and that in this way the risks are under control. The first role of an external auditor is therefore to carry out the earlier mentioned assurance investigation on this system of internal control measures, so that additional security is provided to the medical insurance company.

Furthermore there is a possibility where a hospital has a so-called ‘third line of defence’. This line of defence is usually carried out by an Internal Audit Department (IAD) or a special Internal Control Department (ICD). An external auditor can then still carry out an assurance investigation, for which the character of his activities will be different, because they then focus more on the execution of the work activities of this ‘third line of defence’.

A third role that can be carried out by the auditor lies closer to that of advisor, for which the auditor can support the hospitals with the effective structuring of the system of internal control measures for Horizontal Monitoring. In particular, the IT Auditor can offer added value by recognizing and structuring more automated control measures (application controls).

Software providers

Currently we see that the software suppliers of the ZIS-EPDs (electronic patient record system) do not program their software solutions in an explicit and structured manner with specific automated control measures focused on covering the risks within Horizontal Monitoring. This terrain is still undeveloped. There is no common national framework in which the various automated control measures are included. Therefore, it is understandable that the software developers do not exactly know which application controls they should develop.

If we want to help the hospitals reduce the pressure of internal controls, particularly with the implementation of Horizontal Monitoring, there will have to be a broadly supported framework containing the maximum possible set of automated control measures. So implementing this in the registration and billing processes at the hospitals automatically contributes to the ‘first time right’ principle, because incorrect registrations are hardly possible anymore.

There is an important role here for software developers to program these automated controls that support the control framework, but there is also a clear task for the IT Auditors (NOREA) to develop a broadly supported management framework that serves as a foundation for the software developers. This still to be developed framework can then be the basis for a quality mark that software developers can achieve if they have incorporated automated control measures for Horizontal Monitoring.

The improvements in IT

When there is a more efficient relationship between automated and manual controls at hospitals, the question concerning the quality of IT General Controls becomes even more important. The correct functioning of the IT general controls is of course a condition for the reliable operation of these automated measures. As we have already mentioned above, most hospitals will have to make improvements in this area.

So, have we achieved this with Horizontal Monitoring? In our opinion the answer is ‘no’. The next step certainly lies in improving the system of internal control measures, making use of more automated controls. In addition, developments in IT will influence Horizontal Monitoring.

Future developments

We also expect that new IT technologies (robotics, eHealth etc.) will play a role. There are currently ongoing ‘proof of concepts’ during which intelligent and learning software (machine learning) scan the EDPs via ‘text mining’, and on the basis of all this data independently derive the diagnosis and the provided care. The first tests are promising, and the time when the quality of this is better than the manual registrations by the care professional is close at hand. This is good news, because the care professional must provide ‘care’. We then leave the management to robots. If this improves the quality of registration and billing and reduces the time that professionals spend on administrative tasks, then nobody can be against this. Horizontal Monitoring can then be seen in a new light with these future perspectives.

Conclusion

Horizontal Monitoring is and will remain a challenge. At this moment the involved parties are struggling to state whether Horizontal Monitoring is a blessing or a curse. However, once this stage is over, they will benefit greatly from this project.

A few citations of Henry Ford

‘Don’t find fault, find remedy.”

Right now the main goal is to prevent the risks for errors, but eventually it should be improving the process to attain better risk prevention.

‘Quality means doing right when no one is looking.’

Eventually when the hospitals and the healthcare insurance providers have stabilized the Horizontal Monitoring path, the hospitals will be able to process the correct registration and billing on their own, reducing the need for constant monitoring and opening the door for improvement.

Notes

  1. Further in the text we only talk about the Horizontal Monitoring in healthcare.
  2. The quote is translated from www.horizontaaltoezichtzorg.nl.
  3. The categories are from one to five: 1) initial; 2) informal; 3) standardized; 4) controlled; 5) optimized.

SAP S/4HANA and key risk management components and considerations

To respond to the trend of ‘digital enterprises’, SAP has developed in recent years a complete new SAP platform called SAP S/4HANA. SAP S/4HANA is positioned as the digital core of the so called ‘digital enterprise’ and the strategic way forward for organizations with an existing SAP landscape. SAP S/4HANA will become the de facto standard in the upcoming years as the current SAP systems will run out of support. The main question therefore is not ‘if’, but ‘when’ and ‘how’ the move to SAP S/4HANA takes place. This article provides insights into key risk management components and considerations for the SAP Business Suite on HANA migration projects and SAP S/4HANA migration projects. When talking about SAP S/4HANA, we focus on the on-premise solution of S/4HANA Finance.

Introduction

The increasing wealth of information is one of today’s key challenges for a company. Recent surveys show that powerful intelligence is vital for successful companies. Applying this intelligence will enable companies to assess new markets, improve performance and reshape the enterprise’s strategic business needs.

To respond to the trend of so called ‘digital enterprises’, SAP has developed in recent years a complete new SAP platform called SAP S/4HANA. SAP S/4HANA is positioned as the digital core of the ‘digital enterprise’ and the strategic way forward for organizations with an existing SAP landscape. SAP S/4HANA will become the de facto standard in the upcoming years as the current SAP systems will run out of support. The main question therefore is not ‘if’, but ‘when’ and ‘how’ the move to SAP S/4HANA takes place.

SAP S/4HANA will form the new SAP core for the coming decades. It aims to respond to the challenges of organizations by providing 1) improved reporting functionality (agility and speed), and 2) enhanced process efficiency (e.g. a more rapid monthly closing process, improved user experience). The performance provided by the in-memory HANA database combined with the enhanced user experience (called Fiori), provides organizations with an improved way of doing business: it is now possible to combine analyses of real-time data with transactional processing on device-independent apps.

The S/4HANA Finance module is part of SAP S/4HANA and is the latest solution for the CFO office. It provides support in several finance areas as part of an integrated ERP environment: financial planning and analysis, accounting and period close, treasury and financial risk management, collaborative finance operations and enterprise risk and compliance management. Apart from the functional benefits it also requires 3) less maintenance and development due to a simplified data model, and 4) your IT landscape is primed for planned SAP innovations.

In order to fully leverage these benefits, more than just a technical solution is needed. Although SAP provides the IT elements for the solution, it is up to the organizations to prepare and organize the department and processes in such a way that the new functionality is fully utilized. For example, organizational strategy cascades into reporting requirements, which in turn should be determining factors in the design of the financial administration; processes should be standardized, harmonized and free of all superfluous complexity.

This article provides insights into key risk management components and considerations for the SAP Business Suite on HANA migration projects and SAP S/4HANA migration projects.

In this article, when talking about SAP S/4HANA, we focus on the on-premise solution of S/4HANA Finance, based on the experience gained by the authors.

SAP S/4HANA risk management

As companies using SAP need to move sooner or later to SAP S/4HANA, there will be many SAP (re)implementation programs started. These SAP programs have the reputation of being challenging, as many programs are not delivering the expected value or are not completed within time and budget. It is therefore very important that mature risk management procedures are in place as this will help to ensure early identification and appropriate mitigation of project risks. Typical examples of risk management activities are:

  • Program Governance and Risks. Providing updates on risks and issues identified during assessments of the process, performance and deliverables associated with program/project governance. Conducting risk workshops with the various stakeholders involved to have an integrated overview of all the risks. Reviewing formally defined go-live go/no-go criteria and the plans to establish Operational Readiness pre go-live before the hand-over to operations.
  • Business Processes and Testing. Determining whether the testing approach covers the validation of the current business processes, including the current application controls to support complete and accurate financial reporting after go-live. Topics to specifically focus on are whether the new functionalities offered by SAP S/4HANA are considered and implemented in the new ways of working. Examples are the new GR/IR cockpit, new HANA transactions, new reporting capabilities etc.
  • HANA Infrastructure. New technology and hardware need to be in place within the data centers to be able to operate the new SAP S/4HANA systems. It is important to provide feedback on the mechanisms in place to achieve compliance, control and security over the new or updated data centers; the SAP landscape infrastructure service model and the specific HANA architecture.
  • Data Migration and Reconciliation. Many organizations have a defragmented SAP landscape. These organizations are using SAP S/4HANA to also consolidate and simplify their landscape. This results in complex migration projects which makes it important to assess data migration related risks. Examples are assessing the data migration software tools and the controls critical for data integrity, e.g. data and object consistency and completeness, which are implemented to mitigate both financial and operational risks. Monitor data migration and reconciliation procedures. Understand proposed housekeeping activities and make recommendations as necessary. Re-perform a selection of reports relevant for financial statement audit purposes.
  • General IT Controls. SAP S/4HANA introduces new technology and operating procedures and it is therefore important to assess general IT controls. Backup and restore processes are changed, change management processes are impacted by the faster SAP release strategy and the changed SAP platform has an impact on how interfaces are integrated.

Client case

One of our clients is performing a global SAP S/4HANA migration program and KPMG is performing a quality assurance role where we ‘walk along’ with the program. Several risk management workshops have been conducted together with the main program stakeholders and workstream leads.

The following main risk areas have been identified and these are controlled by the following mitigation activities:

  1. Risk of program delays to go-live date due to a too ambitious project approach and other parallel competing priorities. An integrated program and resource planning has been established and monitored on a weekly basis.
  2. Risk of insufficient scoping of performance load and stress testing cycles. Multiple additional performance test cycles needed to be introduced including a dedicated performance test environment.
  3. Risk of having one cycle for data migration and reconciliation activities and thus a right first time approach. Clear exit criteria were defined and monitored.
  4. Risk of system degradations after go-live due to having executed test cycles on a non-production like environment. As a formal cutover activity the difference between the system settings were analyzed e.g. parameter checks.
  5. Risk of system degradations due to (not) using the latest HANA optimized transactions. As part of the performance unit test (PUT) cycle, the most used transactions are tested on their performance.
  6. Risk of compromised stability and performance caused by custom code. A dedicated assembly line has reviewed and analyzed the code and has remediated the findings.
  7. Risk of not having sufficient time to incorporate data migration and reconciliation experience in preproduction test cycle, fixes need to be right first time for production. Conduct formal lessons learned sessions after each cycle to understand root causes.
  8. Risk that there are no watertight retrofit processes resulting in functional changes or system differences (e.g. dependent projects, missing transports, test incidents). A full analysis of all transports (and their sequence) is part of the formal signoff before go-live.
  9. CPU intensive transactions or long running background jobs cause unwanted side effects. Detailed analysis of all the planned jobs that are not relevant within the new S/4HANA environment.
  10. Risk of security breaches due to the insufficient hardening of the (non-compliant) security baseline. Due to the new SAP S/4HANA architecture the security baseline and implementation requires special attention within the project.

The next section in this article focuses on the security, compliance and internal control aspects which come into play with S/4HANA as these aspects require different type of attention compared to a classic three-tier architecture.

Security, compliance and internal control

The classic three-tier architectural approach with distinct layers – data presentation, processing and storage – undergoes major changes with the introduction of SAP HANA database technology. In the classic three-tier architecture, the database layer was only accessible via ECC (the processing/application layer). In the S/4HANA solution, the database layer is extended with application functionality, which allows processing of large volumes of data without its retrieval to the application layer, as well as preparation of results that can be displayed on back-end devices such as mobile phones or tablets (i.e. Fiori Apps). This innovation led to the following architectural and use case modifications on the database layer:

  • increased number of database interfaces (SAP Landscape Transformation Replication Server (SLT), Fiori, SAP Data Services (BODS), SAP Solution Manager etc.);
  • potential direct access of business users to the S/4HANA data layer (native HANA);
  • access to all/sensitive information in real time;
  • increased number of users and, in particular, user groups (business users, developers etc.);
  • business logic is developed and executed directly on the data layer (due to the delegation of data intensive operations to a database);
  • increased number of use cases (analytics on ERP, mobile apps, etc.).

These changes have an even more significant impact on security with the implementation of S/4HANA as they apply to the database as well as the application layer. Based on our insights, we recommend paying special attention to the following security and compliance areas during S/4HANA design and implementation projects:

  • strengthening database access controls: avoid unauthorized access to sensitive data and unauthorized or erroneous changes to program code;
  • hardening of interfaces: harden HANA interfaces to prevent any unauthorized access to sensitive data of other systems;
  • defining HANA security baseline: define security baselines for the HANA platform (database and operating system) and HANA web-application server;
  • securing transport management: secure the S/4HANA transport management of HANA views and Fiori Apps to avoid any unauthorized or erroneous changes to program code;
  • revision and adaption of a Segregation of Duties (SoD) model: exclude potential violations and conflicts across systems and processes caused by new HANA transactions and Fiori Apps;
  • adjustment of internal controls: revise the control framework by eliminating redundant controls (e.g. reconciliation as data is ‘reconciled by design’) and adding new controls (e.g. authorization control on new transaction codes);
  • defining secure custom code: define and implement secure development standards for custom code (ABAP and HANA).

Our experience shows that apart from the implications of the S/4HANA implementation on security, many companies still do not consider SAP security with an appropriate sense of complexity and criticality. A broader, holistic approach to addressing the related challenges is imperative. This is depicted in Figure 1. It is important to focus on the protection of all components within the core business process and not just those of the SAP system as such. Furthermore, special attention should be paid to the potential for attacks using the infected workplaces of employees.

C-2017-3-Roest-01-klein

Figure 1. Important security and compliance areas with regard to S/4HANA Finance. [Click on the image for a larger image]

Beside security-related aspects that accompany the new technology, S/4HANA involves considerable changes on the functional side, which should be taken into consideration from a compliance and internal controls point of view.

An example of the impact on the control environment caused by the simplification of the data model is the integration of sub ledgers into the main ledger. This makes certain error check reports redundant (i.e. the consistency checks in accounting and controlling), which is currently a key control within the finance procedures. Another example is the real-time asset depreciation functionality of S/4HANA Finance, which replaces the traditional batch job-based approach and requires adjustments to related user controls and procedures.

SAP S/4HANA involves new transactions, while certain other transaction codes become obsolete. For example, maintenance of credit account master data is done using a new transaction UKM_BP, which replaces transaction FD32. In some cases pre-existing transactions are replaced and in other cases some new – HANA-optimized – transactions are introduced. This in parallel to the existing transactions, which remain available to be backwards compatible. All these changes make it necessary to review the new possibilities of SAP S/4HANA and its transactions and adjust the existing SAP authorization model accordingly.

Data model and reporting

1. Single source of truth – overcoming the challenges of the SAP ECC data model

In previous SAP solutions and in other ERP packages, the architecture is based on multiple sources of the truth. For example, entries are made into different ledgers, requiring numerous reconciliation activities across individual fiscal years. Within SAP ECC, the material ledger is not able to store G/L accounts or profit centers, while within asset accounting there is no profit center or G/L account information available in the Asset Accounting (AA) totals table. These are examples that require organizations to reconcile their material ledgers and asset accounting with their general ledgers. Reconciliation work was also required to reconcile CO (Controlling) data with the general ledger, and to reconcile CO-PA (Profitability Analysis) data with the general ledger, as the general ledger and the profitability tables were updated based on different business events in different entities (e.g. accounts).

To handle potential performance issues on retrieving data from SAP ECC, data was stored in various levels of detail and in differently structured components. Hence multiple BI extractors were required to cover the complete set for reporting purposes.

S/4HANA Finance overcomes these challenges through SAP’s introduction of the Universal Journal (see Figure 2). This Universal Journal is the single source of truth for all sub-ledgers as this journal has one line item table with complete details for all components. Data from G/L, CO-PA, CO, AA and ML is all stored in the Universal Journal. Hence, the data is stored once and therefore no reconciliation by architecture type is required.

C-2017-3-Roest-02

Figure 2. Universal Journal.

2. Simplification for reporting

The new data model offers the possibility of fast multi-dimensional reporting based on this single source of truth. If an organization has a BI system, one single extractor is sufficient. All actual postings are registered in the same table, with the available dimensions as part of the same table. This simplifies the creation of data cubes.

SAP ECC’s aggregate tables have been replaced by compatibility views. Compatibility views are non-materialized views which means that the data is not stored in tables; in fact it is not stored at all. With the high calculation power of HANA, the views are calculated instantly when a report is called up by an end-user. These compatibility views do not disrupt the business or reporting processes. However, in cases of custom developments (such as custom ABAP queries), the performance may be affected where ABAP queries are intended to write data back into aggregate tables, as this is technically no longer possible with views. The consequence is that developments tailored to your organization either need to be removed or developed in a different manner.

From a compatibility perspective, SAP still provides the same reporting functionality in S/4HANA Finance as in SAP ECC. When combined with the power of the HANA database, the performance and reporting of transaction postings can drastically improve.

3. Reduced data footprint

As several sub-ledgers have been integrated into the single ledger (i.e. Universal Journal), data redundancy is eliminated and the data footprint is reduced. In addition to this integration, several SAP ECC tables (totals tables, index tables) have also been removed. In SAP ECC, the function of these tables was to improve performance, a requirement now met by the HANA database. The changes in the data model are depicted in Figure 3.

C-2017-3-Roest-03-klein

Figure 3. Revised data model. [Click on the image for a larger image]

An example regarding the reduction of the data footprint and its complexity: previously a vendor invoice with three accounting line items required more than 10 database tables to be updated more than 15 times, whereas with the new architecture potentially just four database tables need to be updated five times.

As mentioned above, some indexing and aggregate tables will no longer be used, e.g. FAGLFLEXA (line items for new G/L), and ANEP (line items for fixed assets); BSIS (index for G/L accounts) and BSID (index for customers); GLT0 (G/L totals) and LFC1 (vendor master transaction figures totals). The COEP (cost line items) table no longer contains all actual secondary postings, as these are now stored in the Universal Journal (table: ACDOCA). However, the COEP table does still exist, for statistical secondary postings. The result is less redundancy in data storage and unification of the data point in the Universal Journal.

For the G/L accounts master data on the chart of accounts level (table SKA1), there is one other change: this table is enhanced with a new field: ‘G/L account type’ (field: GLACCOUNT_TYPE). This means that cost elements are not managed as different objects compared to G/L accounts, i.e. cost elements are managed as G/L accounts in S/4HANA Finance.

The ACDOCA table is used for line items, therefore the BKPF (document header table) is still used to store financial transaction header data. The BSEG table (document line items) is not replaced by ACDOCA; this table will be used for line items for financial transactions.

Enabled by HANA database technology, the simplified data model and table structure of S/4HANA Finance will reduce data storage and maintenance requirements, and improve data consistency.

How to migrate to this simplified data model and how to assure data is migrated/converted correctly is explained in the next section in this article.

Data migration and reconciliation

When assessing the possibilities for migrating from the existing SAP landscape towards a Business Suite on HANA and/or S/4HANA several migration scenarios are possible. We see the following two scenarios currently being used:

  • new implementation (greenfield implementation);
  • landscape transformation (brownfield implementation).

New implementation – Greenfield approach

The first scenario is one in which SAP S/4HANA Finance is installed from scratch and the existing ERP instances are migrated to this single instance with S/4HANA Finance. This will give organizations the opportunity to optimize business processes, data and organizational structures.

Landscape transformation – Brownfield approach

In a brownfield scenario, one existing SAP ERP instance is upgraded to S/4HANA Finance on HANA and the other instances are migrated to this S/4HANA Finance on the HANA platform. The main benefit of this scenario is the opportunity to leverage the existing system which reduces implementation time (compared to a greenfield scenario). Furthermore, it retains the advantages of the greenfield implementation with the exception of the opportunity to improve current business processes, organizational structure and data.

Each migration scenario has its own challenges and characteristics. Regardless of the scenario which is applicable to you, it is of vital importance that the converted/migrated data is accurate, complete and that the data migration and reconciliation activities are performed in a controlled manner.

Below, we have outlined several key focus areas when choosing or coping with a migration scenario.

  • As part of building a business case, as well as anticipating organizational complexity and follow-up (change for the organization or custom development), an analysis of the current operating model is advised. This includes current business processes and the use of ERP, including inefficiencies, pain areas and custom developments.
  • When S/4HANA is installed, it is installed on a system level and not on a client level. Hence, after its installation, it is not possible to post documents within the whole system (development, test, etc.) until the migration is finalized. After the S/4HANA On-Premise edition is installed, a migration is required for each client as part of the system. This means a separate migration for development, test, quality assurance (if applicable) and production clients.
  • The add-on which is installed includes a S/4HANA migration cockpit. This cockpit guides you in several steps through the simple finance conversion. The steps include both checks and actual migration steps. Depending on the data quality and consistency, success, error or warning messages are displayed which could require further actions (e.g. housekeeping and data cleansing).
  • Migration can take place at any time, with the only requirement being that the latest period-end close is finalized. Based on closing calendars, this means migration is executed at the end of any month, i.e. there is no requirement to migrate at the end of fiscal years as would be the case for a migration to New G/L.
  • Performing several migration cycles in test systems is key to testing the migration approach, familiarizing the team with the procedural steps and identifying any required cleansing and housekeeping activities. Please note that the quality of testing is mainly driven by the data quality of the test dataset. It is recommended that at least one of the test systems is based on production data (quality and volume wise).
  • It is difficult to provide guidelines on migration throughput times. This depends on many factors such as database size, number of systems, number of clients, complexity of data, etc. An essential part of the total migration throughput time is the business outage that is required in order to migrate to S/4HANA. This business outage is mainly affected by the total data volume of the migrated dataset. In theory, the business outage duration is likely to increase when the total data volume increases. From a costing perspective, an extension of business outage may result in higher costs due to an increase of idle time. A possible solution to limit the business outage, is to divide the data loads into multiple increments by making use of the Near Zero Down Time (NZDT) technique that was developed by SAP.

Designing and performing a solid data migration process is state of art and at a minimum requires highly skilled personnel and mature processes. In-depth knowledge of S/4HANA is required to understand the impact of data model changes and interpret the messages from the checks as part of the S/4HANA Migration Cockpit.

Recognizing the importance and complexity of data migration and acting accordingly is a must for executives who want to be in ‘control’ of their professional company. It is important that data migration should not be seen as solely an IT function but also (and more heavily) a business requirement that has a significant impact on a company’s daily business.

Further information on SAP data migrations and how to realize more value from ERP and SAP is included in a recent Compact article ([Biew17]) and – although non-SAP specific – elsewhere in this Compact edition ([Verm17]).

Conclusion

In this article we have outlined key components and considerations for risk management in SAP Business Suite on HANA and SAP S/4HANA (migration) projects. The SAP HANA platform has been around for some time now, but is – in our view – also still in development. The risk management aspects addressed in this article are therefore also subject to the further development of the SAP HANA platform and need to be re-evaluated over time.

References

[Biew17] A. Biewenga and R. Akça, ERP Data Migration: Migration of transactions or tables?, Compact 2017/1.

[KPMG17] KPMG, SAP Market Trends: Creating Value through S/4HANA Finance, February 2017.

[Scho15] T. Schouten and J. Stölting, Security Challenges Associated with SAP HANA, Compact 2015/4.

[Spre16] M. Sprengers and R. van Galen, SAP Landscape Security: Three Common Misconceptions: Protect the ERP system at the heart of your organization, Compact 2016/3.

[Verm17] G. Vermunt, Data migration: manage the risks or lose the project, Compact 2017/3.

Trending topics in GRC tooling

Increasing regulatory pressures and changes have created a new software ecosystem concentrated on providing solutions to manage governance, risk, and compliance processes. Although the ecosystem is still fairly young, it appears to be shaping, and evolving through technology developments like cloud and big data, and responding to changes in the way business wants to manage GRC – from silo to integrated, and from status reporting to real risk insights. Successful deployment of GRC tooling means selecting the right GRC tooling strategy, leveraging the strengths and capabilities of the selected product and sticking to an implementation approach that ensures alignment, speed, agility and confidence.

Introduction

Since 2002 regulatory changes have forced many organizations to implement multiple oversight functions managing compliance and risk within the organization. This created a new tooling ecosystem focused on risk and compliance functions and internal audit. Since then numerous software vendors have moved into this space, with some organizations having already entered into the second round of selecting a new tool. The tooling market is taking shape and successful and unsuccessful implementations have resulted in a number of key principles to be implemented when embarking on the GRC tooling journey. This article first identifies the ecosystem for GRC tooling, and some key developments in this space. The second part of this article will describe key principles in implementing GRC tooling.

A history perspective of GRC

The concept of GRC emerged with the introduction of the Sarbanes-Oxley Act of 2002. Countless other high-impact legislations in combination with various reported large scandals and external pressure from stakeholders and shareholders resulted in companies focusing more on the governance, risk and compliance activities. Because of more strict external demands, companies were and today still are required to provide reliable in-control statements. This requires companies to be able to consolidate and manage different pieces of data required as input for the in-control statements. Risk and compliance initiatives were in many cases setup in silos with each initiative having its own tool and reports, resulting in some cases in contradicting risk reports. Consolidating the initiatives into a single view on risk and compliance is a challenge and requires additional databases and middleware tooling to provide meaningful overviews and management reports.

GRC promises an integrated governance, risk and compliance approach that increases risk transparency across the organization while also enabling more efficient risk and compliance management and enabling new business opportunities. While evolving through the different maturity levels of integrated GRC the need arises to move from traditional management using spreadsheets to more sophisticated technology. Recent research ([OCEG16]) on the use of GRC tooling within organizations shows approximately 65% of the respondents have implemented GRC tooling in one way or another.

GRC tooling ecosystem

Performing a google on GRC tooling will provide you with a wide variety of vendors. Most of the vendors deliver a variety of what they call plug and play solutions to enable you to hit the ground running. When peeling off the cosmetics, GRC tooling is in fact fairly simple. In its simplest form GRC tooling consists of a database, a document repository, a workflow engine with alerting, reporting and dashboards, web-based and mobile accessibility, and in some cases, a data integration service. By combining these components with common client issues, software vendors provide packages including go-to market use cases, in some cases through an intermediate module layer.

The GRC ecosystem is still relatively young with new entrants and solutions frequently emerging. The innovators (new entrants) tend to focus on emerging compliance and/or risk themes like GDPR, Cyber, Vendor Risk and/or Regulatory Risk, with strong capabilities in data integration and advanced analytics. The traditional players have by now developed a more mature suite of traditional use cases like audit management, operational risk management, SOx (internal control over financial reporting) and are now faced with the challenge of keeping pace with the new technologies being introduced.

Vendors appear to present and position themselves in the GRC ecosystem driven by three main questions and six related design principles (Figure 1). In the remainder of this paragraph we will discuss three main observations defining the GRC ecosystem: point solutions versus eGRC platforms, on premise versus cloud, and from workflow to data driven.

C-2017-3-Lamberiks-01-klein

Figure 1. Three main questions and six design principles. [Click on the image for a larger image]

Point solutions versus eGRC platforms

Based on the selected principles and positioning you will find vendors trying to cover the full suite, or vendors with a focus on a specific niche, a so-called point solution.

The enterprise GRC suite is the ERP in risk and compliance. It supports a wide range of use cases generally targeted at supporting the GRC process and methodologies of all risk and compliance functions. The GRC suite vendors offer their product largely independent of the market a company in is. The solution is often delivered on premise1 and it can generally be configured to match customer requirements.

Point solutions, by definition, focus on a certain point of GRC, e.g.:

  • one of the lines of defense like Audit Management software aimed at Internal Audits;
  • a common process executed by multiple risk/compliance functions, e.g. Policy Management;
  • a specific risk area, for example environmental health and safety or regulatory change;
  • specific capabilities, like data analytics.

Both enterprise GRC and point solutions have their opportunities and challenges, see Table 1.

C-2017-3-Lamberiks-t01-klein

Table 1. Opportunities and challenges. [Click on the image for a larger image]

It is very likely that organizations find that there is not just one solution that fits all needs. In general a combination of tools with even some manual process workarounds, should be applied in this respect. Much similar to the ERP ecosystem, the organization must ask itself: what is my GRC tooling strategy? Organizations can apply different strategies, e.g. best of suite, best of breed, point solutions etc.  

A best of suite strategy (one eGRC platform from one vendor) requires consensus amongst all the stakeholders as to the goals of the GRC program and the way to achieve these through technological implementation. In many cases it will also result in compromises between stakeholders as not all requirements of a single stakeholder will be addressed – either as a result of specific limitations of the tool, because in an integrated process you don’t want (too many) exceptions on because configuration choices made in the GRC platform are applicable to all the parties and stakeholders using it. A point solution obviously is much narrower and will cover specific needs of a process, or a risk and compliance function individually. This is likely to be easier and faster to implement, and in most cases will provide more advanced capabilities compared to an enterprise platform.

The most common strategy toward GRC tooling is one common enterprise GRC platform to cover approximately 70 to 80% of the GRC processes, and implement point solutions to close the gaps. The point solutions generally tend to focus on innovative, content rich solutions in specific pockets, which can be best seen as plugins. Such strategy offers the stability and central maintenance of integrated GRC, while being open and resistant to the rapidly changing pace in GRC. The challenge in this strategy is to locate the right point solution offering the exact piece of required functionality (and no more) to avoid unnecessary cost which can fully integrate (two way) with your existing GRC platform.

On premise versus in the cloud

In principle GRC vendors only license the software or underlying code of the application. Other aspects like setting up the different instances, environments, servers, databases are performed during the implementation project, and are mostly partly the responsibility of the customer. We observe two changes in the way GRC software is delivered:

  • Most vendors move away from the perpetual license model to a subscription license model. For financial and other reasons a subscription model is very interesting for the vendor.
  • More and more customers demand the vendor to provide an end to end solution (software, infrastructure and management). This demand is mainly driven by the efforts that go into the set-up of the in-house sourcing of the GRC tooling and the need for in-house skills to support the tool.

The combination of the two provide some early indications of GRC tooling becoming fully cloud adopted (delivered as a service). However, for two main reasons we expect GRC tooling to still be delivered in a more traditional way, at least for the next few years. First of all companies will be prudent in bringing sensitive or personal data and/or business critical processes (think about BCM or Incident Management and Response) to the vendor (is it secure?), and secondly, a full multi-tenant delivery model will require significant changes and thus investment in the software code, resulting in vendors more likely focusing their efforts on maturing the software.

We do expect vendors to develop an application management service to support customers in managing the application, and we expect vendors to build partnerships with Infrastructure or Platform Service providers to provide hosting. This means as a customer you can, if you want, outsource the entire stack with the flexibility of cloud. If you decide to go for an outsourced model, be sure to thoroughly investigate the service setup (e.g where is data stored, which parties are involved?), and the available certifications of the providers (e.g. is a SOC2 statement available?).

Extending beyond workflow management

Traditionally GRC solutions can be considered to facilitate risk and compliance processes by integrated tooling and software. Especially because many of the GRC software vendors support easy configuration or tuning of the software to match GRC processes, companies are able to work with implementation partners, or configure new functionality easily themselves. With this focus on processes, much of the GRC tooling can be considered as workflow management systems, that are delivered with well-developed out-of-the-box processes, sometimes even tailorable to the maturity level of the company. For a company which adopted and implemented its processes in GRC tooling, keeping the system up-to-date and filled with the correct data is largely dependent on human interaction. To give a few examples:

  • the registration of Loss Events and follow-up of potential Legal Claims life-cycles;
  • performing Risk Assessment and Risk Response for each entity in the organization;
  • manual control testing of process level controls including follow-up and validation of findings.

As the examples above clearly show, these activities require multiple roles to actively enter the GRC system and create or enrich content, with both first, second, third, and maybe even fourth line of defense participating. Although having this input is very important for management reports and eventually the end state of the in-control statement, lots of manual work is needed to get there. Also, getting the right information out of the system could be a difficult exercise.

Where GRC processes can generate huge amounts of data with individual risks or controls labeled against many different attributes, GRC tooling can be limited in functionality to support more advanced dashboarding and reporting (for an example, see Figure 2). Most GRC tooling is not able to identify complex patterns or to implement even algorithms to analyze data, while these insights often add most value in steering on GRC themes. This is where we see the need for additional functionality or more sophisticated business intelligence tooling and where a larger need for automation comes into the picture.

C-2017-3-Lamberiks-02-klein

Figure 2. Example of extended usage of GRC data for dashboarding and business intelligence. [Click on the image for a larger image]

Different vendors are already offering automated analytic tools, where risk and compliance status data can be automatically derived, based on for instance log files or other automated outputs. By setting up the right interfaces providing input into the GRC solution, more meaningful data can be combined giving better insights and reducing human intervention and the associated errors. Some trending concepts commonly used like data mining or process mining in combination with automated control testing or continuous control monitoring are more and more adopted by companies on top of the existing GRC solutions. By applying these technologies, manual activities to verify whether controls are executed correctly can be automated and performed continuously.

Key principles in implementing GRC tooling

Based on the collective experience of the authors in multiple implementation projects, we have identified a number of key principles to a successful implementation:

  1. Align before you design
  2. Begin with the end in mind
  3. Stick to the standard
  4. Apply an agile approach
  5. Manage the change

a. Align before you design

In essence a big part of a GRC implementation relates to processes to support different groups of people (e.g. Risk Managers, Project Managers, Control Testers) in executing their day-to-day activities according to a predefined workflow. The implementation brings together those parts of the organization which used to work quite independently using their own tools, processes and ways of working. The selected GRC tooling itself also comes with its own terms and definitions, workflows and (implicit) logic.

It is essential to have a common definition and common understanding of both the key definitions and taxonomy of GRC and of future state processes from the start of the project. These can be as basic as ‘What do we mean by residual risk?’, ‘Are we going to use a 5-point or a 9-point scale to assess risk?’ or ‘Who can be the owner of a risk or control and how do we define this?’. Decisions on taxonomy and definitions can have big implications on the governance and responsibilities within your organization and can jeopardize your GRC initiative if brought up too late. It is good practice to record the key decisions in relevant policies and standards and to translate these into practical ways of working within different parts of your organization.

Making these processes explicit by drafting them in the form of process ‘swimming lanes’ is a very useful instrument right at the beginning of the project. They can be more easily related to by business representatives and they form the basis for defining functional requirements and for the translation to modules within the selected GRC tooling. These processes also serve a purpose during (functional) testing and more importantly during the business implementation.

Not all activities in a GRC related process will be executed in or supported by the selected GRC tooling; some activities will remain outside the tool. In defining the ‘GRC processes’ it is relevant to make a distinction between both of these. During business implementation the activities that are supported by the GRC tooling can be more easily translated into a training program. However, it is just as important to also define the desired and expected behavior (‘way of working’) for activities not directly performed in the tool.

b. Begin with the end in mind

Speaking the same language and being aligned on taxonomy and the scope of the GRC initiative are all very important, but it is now time to ensure that all stakeholders have confidence in the tool. During the selection of the GRC tooling the teams will have obtained a broad understanding of the capabilities of the tool. It is good for your organization to now understand what the strengths, but also the limitations of the tool are. This is to ensure that you are aware of what the tool can support very well, what it can do after some modifications and what you should really not use it for.

This step is targeted at creating a first prototype or concept of the full GRC solution to be implemented. The definition of a ‘full GRC solution’ in this context is flexible in that it can be the implementation of a complete new framework to manage risk and control activities or it can be much smaller and targeted, for example on the management of third party risk. The goal of this phase is to create confidence that the selected tool will enable and support the target GRC state. This is achieved by having this first understanding of the final product early in the project and by already starting to execute some of the GRC activities using ‘real’ data. Finally, a conscious GO/NO GO decision is typically made to either continue, revise the approach or stop the GRC initiative.

c. Stick to the standard

In the previous step the teams have obtained a good insight into the full capabilities of the GRC tooling, and have understood its complexity. It would not be the first time that the out-of-the-box capabilities of the tool initiate a review of existing processes and requirements. Some of the most successful implementations have consistently applied the starting point to use out-of-the-box functionality of the selected GRC tooling unless there are very strong reasons to deviate from this. Following this principle you can leverage the in-built good practices of the tool, it can provide an effective way to close otherwise lengthy discussions and it forces you to make a conscious decision about deviating from the standard (are we as a company so different that we need to deviate?).

d. A more agile project approach to drive value

When the big picture is confirmed and the key gaps to be closed are defined, the next step is tuning the GRC solution to the target process and maturing the full solution so it is ready for a wide use within your organization. Unlike in the first step where the entire GRC solution is covered, the maturing of blocks of functionality (e.g. risk assessment) is best done for each building block.

Most of the GRC tooling that is available in the market is flexible, in that it can be relatively easily configured and tailored to your needs and processes, while leveraging the capabilities of the GRC tooling. This allows you to apply an agile or iterative project approach, where you work towards the final GRC solution in iterations/cycles continuously expanding and building on the product, resulting from the previous iteration/cycle. Some of the main advantages of applying such an approach is that you get an impression of the final solution at an early stage, that you see it grow and develop and that you are able to reprioritize your requirements with each iteration/cycle focusing on items which add most value. Often, requirements which appear very important upfront, are later given a lower priority and may even end up not even being included. An effective agile team includes only a few business representatives for the domain in scope, who are mandated to make design decisions and ‘own’ the requirements on behalf of your organization. Needless to say, they should also act according to the mandate they have.

It is useful to pilot completed blocks of functionality within a representative part of your organization to not only validate the robustness, completeness and practical use of that building block, but also to test the business implementation approach. Can users practically work with it? Is it intuitive? What elements require additional explanation or training? Lessons learned from the pilot(s) are used to functionally complete a building block and to refine the business implementation approach.

e. Manage the change

An integrated view of risk is a cultural change for many organizations with enormous impact, and should therefore be guided by an organizational change process. The final phase focuses on the so-called business implementation where not only the GRC solution, but also the new or changed ways of working in question are implemented throughout your organization. The approach and duration of this phase vary widely across GRC implementations, depending on the amount of change your organization can handle, the level of senior management support, the phasing out of existing GRC tooling or solution and the existence and strength of a compelling event. As with any (IT) implementation, it is only during this phase that the true benefits start getting achieved, so it is important to measure this achievement and adjust either the GRC solution or implementation approach if the benefits are lagging behind.  

Final considerations

Although the GRC tooling market is taking shape, it is not yet mature. IT developments such as cloud and big data will continue to influence and maybe drastically change the GRC tooling ecosystem in the coming years. The rising stars of the past need be careful and continue to innovate their product to keep pace with the young, innovative and ambitious new entrants. Organizations will very likely need a combination of tools to cover all requirements, with one tool to rule them all. Selection and deployment of GRC tooling will focus on standard out-of-the-box functionality and configuration, with highly agile methods of change.

Notes

  1. Some vendors provide managed hosting solutions, but through a dedicated client environment.

Reference

[OCEG16] OCEG, 2016 OCEG GRC Technology Strategy Survey.

25 mei 2018 komt in zicht: handvatten om te voldoen aan nieuwe privacywetgeving

Met de invoering van de nieuwe privacywetgeving stellen veel organisaties de vraag welke maat­regelen ingericht moeten worden om hieraan te kunnen en blijven voldoen. Dit artikel biedt een raamwerk dat inzicht geeft in de goede gebruiken van zeven onderzochte organisaties uit verschillende sectoren, en kan door andere organisaties worden gebruikt als uitgangspunt of referentiekader bij het opzetten van een privacyprogramma.

De maatregelen zijn samengevat in een generiek raamwerk, gebaseerd op het People-, Process- en Technology-model. De onderzochte organisaties noemen drie maatregelen die prioriteit verdienen bij de bescherming van persoonsgegevens: 1) het adequaat beveiligen van data, 2) op basis van de aard en activiteiten van de organisatie (welke privacygevoelige gegevens worden verwerkt?) beleid bepalen voor de omgang met dataprivacy en 3) privacybewustzijn creëren bij de werknemers.

Introductie: de komst van de Algemene Verordening Gegevensbescherming

Tot 2016 was de invoering van de Wet bescherming persoonsgegevens (Wbp) uit 2001 de laatste omvangrijke verandering in de Nederlandse privacywetgeving ([OVER01]). Dit betrof de implementatie van de Europese Privacyrichtlijn uit 1995 ([EUPA95]). In 2016 is er, na jarenlang overleg tussen de lidstaten van de Europese Unie (EU), overeenstemming bereikt over de inhoud van de Algemene Verordening Gegevensbescherming (AVG, in het Engels GDPR genoemd).

De AVG is op 25 mei 2016 reeds in werking getreden, en heeft een implementatietijd van twee jaar; organisaties hebben derhalve tot 25 mei 2018 de tijd om de eisen van de AVG te implementeren. Op die datum zullen de Wbp en de Europese Privacyrichtlijn ingetrokken worden en vanaf dan wordt de AVG gehandhaafd. Met de komst van de AVG worden de privacyeisen strenger en uitgebreider. Bovendien worden alle privacyeisen in de verschillende EU-lidstaten gelijkgetrokken, omdat een EU-verordening rechtstreeks van toepassing is op elke lidstaat. Hiermee worden onderlinge verschillen voorkomen. Daarnaast is de geografische scope van de AVG uitgebreider dan de huidige wetgeving, aangezien de AVG van toepassing is op alle organisaties die persoonsgegevens van inwoners uit de EU verwerken. Hiermee heeft de AVG een extraterritoriale werking en treft deze wetgeving ook organisaties buiten de EU.

Tot slot worden de boetes door de AVG flink hoger. Met de komst van de AVG kan een boete oplopen tot wel 20 miljoen euro, of 4% van de wereldwijde jaaromzet (de hoogste waarde telt). Deze boetes kunnen per overtreding worden opgelegd (bijvoorbeeld voor het overschrijden van bewaartermijnen en het niet op orde hebben van een verwerkingenregister), waarbij de hoogte wel afhankelijk is van de handhavingskracht van de Autoriteit Persoonsgegevens (AP) en de mate waarin de betreffende organisatie toereikende privacymaatregelen heeft getroffen. Vooruitlopend op de AVG kan de AP sinds 1 januari 2016 al boetes opleggen, welke kunnen oplopen tot 820.000 euro of 10% van de jaarlijkse omzet ([OVER16]). Met deze wijzigingen geeft de EU een belangrijk signaal af dat de privacy van haar burgers zeer serieus wordt genomen.

Door de invoering van deze wetgeving stellen veel organisaties de vraag welke maatregelen ingericht moeten worden om te voldoen en te blijven voldoen aan de AVG. Deze vraag was de aanleiding om onderzoek te doen naar de wijze waarop privacyvolwassen organisaties zich voorbereiden op de aangescherpte privacywetgeving. ‘Privacyvolwassen’ houdt in dat organisaties zich minimaal op ‘niveau 3’ qua privacyvolwassenheid bevinden. Gebaseerd op het CMM-model, houden de niveaus het volgende in:

  • niveau 1: ad-hoc/informeel;
  • niveau 2: beheerste processen;
  • niveau 3: vastgestelde (bedrijfsbrede) processen;
  • niveau 4: voorspelbare processen;
  • niveau 5: geoptimaliseerde processen.

Wij zien dat organisaties die de huidige privacywetgeving al goed en volledig hebben geïmplementeerd, en/of tijdig zijn begonnen met de voorbereiding op en implementatie van de AVG, zich op een hoger volwassenheidsniveau bevinden. Hierbij is het goed om te realiseren dat alleen de eisen eenmalig implementeren niet genoeg is; compliant blijven aan de AVG is een continu doorlopend proces. Zo moet de documentatie blijvend worden bijgehouden, bewaartermijnen gemonitord, persoonsgegevens gecorrigeerd of ge-update waar nodig, en de werking van de benodigde (beveiligings)maatregelen geëvalueerd en aangepast waar nodig.

Door middel van interviews met de Data Protection Officers (DPO’s) van zeven organisaties – opererend in de criminele opsporing, de telecomsector, de bancaire sector en de energiesector – is inzicht verkregen in de maatregelen die organisaties hebben genomen of nog van plan zijn te nemen om te voldoen aan de AVG. De grootste veranderingen in de privacywetgeving ten opzichte van de huidige situatie zijn als uitgangspunt genomen voor deze interviews. De verschillende benaderingen van de organisaties zijn samengevat in een generiek data-privacyraamwerk, gebaseerd op het People-, Process-, Governance- en Technology-model ([Leav65]). Dit raamwerk geeft inzicht in de goede gebruiken van de zeven onderzochte organisaties, en kan door andere organisaties worden gebruikt als uitgangspunt of referentiekader bij het opzetten van een eigen privacyprogramma.

Eisen en benodigdheden voor implementatie

De voornaamste wijzigingen ten opzichte van de huidige situatie ([EUCO15]), zoals mede aangegeven door de DPO’s, zijn hieronder uiteengezet. Hierbij wordt een aantal handvatten geboden met betrekking tot de voorbereidingen die organisaties kunnen treffen om deze eisen te implementeren.

1. Accountability

In de AVG worden meer eisen gesteld aan de ‘accountability’ van een organisatie. Accountability houdt kortweg in dat organisaties aantoonbaar compliant zijn en verantwoording kunnen afleggen richting de toezichthouders en betrokkenen over de behoorlijke, zorgvuldige en transparante omgang met persoonsgegevens. Zo zullen organisaties actief een verwerkingsregister moeten bijhouden, met daarin onder meer de categorieën: persoonsgegevens, betrokkenen en (eventuele) ontvangers, verwerkingsdoeleinden, bewaartermijnen en beveiligingsmaatregelen. Dit moet een organisatie op elk moment aan de toezichthouder kunnen laten zien. Andere accountability-eisen binnen de AVG zijn bijvoorbeeld de vereiste van het schriftelijk vastleggen van rollen, taken en verantwoordelijkheden, en een schriftelijk privacy- en informatiebeveiligingsbeleid (inclusief datalekprocedure) op te stellen. Om te voldoen aan de verwachting van accountability, zoals uitgewerkt in de AVG, geven de verschillende DPO’s aan dat de volgende aspecten van belang zijn:

Organisatorische, technologische en fysieke beveiligingsmaatregelen

Zonder goede beveiligingsmaatregelen kunnen persoonsgegevens niet adequaat beschermd worden. Hierbij zijn zowel organisatorische maatregelen (bijvoorbeeld het trainen van personeel of het opstellen van een beveiligingsbeleid, het naleven van bewaartermijnen), fysieke maatregelen (zoals sloten op kasten en deuren en een pasjessysteem om binnen te komen), als technologische maatregelen (anonimiseren, logische toegangsbeveiliging, zoals role-based-access controls, encryptie, firewalls, etc.) van groot belang.

Bijhouden van documentatie van de geïmplementeerde privacymaatregelen

Deze documentatie kan worden overgedragen aan de autoriteiten, om aan te tonen dat voldoende maatregelen zijn ingericht om de persoonsgegevens adequaat te beschermen. Bovenstaande organisatorische, fysieke en technologische maatregelen zullen derhalve adequaat gedocumenteerd moeten worden en periodiek worden geëvalueerd op hun werking.

Goed gebruikmaken van de privacypolicy en -statement

Een privacypolicy (ook wel privacybeleid genoemd) is een intern beleidsstuk over de wijze van handelen met betrekking tot persoonsgegevens. Het is van belang dat hierin een datalekprocedure en het informatiebeveiligingsbeleid schriftelijk wordt vastgelegd. Daarnaast is het goed om de bewaartermijnen per categorie persoonsgegevens, en de verantwoordelijke per categorie persoonsgegevens, in dit document op te nemen.

Een privacystatement is een document dat extern richting betrokkenen wordt gecommuniceerd, waarin zij worden geïnformeerd over de verwerking van hun persoonsgegevens. De inhoud hiervan moet aan een aantal wettelijke eisten voldoen; zo moeten betrokkenen geïnformeerd worden over de doelen van de gegevensverwerking, de grondslag, bewaartermijnen, hun rechten bij eventuele verstrekkingen aan derden en de contactgegevens van de verantwoordelijke organisatie. Door gebruik te maken van één privacystatement kan een organisatie het gebruik van (een overdaad aan) statements en expliciete toestemmingsvragen vermijden. Het privacystatement moet duidelijk (heldere taal), compact en volledig zijn.

Opt-in/opt-out-systeem

Met een adequaat opt-in/opt-out-systeem, waarbij organisaties een overzicht creëren van de toestemming van hun klanten voor de (additionele) verwerking van persoonsgegevens, kan een organisatie accountability aantonen tegenover de toezichthouder. Daarnaast kan dit register handvatten bieden voor het inwilligen van verzoeken met betrekking tot het intrekken van toestemming door betrokkenen.

2. Privacy-by-Design en Privacy-by-Default

In de AVG worden Privacy-by-Design en Privacy-by-Default genoemd als essentiële vereisten. Dit betekent dat privacy vanaf het begin van elke informatielevenscyclus en gedurende de hele looptijd ervan ingebed is. Dit betreft dus elk (nieuw) project/programma/systeem/tool waarin persoonsgegevens worden verwerkt.

Bij Privacy-by-Design zijn voorts de volgende basisprincipes van belang:

  • voorkomen is beter dan genezen;
  • privacy is de standaard;
  • integreren van gegevensbescherming en beveiliging in het ontwerp;
  • volledige functionaliteit;
  • end-to-end beveiliging;
  • zichtbaarheid en transparantie;
  • respect voor de privacy van de betrokkene: deze staat centraal.

Daarbij wordt door de DPO’s aangegeven dat een organisatie gebruik kan maken van de volgende middelen om Privacy-by-Design/Privacy-by-Default te waarborgen:

Het uitvoeren van Privacy Impact Assessments (PIA’s)

Het uitvoeren van een PIA, voordat een nieuw project, proces of het gebruik van een nieuwe tool begint, borgt dat de bescherming van persoonsgegevens al aan het begin van de ontwikkeling van nieuwe initiatieven wordt geadresseerd. Een PIA identificeert de privacyrisico’s en helpt de benodigde beheersmaatregelen te kiezen en implementeren. Het uitvoeren van een PIA en de uitkomsten ervan vormen dan ook een goed uitgangspunt voor het toepassen van Privacy-by-Design. Het uitvoeren van PIA’s wordt met de komst van de AVG verplicht, wanneer de voorgenomen gegevensverwerking (waarschijnlijk) een hoog risico voor de privacybescherming kent (zoals bij profiling). Het is echter raadzaam om het uitvoeren van PIA’s niet alleen tot deze situaties te beperken. De uitkomsten van PIA’s helpen namelijk om privacyrisico’s vroegtijdig te identificeren en  beheersen. Voor de verplichte PIA’s schrijft de AVG voor wat er in moet komen te staan (systematische beschrijving, noodzakelijkheids- en evenredigheidstoets, impactanalyse en benodigde beheersmaatregelen).

Verder kan bijvoorbeeld het Toetsmodel PIA Rijksdienst voor de overheid gebruikt worden (in sommige gevallen is dit verplicht) en de NOREA-template voor overige organisaties. Alle geïnterviewde DPO’s gaven aan dat binnen hun organisaties al gebruik wordt gemaakt van PIA’s. Hierbij geven zij specifiek aan dat een PIA ook gebruikt kan worden om het privacybewustzijn binnen de organisatie te vergroten. Dit is echter wel afhankelijk van wie de PIA uitvoert en wie er betrokken worden bij het uitvoeren ervan. Als het uitvoeren van de PIA’s door interne of externe specialisten gebeurt, beklijft het minder bij de direct betrokken medewerkers en managers. Wij zien dat werknemers binnen organisaties meer privacybewust worden wanneer de medewerkers die direct werken met persoonsgegevens en de bijbehorende projecten/systemen/tools, actief betrokken worden bij het uitvoeren van een PIA (bijvoorbeeld door het houden van interviews). De actieve betrokkenheid van deze medewerkers vergroot ook de kans dat een juiste en volledige weergave van de risico’s en werkwijzen in de praktijk in kaart wordt gebracht.

Opt-in/opt-out voor klanten

Met het regelen van een opt-in/opt-out-mogelijkheid hebben betrokkenen de keuze welke informatie zij verstrekken aan de betreffende organisatie. Een opt-out mag niet leiden tot het niet kunnen afnemen van een dienst van de organisatie. Zoals eerder genoemd is het raadzaam om deze opt-ins en opt-outs in een systeem vast te leggen.

Technologische beveiligingsmaatregelen

In het kader van (het bereiken van) Privacy-by-Design worden vaak ook Privacy Enhancing Technologies (PET’s) genoemd. Dit is de verzamelnaam voor verschillende technieken in de informatiesystemen om de bescherming van persoonsgegevens te ondersteunen. Hieronder vallen anonimiserings- en pseudonimiseringstechnieken, de encryptie van persoonsgegevens of het gebruik van geanonimiseerde gegevens in testomgevingen. Zie ook [Koor11] voor meer informatie over Privacy Enhancing Technologies.

Dataminimalisatie en bewaartermijnen

Alleen de persoonsgegevens die nodig zijn voor het bereiken van het doel mogen worden verzameld, verwerkt en opgeslagen. Als de persoonsgegevens niet (meer) nodig zijn voor het bereiken van het doel of voldoen aan een wettelijke bewaartermijn, moeten ze worden verwijderd. Het is van belang om deze bewaartermijnen (voor zover mogelijk) van tevoren te bepalen voor nieuwe verwerkingen. Wij adviseren organisaties een inventarisatie te maken van de bewaartermijnen van de al opgeslagen/gebruikte persoonsgegevens. Organisaties zijn verplicht om alle (voorgenomen) bewaartermijnen te documenteren.

Classificatie van persoonsgegevens

Op basis van het privacyrisico met de corresponderende beveiligingsniveaus en geldende wettelijke eisen kan een overzicht worden gecreëerd van de mate van bescherming en/of additionele wettelijke eisen per categorie. Onze ervaring is dat veel organisaties een onderscheid kunnen (en/of moeten) maken tussen ‘gewone persoonsgegevens’, ‘bijzondere persoonsgegevens’ en ‘gevoelige persoonsgegevens’. Voor bijzondere persoonsgegevens (zoals ras, etniciteit, gezondheidsgegevens, etc) gelden additionele wettelijke eisen (zoals een extra wettelijke grondslag) en zwaardere beveiligingseisen. Persoonsgegevens die niet in de AVG als bijzonder zijn aangemerkt, maar wel naar hun aard gevoelig zijn (zoals financiële informatie), dienen extra beveiligd te worden, omdat de negatieve impact voor betrokkenen erg groot kan zijn in het geval van een datalek. Organisaties dienen de categorieën van persoonsgegevens die worden verwerkt schriftelijk te documenteren en op verzoek van de toezichthouder te overhandigen.

Een datalekprocedure

Voor het waarborgen van Privacy-by-Design is een datalekprocedure (ook) van belang.

Aanstellen van privacyteams

Idealiter worden er privacyteams aangesteld met taken en verantwoordelijkheden om privacy te borgen binnen de organisatie. Deze teams controleren onder meer dat er geen privacygevoelige informatie rondslingert en hebben een mandaat om collega’s aan te spreken, zodat het privacybewustzijn van werknemers wordt vergroot.

3. Rechten van betrokkenen

In de AVG worden de rechten van betrokkenen uitgebreid met het recht op dataportabiliteit, en wordt het ‘recht om vergeten te worden’ verankerd. Ook wordt onder andere het recht op informatie uitgebreid; vóórdat de gegevensverwerking begint, dient de verantwoordelijke de betrokkene over meer zaken te informeren dan nu het geval is (bijvoorbeeld over bewaartermijnen, doorgifte van gegevens, etc). Het is voor organisaties van belang dat deze rechten ook daadwerkelijk ingewilligd kunnen worden. Omdat het verwerken van persoonsgegevens vaak nodig is voor organisaties om diensten te kunnen verlenen aan hun klanten (de betrokkenen), verwachten de geïnterviewde DPO’s niet dat betrokkenen het recht om vergeten te worden vaak zullen gebruiken. De impact hiervan lijkt daarmee klein.

Wel moet worden opgemerkt dat wanneer betrokkenen het vermoeden hebben dat hun persoonsgegevens niet zorgvuldig worden verwerkt, hier snel verandering in kan komen. De DPO’s geven hierbij aan dat:

Er geen aanleiding moet zijn voor klanten om van deze rechten gebruik te maken.

Het bewustzijn van medewerkers voor het zorgvuldig omgaan met en het verwerken van persoonsgegevens en de hieraan gerelateerde risico’s is dus van uiterst belang.

Bij de start van nieuwe projecten rekening dient  te worden gehouden met de rechten van betrokkenen (Privacy-by-Design).

Het implementeren van de mogelijkheid om persoonsgegevens weer uit systemen te verwijderen is hier een voorbeeld van.

Het belangrijk is dat men weet waar welke data wordt opgeslagen.

Voor complexe organisaties kan dit proces worden ondersteund door een data-mappingtool, waarin wordt geregistreerd welke persoonsgegevens zijn opgeslagen in welk systeem/project/tool. Ook het eerder genoemde opt-in/opt-out-raamwerk kan van groot belang zijn om bij te houden welke klanten voor welke doeleinden toestemming hebben gegeven of deze selectief hebben ingetrokken. Onze ervaring hierbij is dat het van groot belang is om ongestructureerde data in kaart te brengen; wij zien vaak dat het feit dat de meeste data ongestructureerd is, wordt vergeten of onderschat. Het is daarbij voor veel organisaties een uitdaging om dit goed in kaart te brengen. Bij ongestructureerde data kan gedacht worden aan persoonsgegevens die worden uitgewisseld tussen de betrokkene en (bijvoorbeeld) de klantenservice van een bedrijf, via e-mail, social media, telefoon of brief. Het in kaart brengen van alle data is belangrijk om aan de overige verplichtingen van de AVG te voldoen, alsmede te weten waar datalekken kunnen ontstaan.

Dataminimalisatie is noodzaak.

Persoonsgegevens mogen alleen worden verzameld en opgeslagen als deze noodzakelijk zijn om het doel te bereiken. Als ze niet (meer) nodig zijn, mogen ze niet (meer) worden verzameld en opgeslagen en dienen ze te worden verwijderd of geheel te worden geanonimiseerd. Dataminimalisatie wordt als een kritieke factor gezien bij het in goede banen leiden van de rechten die betrokkenen kunnen uitoefenen. Hoe minder persoonsgegevens worden opgeslagen, hoe minder complex de processen voor het voldoen aan deze rechten, hoe minder te beschermen (en te back-uppen), hoe minder de datakwaliteit bewaakt hoeft te worden en hoe minder groot de impact is als persoonsgegevens worden gelekt (bijvoorbeeld door middel van een hack).

4. Data Privacy Officer (DPO)

Het aanstellen van een DPO wordt voor sommige organisaties verplicht (bijvoorbeeld overheidsorganisaties of organisaties die op grote schaal bijzondere persoonsgegevens verwerken). Ook de organisaties waarvoor een DPO niet verplicht is, raden wij aan om een DPO aan te stellen, of in ieder geval een Privacy Officer, zodat de coördinatie van de privacy belegd is binnen de organisatie. Het voornaamste verschil tussen een DPO en Privacy Officer is dat de DPO een volledig onafhankelijke functie is binnen een organisatie. De geïnterviewde DPO’s geven hierbij ook aan dat er dankzij een DPO een duidelijker overzicht kan worden verkregen van de maatregelen die al genomen zijn en nog genomen moeten worden om privacy adequaat te beschermen, alsmede hoe hierop goed toezicht gehouden kan worden. Hierbij is het van belang dat de DPO genoeg middelen en support van het management krijgt om de privacy naar behoren te kunnen inrichten en borgen. Zonder de betrokkenheid van het hogere management staat privacy niet bovenaan de agenda en krijgt het vaak niet de aandacht die het verdient. Wij zien bij veel organisaties dat de DPO samenwerkt met de Security Officer en/of CISO, zodat de privacy en informatiebeveiliging goed op elkaar kunnen worden afgestemd. Ook zien we dat bij grote organisaties een privacyteam wenselijk is (met de DPO ‘aan het hoofd’), waarin de belangrijkste stakeholders van een organisatie, als het gaat om privacy, plaatsnemen (bijvoorbeeld iemand van de juridische afdeling, klantenservice, IT, marketing, HR en andere medewerkers die (veel) met persoonsgegevens werken). Op deze manier kan de privacy geborgd worden binnen de gehele organisatie.

Een kanttekening bij het bovenstaande is overigens dat wij zien dat het voor veel organisaties een uitdaging is om voldoende gekwalificeerd personeel aan te stellen en/of dat privacy niet bij de juiste medewerkers wordt belegd. Het is van belang dat aangestelde medewerkers kennis van privacy hebben, maar ook dat er verschillende expertises worden gewaarborgd (juridisch, projectmanagement, technisch, etc). Daarom is het ook aan te bevelen om tijdig benodigd personeel te werven en bewustzijn te creëren bij het management van de organisatie, aangaande het belang van de investering in adequaat personeel.

5. Meldplicht datalekken

Organisaties zijn niet altijd in staat om een datalek met (gevoelige) persoonsgegevens te voorkomen. Dit vereist de AVG ook niet; het niet melden ervan is hetgeen beboet kan worden. Het verplicht melden van datalekken aan de Autoriteit Persoonsgegevens en – afhankelijk van het type lek en impact – de betrokkenen, maakt sinds 1 januari 2016 al deel uit van de Nederlandse Wbp. Hiermee is Nederland vooruitgelopen op de komst van de AVG, waarin deze meldplicht van datalekken ook is opgenomen. De meldplicht datalekken houdt in dat organisaties een datalak binnen 72 uur na de ontdekking ervan moeten melden aan de betrokkenen. Dit is in lijn met de Europese tijdslimiet. Door de geïnterviewde DPO’s wordt aangegeven dat het onderstaande voor de meldplicht datalekken van groot belang is:

Een overzichtelijke data-infrastructuur

Wanneer er een datalek plaatsvindt, wordt zo gewaarborgd dat de organisatie de Autoriteit Persoonsgegevens (en eventueel de betrokkenen) van duidelijke informatie kan voorzien, zoals welke persoonsgegevens zijn gelekt en wat de impact hiervan is op de betrokkenen. Dit kan boetes vermijden, dan wel inperken. Ook kan dit overzicht gebruikt worden om de (eventuele) negatieve impact voor betrokkenen te beperken; doordat duidelijk is waarnaartoe de data (mogelijk) is gelekt, kunnen er immers gerichte beheersmaatregelen genomen worden.

Technologie

Technologische middelen, zoals anonimisering, encryptie en toegangsrestrictie kunnen het risico op datalekken verminderen. Tools waarmee overtallige persoonsgegevens opgespoord en verwijderd kunnen worden uit de systemen zijn eveneens een mogelijke oplossing. Deze techniek is veelal nog onontgonnen terrein, omdat de huidige bekende tools dit nog nauwelijks ondersteunen en deze nog volop in ontwikkeling zijn.

Datalek-responseprocedure

Het reageren op datalekken is een onderdeel van crisismanagement en in die zin niet nieuw. Het gaat hierbij om het bijeenroepen van een multidisciplinair team om een datalek te onderzoeken, de mogelijke consequenties te verkleinen en om binnen 72 uur na de ontdekking ervan het datalek bij de Autoriteit Persoonsgegevens te melden. Hierbij is het van belang om te realiseren dat deze 72 uur voor de hele keten geldt, dus ook als het lek bijvoorbeeld bij een leverancier (zoals een cloud provider) plaatsvindt. Dit onderwerp dient daarom goed geborgd te zijn in de contractuele afspraken met bewerkers. Ook de communicatie over datalekken is van groot belang, zowel richting de Autoriteit Persoonsgegevens als richting de betrokkenen (indien van toepassing), maar ook intern naar de medewerkers en eventuele leveranciers, als het gaat om de afhandeling van het datalek.

Opsporen datalekken van binnenuit

Proactief zoeken naar eventuele datalekken binnen de organisatie door het uitvoeren van beveiligingstesten is belangrijk om onder meer de impact van een datalek te mitigeren (bijvoorbeeld door indien mogelijk het lek gelijk te dichten, of zelfs preventief de systemen offline te halen).

Centrale privacyhelpdesk

Het melden van datalekken dient zo eenvoudig mogelijk te zijn voor de werknemer. Hierbij kan gebruik worden gemaakt van een centrale privacyhelpdesk, die geraadpleegd kan worden wanneer een (mogelijk) datalek zich voordoet, en aangeeft waar het datalek gemeld kan worden.

6. Additionele aandachtspunten voor organisaties

Uit bovenstaande maatregelen komt naar voren dat de DPO’s het noodzakelijk achten dat organisaties de juiste mix van technologie en organisatorische processen implementeren om persoonsgegevens adequaat te beschermen. Verder zijn de ondertaande overkoepelende aandachtspunten van invloed op de privacyaanpak van een organisatie.

Samenwerking met andere organisaties

Organisaties kunnen leren van elkaars fouten. Daarom is het van belang dat zij met elkaar communiceren over de privacymaatregelen die zijn getroffen en de uitdagingen waar zij mee worstelen. Daarnaast zijn de meeste organisaties voor hun privacycompliance sterk afhankelijk van andere partijen, waarmee ze bijvoorbeeld klant- of medewerkersgegevens uitwisselen. Vanwege dit laatste punt bevelen wij ook aan om goede bewerkersafspraken te maken (dit is ook verplicht), en de bewerkers hier ook periodiek op te auditen.

Privacystrategie uitstippelen

Organisaties dienen rekening te houden met de cultuur bij het opzetten van een privacystrategie. Voor het opstellen van een privacystrategie dienen organisaties zichzelf vragen te stellen als: ‘Wat wordt er van mij als organisatie verwacht? Wat is mijn ambitie: wil ik de beste zijn op het gebied van privacy, of is voldoen aan de wet- en regelgeving voldoende? Hoe bewust zijn mijn medewerkers op het gebied van informatiebeveiliging en privacy? Wat is de impact als ik persoonsgegevens niet voldoende bescherm?’. Wat betreft die laatste vraag moeten organisaties inventariseren welke persoonsgegevens zij verwerken, en hoeveel tijd en middelen zij willen besteden aan de bescherming hiervan, rekening houdend met het risico op een datalek. ‘Het voldoen aan wet- en regelgeving is van belang, maar het voldoen aan de verwachting van de klant is misschien nog wel belangrijker. Uiteindelijk gaat het toch om de bescherming van de klant,’ aldus één van de DPO’s. Concrete voorbeelden hiervan zijn het niet verkopen of verstrekken van persoonsgegevens aan derde partijen waar niet over is gecommuniceerd, of het individueel profileren en sturen van aanbiedingen als er een product via internet is verkocht. De aard van de organisatie (welke privacygevoelige gegevens worden verwerkt en in welke mate) beïnvloedt dus hoe de organisatie om dient te gaan met het onderwerp privacy. Onze ervaring is hierbij dat organisaties privacy ook steeds vaker willen gebruiken als ‘unique selling point’ om zich positief te onderscheiden van concurrenten.

Bewustzijn van medewerkers

Ten slotte onderstrepen alle DPO’s het belang van het verhogen van het bewustzijn onder werknemers voor het adequaat beschermen van persoonsgegevens. Werknemers worden gezien als essentieel wanneer het gaat om het ontdekken van een datalek, omdat zij hier in de meeste gevallen het eerst tegenaan lopen. Het is daarom van groot belang dat werknemers een datalek kunnen herkennen en weten hoe zij hiermee om dienen te gaan. Alle (mogelijke) datalekken moeten gemeld worden bij bijvoorbeeld de DPO, zodat de DPO dit verder kan oppakken, en er geen datalek over het hoofd wordt gezien. Daarnaast is onze ervaring ook dat medewerkers in een aantal gevallen (onbewust) de ‘veroorzakers’ zijn van datalekken. Denk hierbij aan het laten rondslingeren of kwijtraken van USB-sticks of papieren met gevoelige informatie. Wij bevelen daarom aan om alle medewerkers binnen een organisatie te trainen; niet alleen de medewerkers die veel met persoonsgegevens werken, maar ook de receptie-, catering-, beveiligings- of schoonmaakmedewerkers instrueren om goed op te letten en verdachte/gevaarlijke situaties te herkennen (zoals niet-vergrendelde computers). Bewustzijn gaat verder dan alleen datalekken; medewerkers dienen goed op de hoogte te zijn van de voor hen belangrijke privacymaatregelen en andere typen privacy-incidenten. Het verhogen van privacybewustzijn van personeel kan op verschillende manieren worden bewerkstelligd.

Evenementen organiseren waarbij privacy centraal staat

Door middel van een privacycampagne (voorlichting geven, informatie verschaffen via intranet, posters) kunnen organisaties ervoor zorgen dat privacy onder de aandacht wordt gebracht van de werknemers. Zo gaf een van de DPO’s aan dat middels een privacycampagne uitdrukkelijk is gecommuniceerd dat men liever heeft dat er honderd (mogelijke) datalekken te veel worden gerapporteerd dan één te weinig, om werknemers zo aan te sporen vooral niet terughoudend te zijn met het rapporteren van een mogelijk datalek. Het is aan te raden om privacycampagnes te combineren met andere gerelateerde awarenesscampagnes, zoals beveiliging en privacy, integriteit en privacy, klantbediening en privacy, et cetera.

Trainingen (zowel verplichte e-learning per functie als klassikaal)

Het privacybewustzijn onder medewerkers is erg belangrijk bij het verzamelen van gegevens. Om privacy aan het begin van de (interne) keten (het begin van een project of gebruik van een tool) te implementeren, moeten ook de medewerkers aan het begin van de keten zich bewust zijn van de risico’s van het opslaan van privacygevoelige informatie. Trainingen kunnen in deze behoefte voorzien, zodat ook werknemers een gefundeerde beslissing kunnen nemen welke persoonsgegevens noodzakelijk zijn voor het verwerkingsdoel. Bij deze trainingen kan gebruik worden gemaakt van recente privacy-onderwerpen/-schandalen om privacy nog beter onder de aandacht te brengen. Ook kan besloten worden dat alle medewerkers verplicht zijn te slagen voor een (interne) privacytest.

Ludieke acties

Met een ludieke actie, bijvoorbeeld door middel van het uitdelen van USB-sticks, kan een organisatie zelf proberen haar medewerkers ‘privacygevoelige’ informatie te laten lekken, zonder dat zij dit door hebben. Dit creëert veel bewustzijn bij medewerkers, aangezien mensen leren door fouten te maken. Denk hierbij aan phishingacties via de mail en social engineering via de telefoon.

Privacyvragenuur

Een uurtje waarin de DPO beschikbaar is voor allerhande privacyvragen.

Een data-privacyraamwerk met het oog op de AVG

De maatregelen die genoemd zijn door de verschillende DPO’s, al dan niet reeds geïmplementeerd of met de wens om deze te implementeren, zijn geanalyseerd en samengevat in een generiek data-privacyraamwerk. Dit raamwerk verschaft inzicht in de maatregelen die organisaties dienen te nemen om persoonsgegevens te beschermen. Organisaties kunnen dit raamwerk gebruiken om de juiste privacymaatregelen te treffen ter voorbereiding op de AVG.

C-2017-3-Koetsier-t01-klein

Tabel 1. Data-privacyraamwerk. [Klik op de afbeelding voor een grotere afbeelding]

Conclusie: implementeer maatregelen op basis van de geïdentificeerde privacyrisico’s

Organisaties staan voor een uitdaging om de juiste maatregelen te treffen in voorbereiding op de veranderingen die de AVG met zich meebrengt. Om hier adequaat op te reageren kunnen organisaties het generieke data-privacyraamwerk als referentiekader gebruiken. Organisaties dienen dit te concretiseren en in lijn te brengen met de aard van hun eigen organisatie en het gestelde ambitieniveau, zodat het juiste niveau van maatregelen wordt getroffen op basis van de privacyrisico’s die de organisatie loopt.

De eerste stappen hierbij zijn het inrichten van privacyverantwoordelijkheden, het creëren van inzicht in de persoonsgegevens die worden verwerkt door verschillende afdelingen, het inventariseren van derde partijen om bewerkersovereenkomsten af te sluiten als deze er nog niet zijn, en het inrichten van een datalekproces. Door middel van deze activiteiten kan op de korte termijn resultaat worden geboekt en een basis worden gelegd voor het verder inrichten van privacyprocessen.

Literatuur

[EUCO15] European Commission, Agreement on Commission’s EU data protection reform will boost Digital Single Market, 15 december 2015.

[EUPA95] Europees Parlement en de Raad, Richtlijn 95/46/EG betreffende de bescherming van natuurlijke personen in verband met de verwerking van persoonsgegevens en betreffende het vrije verkeer van die gegevens, 24 oktober 1995.

[Koor11] R.F. Koorn en J. ter Hart, Privacy by design: from privacy policy to privacy enhancing technologies, Compact 2011/0.

[Leav65] H. Leavitt, Applied organization change in industry: structural, technical and human approaches, ‘New perspectives in organizational research’, Chichester: Wiley, 1965.

[OVER01] Overheid.nl, Wet bescherming persoonsgegevens, 2001.

[OVER16] Overheid.nl, Boetebeleidsregels Autoriteit Persoonsgegevens 2016, Staatscourant, nr. 2043, 2016.

Krachtige dashboards, samen sterker

Door beter gebruik te maken van data en analyse kan een bijdrage worden geleverd aan het overbruggen van de kloof tussen zorgprofessionals, bestuurders, toezichthouders en beleidsmakers. Kortcyclisch sturen helpt zorgorganisaties het gesprek over de kansen en risico’s die er daadwerkelijk toe doen beter te kunnen voeren. De techniek achter data en analyse is inmiddels ver genoeg ontwikkeld om deze kansen en risico’s continu te volgen, waardoor de feitelijke ontwikkelingen beter verbonden kunnen worden aan de risicobeleving.

Inleiding

Dodelijke calamiteiten binnen een ziekenhuis die niet worden gemeld bij de toezichthouder uit angst voor represailles: zomaar een voorbeeld van journalistieke onthullingen die zorgprofessionals, bestuurders, toezichthouders en beleidsmakers aan het denken zetten. De zorg is al sinds jaar en dag dagelijks in het nieuws en er is ruimte voor verbetering, denk bijvoorbeeld aan de ICT-infrastructuur die niet altijd optimaal georganiseerd is, het onvoldoende deskundig gebruik van medische technologie, het ontbreken van een verantwoorde capaciteitsbenutting of adequate managementinformatie om risico’s tijdig te signaleren. Zorgprofessionals, bestuurders, toezichthouders en beleidsmakers hebben niet altijd hetzelfde beeld van de kansen en risico’s die in de zorg spelen. In dit artikel wordt ingegaan op de vraag hoe de kloof tussen deze partijen kan worden overbrugd door beter gebruik te maken van data en analyse, en het beter benutten van dashboards.

Professionals gaan voor topzorg

De Nederlandse gezondheidszorg behoort tot de beste ter wereld ([WHO17]), ([LANC17]). Patiënten kunnen rekenen op hoogwaardige en veilige zorg, de toegankelijkheid is goed geregeld en de zorg is ook betaalbaar ([RVM14]). Er verschijnen regelmatig ranglijsten waarop Nederland hoog in de rankings staat. Gemiddeld goed scoren betekent echter ook dat niet alle onderdelen even sterk zijn. Op sommige aspecten van de zorg is Nederland slechts een middenmoter. Er is zeker aanleiding om de gezondheidszorg op een hoger niveau te krijgen. Gelukkig staat een aantal Nederlandse (academische) ziekenhuizen in de top 25 van beste ziekenhuizen in Europa ([DMM16]). Een instelling die hoog eindigt in een ranking is daar trots op. De uitgereikte bokaal of het certificaat belandt al snel op de vergadertafel van de bestuurder.

Van governance naar risicomanagement

Een ziekenhuis kan vergeleken worden met een grootwinkelbedrijf. De kwaliteit van de aangesloten ondernemingen kan verschillen. Kwaliteit is een breed begrip. Is het de bejegening van de klant die het verschil maakt, zijn het de snelle doorlooptijden, is het de pijnbestrijding of de medische ingreep zelf? En hoe wordt deze kwaliteit dan beoordeeld? Wat zijn de indicatoren die het verschil laten zien? De afgelopen jaren is er een voorwaartse beweging te zien richting uitkomst-indicatoren en werken ziekenhuizen met de PROMS (Patient Reported Outcome Measures) en PREMS (Patient Reported Experience Measures). Er is nog veel discussie over deze indicatoren en de daarbij behorende relevante processen en uitkomsten waar het daadwerkelijk om gaat. Bij de beoordeling van kwaliteit en veiligheid zijn er veel aspecten die een rol spelen. In enkele onderdelen kan een ziekenhuis een voorbeeldfunctie vervullen, terwijl op andere aspecten het ziekenhuis een belangrijke inhaalslag moet realiseren. Kwaliteits- en veiligheidsaspecten die niet goed beheerst worden vormen een risico voor de organisatie. Een juiste, volledige en tijdige registratie van de uitkomsten – en daar vervolgens consequent op sturen – bevordert de kwaliteit van de zorg ([KPMG15a]). Sinds enkele jaren staat bij veel zorgorganisaties het beter beheersen van kwaliteit- en veiligheidsrisico’s hoog op de agenda. Er wordt daarbij steeds vaker gebruikgemaakt van kortcyclisch sturen, in combinatie met het beter benutten van data en analyse. Dashboards en analytics-platformen worden steeds geavanceerder en bieden meer mogelijkheden om grote databestanden (big data) te verwerken en kritische performance-indicatoren (KPI’s) beter te ontsluiten. Met behulp van deze technologische mogelijkheden kan het kwaliteitsmanagement worden gefaciliteerd en kunnen tegelijkertijd de risico’s beter worden beheerst.

Aan de basis van risicomanagement staat de zorgprofessional die zelf moet kunnen aangeven wat belangrijk is en welke indicatoren bij een optimaal zorgproces horen. Vervolgens zijn er steeds meer mogelijkheden voor de zorgprofessionals om aan de slag te gaan met nieuwe data- en analyse-tooling, en worden de mogelijkheden van dashboards steeds geavanceerder. Kortcyclische verbetertrajecten helpen de zorgprofessional resultaten te realiseren en de zorgverbetering zichtbaar te maken. De leiding van het ziekenhuis moet deze kortcyclische verbetertrajecten ondersteunen en ook de governance van de organisatie moet daarop gericht zijn. Figuur 1 laat zien hoe de governance zich verhoudt tot het risicomanagement. Governance is een abstract begrip. Om dit begrip concreet te maken zijn er diverse gedragscodes opgesteld. In deze gedragscodes is aandacht voor de cultuur in de organisatie, de rol van het (interne) toezicht en het beloningsbeleid, maar ook wordt beschreven hoe om te gaan met het managen van risico’s. Binnen het brede begrip van governance speelt informatiemanagement een belangrijke rol. Informatiemanagement is het informatieproces dat nodig is voor het integreren van bronnen en taken om de organisatiedoelen te kunnen behalen. Zorginstellingen worden steeds afhankelijker van hun informatiestromen. Deze informatiestromen vormen de basis om kwaliteit te kunnen managen en uiteindelijk de veiligheid binnen de instellingen te garanderen op alle relevante aspecten. Risicomanagement is gericht op de belangrijkste risicothema’s van de organisatie en omvat alle acties binnen een organisatie die nodig zijn om de risico’s binnen een aanvaardbaar niveau te houden, door risico’s vroegtijdig te signaleren, mitigerende maatregelen te treffen en deze in de organisatie te blijven monitoren.

C-2017-3-Geelhoed-01-klein

Figuur 1. Samenhang tussen governance, informatiemanagement, kwaliteitsmanagement, veiligheidsmanagement en risicomanagement. [Klik op de afbeelding voor een grotere afbeelding]

Ambitie

Een praktijkvoorbeeld illustreert welke problematiek in een ziekenhuis kan spelen rond het thema kwaliteit en veiligheid. Een ziekenhuis kampt al enige tijd met tegenvallende resultaten. Een recente bestuurswisseling en een uitgelopen (en te duur) nieuwbouwproject, gecombineerd met een fusie, hebben een behoorlijke invloed gehad op de strategische slagkracht. De financiële resultaten stonden het afgelopen jaar al onder druk, en nu lijken deze ook hun weerslag te krijgen op de kwaliteit van de zorg. Bij de presentatie van de jaarlijkse sterftecijfers zit het ziekenhuis aan de onderkant van de markt. Ook op signalen als de onverwacht lange opnameduur, de complicatieregistratie en reviews op sociale media scoort het ziekenhuis steeds minder goed. In de media eindigt het ziekenhuis steevast in de categorie minst presterende instellingen.

Het bestuur heeft het gevoel zelf de regie niet meer in handen te hebben en vooral te moeten voldoen aan de verantwoordingseisen van banken, verzekeraars, de inspectie en organisaties die komen accrediteren. Het bestuur wil het tij dus keren. Wat is ervoor nodig om zichtbaar en structureel de kwaliteit te verbeteren, zelf beter in control te komen, de risico’s beter te beheersen en los te komen van het managen van incidenten?

Samen aan de slag

Door cruciale kwaliteits- en veiligheidssignalen te volgen wordt de basis gelegd voor kwaliteitsverbetering ([KPMG15b]). Wat zijn de signalen die van cruciaal belang zijn voor artsen en verpleegkundigen? Belangrijk is in ieder geval dat deze signalen zorgverleners helpen de kwaliteit van hun zorgverlening te kunnen verbeteren. Artsen en verpleegkundigen hebben hier meestal uitgesproken ideeën over, en zij zien het nut niet in van – buitenaf opgelegde – registraties voor allerlei verantwoordingsdoelen, waar de patiëntenzorg niet direct door lijkt te verbeteren. Zo zien dokters niet altijd de meerwaarde van het registreren van de sterftecijfers, zoals dat landelijk wordt voorgeschreven. Op enkele afdelingen worden daarom eigen registraties met eigen definities bijgehouden, omdat deze meer zouden zeggen. In een ander ziekenhuis moesten er dubbele registraties worden bijgehouden voor de registratie van geneesmiddelen. Het registratiesysteem van de apotheek lag namelijk niet in lijn met de werkprocessen binnen het ziekenhuis, wat leidde tot veel onbegrip bij verpleegkundigen. Onze ervaring is dat de basis van een goede aanpak begint bij de zorgprofessionals. Samen met artsen en verpleegkundigen kunnen de kwaliteitssignalen (indicatoren) worden benoemd die de grootste impact hebben. Die impact kan betrekking hebben op het verkrijgen van betere en betrouwbare registraties, maar ook op de inhoudelijke kwaliteitsverbetering (bijvoorbeeld indicatoren om beter te voldoen aan het veiligheidsmanagementsysteem van het ziekenhuis). Dokters en verpleegkundigen gaan samen met de data- en ICT-experts binnen het ziekenhuis en de inhoudelijk deskundigen op de verschillende thema’s aan de slag om de werkelijke zorgprestaties van het ziekenhuis inzichtelijk te maken.

Zonder frequente terugkoppeling geen verbetering

Op basis van de beschikbare gegevens wordt de zorgprofessionals een spiegel voorgehouden over de geregistreerde kwaliteits- en veiligheidsprestaties op hun afdeling. Steeds meer geavanceerde dashboards zijn hierbij behulpzaam. De grote aanbieders als Microsoft, Tableau en Qlik spelen als marktleiders goed in op nieuwe ontwikkelingen. Ook spelers als SAS, SAP en Oracle bieden steeds meer functionaliteiten voor het ontwikkelen van dashboards ([GART17]). Daarnaast komt er meer specifieke tooling op de markt, bijvoorbeeld gericht op risicobeheersing. Deze tools ontsluiten de belangrijkste informatiebronnen in een organisatie en maken het risicomanagement inzichtelijk en stuurbaar, door de mitigerende maatregelen te monitoren en verbinden aan de verantwoordelijken binnen de organisatie. KPMG maakt bijvoorbeeld gebruik van het Sofy Business Insights-platform ([KPMG17]).

C-2017-3-Geelhoed-02-klein

Figuur 2. Het Sofy Business Insights-platform. [Klik op de afbeelding voor een grotere afbeelding]

Dit instrument helpt de instelling snelle en gerichte analyses uit te voeren. Technologische ontwikkelingen moeten uiteraard ook landen in de werkprocessen. Vanuit de Lean-principes kan worden gewerkt met dagborden en snelle terugkoppeling richting de zorgprofessionals, waar veelal ook specifieke acties aan zijn verbonden. Het gesprek over de beschikbare informatie wordt nu effectiever aangegaan binnen de betrokken afdelingen. Er wordt meer gekeken naar mogelijke trends en welke informatie nodig is om te kunnen leren van en verbeteren op de zorginhoud. Een mooi voorbeeld is het terugdringen van lijnsepsis ([VMS13]). Door een aantal variabelen nauwgezet te volgen (bijvoorbeeld met regelmatige temperatuurmetingen) kan de ontwikkeling van een lijnsepsis beter onder controle worden gehouden. Hiervoor zijn gegevens nodig, en die zijn binnen het ziekenhuis (soms met wat extra hand- en spandiensten) ook steeds beter te ontsluiten. Er is niet alleen intrinsieke motivatie nodig van de zorgprofessionals, maar ook een kortcyclische terugkoppeling.

Leren en verbeteren

Het doel van het werken met signalen is niet om met mensen ‘af te rekenen’, maar leren en verbeteren. Door informatie kort-cyclisch terug te geven kan onderbouwde en inhoudelijke terugkoppeling worden gegeven aan de zorgprofessional, evenals feedback hierop. Het gesprek dat nu op de afdeling wordt gevoerd gaat niet alleen meer over cijfers, maar over patiënten die bekend zijn bij de zorgprofessionals. Niet de ‘goed/fout-vraag’, maar de vraag ‘Wat hadden we bij een patiënt anders kunnen doen?’ staat centraal. De afdelingshoofden hebben een belangrijke rol in het stimuleren van de zorgprofessionals om ook daadwerkelijk tijd te nemen voor reflectie. Elke afdeling heeft bovendien een ambassadeur die de collega’s direct motiveert om in de samenwerking continu alert te zijn op de afspraken die zijn gemaakt bij de gekozen thema’s. Deze thema’s bestaan vooral uit de thema’s van het VMS (veiligheidsmanagementsysteem). In totaal zijn er elf VMS-thema’s:

  1. voorkomen van wondinfecties na een operatie;
  2. vroege herkenning en behandeling van de vitaal bedreigde patiënt;
  3. vroege herkenning en behandeling van pijn;
  4. medicatieverificatie bij opname en ontslag;
  5. voorkomen van nierinsufficiëntie bij intravasculair gebruik van jodiumhoudende contrastmiddelen;
  6. high risk-medicatie: klaarmaken en toedienen van parenteralia;
  7. optimale zorg bij acute coronaire syndromen;
  8. voorkomen van lijnsepsis en behandeling van ernstige sepsis;
  9. kwetsbare ouderen;
  10. veilige zorg voor zieke kinderen;
  11. verwisseling van en bij patiënten.

Uit benchmarks tussen ziekenhuizen blijkt dat er nog veel kwaliteitsverbetering gerealiseerd kan worden. Figuur 3 geeft een indruk van het potentieel voor pijnmetingen in ziekenhuizen. In ziekenhuizen kan pijn goed worden bestreden. Veel ziekenhuizen streven ernaar om het aantal patiënten met een ernstige pijnscore onder de 5% te houden.

C-2017-3-Geelhoed-03

Figuur 3. Verbeterpotentieel bij pijnmetingen (metingen over 2014).

Risicomanagement is meer dan VMS

Leren en verbeteren is uiteraard niet alleen gericht op de VMS-thema’s, maar op elk onderdeel waar risico’s binnen de zorginstelling moeten worden beheerst. Een integrale benadering van risicomanagement zorgt er immers voor dat risico’s van verschillende pluimage met elkaar in verband kunnen worden gebracht. Denk bijvoorbeeld aan geregistreerde complicaties, verlengde ligduur, ziekteverzuim, medewerkerstevredenheid, productieafspraken, rentabiliteit, solvabiliteit, capaciteitsbenutting, klachten en reputatie. De basis voor risicobeheersing bestaat uit het vermogen om te leren en verbeteren, en is afhankelijk van de cultuur en het gedrag binnen de organisatie. In figuur 4 tot en met 6 staat een basismodel voor risicobeheersing in een ziekenhuis afgebeeld.

C-2017-3-Geelhoed-04

Figuur 4. Basismodel voor integraal risicomanagement.

C-2017-3-Geelhoed-05-klein

Figuur 5. Lerend vermogen. [Klik op de afbeelding voor een grotere afbeelding]

C-2017-3-Geelhoed-06-klein

Figuur 6. Cultuur en gedrag. [Klik op de afbeelding voor een grotere afbeelding]

Focus op goede en betere zorg

Met weekmetingen worden thema’s als lijnsepsis, ondervoeding en pijnmetingen al snel beter geregistreerd en hierdoor wordt de kwaliteit van de zorgverlening zichtbaar. Uiteindelijk draait het kortcyclisch sturen in de kern om een cultuur- en gedragsverandering. De kunst is om afspraken (bestaande, nieuwe en herijkte) te borgen en ingesleten gedragspatronen om te zetten naar het gewenste patroon.

C-2017-3-Geelhoed-07-klein

Figuur 7. Proces van kortcyclisch sturen. [Klik op de afbeelding voor een grotere afbeelding]

De zorgprofessionals gaan immers zelf aan de slag met de verbeteringen. Dit werk ligt geheel in het verlengde van waar de professionals voor staan. Er wordt een beroep gedaan op de professionaliteit van de mensen in de organisatie, en dat maakt het verschil ten opzichte van een opgelegd traject vanuit het bestuur. De verantwoordelijkheid ligt weer bij de zorgprofessionals en de ervaringen uit het kortcyclisch sturen kunnen worden verbreed in de organisatie. Registraties die alleen voor externe verantwoordingsdoeleinden worden bijgehouden, moeten door de organisatie kritisch worden beoordeeld. Ga het gesprek aan met de toezichthouders, om alternatieve oplossingen te bedenken voor registraties die op het eerste gezicht niet lijken bij te dragen aan een betere zorgverlening. Conform de Governancecode Zorg 2017 ([BOZ17]) gaat het immers niet om het strikt naleven van de regels (compliance), maar om de intentie uiteindelijk goede en betere zorg te verlenen, en daarover constructief met elkaar in gesprek te zijn.

Conclusie

Door beter gebruik te maken van data en analyse kan een bijdrage worden geleverd aan het overbruggen van de kloof tussen zorgprofessionals, bestuurders, toezichthouders en beleidsmakers. Kort-cyclisch sturen helpt zorgorganisaties het gesprek over de kansen en risico’s die er daadwerkelijk toe doen beter te kunnen voeren. De techniek van data-analyse is inmiddels ver genoeg ontwikkeld om kansen en risico’s continu te volgen, waardoor de feitelijke ontwikkelingen beter verbonden kunnen worden aan de risicobeleving van zorgbestuurders, toezichthouders en beleidsmakers.

KPMG begeleidt niet alleen ziekenhuizen met deze aanpak, maar bijvoorbeeld ook zorginstellingen in de GGZ en verpleeghuizen; een aanpak die aansluit bij het dagelijks werk van de zorgprofessional, maar die ook geschikt is voor de werking van het zorgsysteem op macroniveau.

Zie ook: www.kpmg.com/nl/health.

Literatuur

[BOZ17] Brancheorganisaties Zorg, Governancecode Zorg, http://www.governancecodezorg.nl/, 2017.

[DMM16] Dutch Multimedia, Wat is het beste ziekenhuis in Europa? (een top 25), http://www.dutchmultimedia.nl/wat-het-beste-ziekenhuis-in-europa-een-top-25/, 2016.

[GART17] Gartner, Magic Quadrant for Business Intelligence and Analytics Platforms, Gartner, 2017.

[KPMG15a] KPMG, Onderzoek kosten kwaliteitsmetingen, Nederlandse Vereniging van Ziekenhuizen, https://www.nvz-ziekenhuizen.nl/_library/31906, 2015.

[KPMG15b] KPMG, What works – as strong as the weakest link, creating value-based healthcare organizations, KPMG, 2015.

[KPMG17] KPMG, KPMG launches Digital Risk Platform, https://home.kpmg.com/nl/en/home/media/press-releases/2017/01/kpmg-launches-digital-risk-platform.html, 2017.

[LANC17] The Lancet, Healthcare Access and Quality Index based on mortality from causes amenable to personal health care in 195 countries and territories, 1990–2015: a novel analysis from the Global Burden of Disease Study, 2017.

[RVM14] Rijksinstituut voor Volksgezondheid en Milieu, Zorgbalans 2014 brengt prestaties van de Nederlandse gezondheidszorg in beeld, www.gezondheidszorgbalans.nl, 2014.

[VMS13] VMS Zorg Veiligheidsagenda, Voorkomen van lijnsepsis en behandeling van ernstige sepsis, http://www.vmszorg.nl/themas/sepsis/, 2013.

[WHO17] WHO, World Health Organization’s Ranking of the World’s Health Systems, 2017.

RegTech: closing the circle

RegTech is the term used for technology that facilitates the delivery of regulatory requirements more efficiently and effectively than existing capabilities ([FCA15]). It is thought that regulatory oversight and compliance will benefit tremendously from current technological progress by letting technological breakthroughs tackle the rise in volume and complexity in legislation. RegTech is seen as a new industry with the potential to lower costs for existing stakeholders, break down the barrier of entry for the new FinTech players, eliminate existing barriers with the regulatory lifecycle and possibly enable a (near) real-time regulatory regime.

Introduction

The New York Times Magazine article ‘The great A.I. awakening’ ([Lewi16]) tells the story of how cognitive technology revolutionized the Google Translate service, significantly improving the quality of its output. Translation has traditionally been a highly skilled profession, requiring among others language skills, domain know-how and creativity. Until Google embraced Artificial Intelligence (A.I.), the Google Translate service, introduced in 2006, had improved steadily, but spectacular advances hadn’t been made in recent years. Subsequently, the service is used to support the translation of text, but has so far not replaced ‘professional’ translators. However, the improvements in translation introduced in November 2016 have made such an impact that users of the service have started to challenge each other to recognize a Google translation from a ‘professional’ translation. Google’s chief executive Sundar Pichai explained during the opening of a new Google building in London in November 2016 that the progress was due to an ‘A.I. driven’ focus and that the development responsible for the gain in performance took only 9 months.

One year earlier in November 2015 the FCA, the UK Financial Conduct Authority, openly stated its support for the use of new technology to ‘facilitate the delivery of regulatory requirements more efficiently and effectively than existing capabilities’ ([FCA15]). The set of technologies that the FCA expects to revolutionize the regulatory domain are called RegTech. Similar to Google, new technologies such as A.I., machine learning and semantic models are seen as the driver to ‘predict, learn and simplify’ regulatory requirements ([FCA16]). Will RegTech have the same impact for regulatory compliance as A.I. had for Google Translate, or is RegTech a media hype?

This article provides a concise introduction into RegTech and in particular the Semantic Web. It describes the current role of the Semantic Web within the domain of regulatory compliance by focusing on two important requirements: 1) accessing legislative documents and 2) referencing legislative documents. The article makes use of examples of European regulation for the financial sector, but can be used to address legislation issues in general.

Regulatory Technology (RegTech) overview

The UK Financial Conduct Authority (FCA) was the first supervisor to use RegTech in an official document in 2015. It made a ‘call for input’ from all regulatory stakeholders in November of that year that resulted in a feedback statement published in July 2016 ([FCA16]). In this report, the responses of over 350 companies were clustered using the following four main RegTech topics, describing the technology/concepts applicable to tackling regulatory challenges:

  1. Efficiency and collaboration: technology that allows more efficient methods of sharing information. Examples are shared utilities, cloud platforms, online platforms.
  2. Integration, standards and understanding: technology that drives efficiencies by closing the gap between intention and interpretation. Examples are semantic models, data point models, shared ontologies, Application Programme Interfaces (API).
  3. Predict, learn and simplify: technology that simplifies data, allows better decision making and the creation of adaptive automation. Examples are cognitive technology, big data, machine learning, visualization.
  4. New directions: technology that allows regulation and compliance processes to be looked at differently. Examples are blockchain/distributed ledger, inbuilt compliance, biometrics.

The topics identified by the respondents to the call for input provide an overview of concepts that can be used to achieve efficient regulatory compliance. Specifically regarding access to and identification of regulation, the respondents made additional suggestions:

  • define new (and existing) regulations and case law in a machine readable format;
  • create consistency and compatibility of regulations internationally;
  • establish a common global regulatory taxonomy.

Similar RegTech studies by other organizations, such as the Institute of International Finance ([IIF16]), have more or less identified the same technologies to support regulatory compliance. The question remains: what is the current status of these technologies? Have these technologies been applied already within the domain of regulation? Is RegTech a case of ‘old wine in new bottles’? To examine this, it is useful to look at the regulatory lifecycle itself, i.e. those steps that every company has to follow to comply to rules and legislation.

The Regulatory lifecycle

Much has been said about the nature, size and complexity of financial sector regulation before and after the crisis of 2008. Many of the newly imposed rules address issues identified since then. In addition, the regulators have introduced or are in the process of introducing legislation, rules and standards specifically to cover technological developments, such as: legislation and/or guidelines for High Frequency Trading (HFT), automated/robo advice, digital payments, the distributed ledger technology and digitization in general. Thus, although the crisis itself is almost ten years old, introduction of new legislation or recasts of older rules continues and has become a way of life. Legislation itself can be discussed using four phases: 1) initiation, 2) discussion/consultation, 3) implementation/enforcement and 4) in effect (see Figure 1).

C-2017-2-Voster-01-klein

Figure 1. Regulatory Horizon Financial Sector ([KPMG17]). [Click on the image for a larger image]

However, it is generally agreed that legislation by itself is not the key to lower risks and a healthy economic environment. The ability of the stakeholders (industry and supervisors alike) to identify, assess, implement, comply to and monitor regulatory obligations is also important (see Figure 2). Early identification of and access to legislation is vital to enable those responsible to meet their responsibilities. It allows the stakeholders to provide feedback to legislators and authorities involved in writing and amending legislation. The next step in the regulatory lifecycle starts once a regulation has been officially accepted by the legislative bodies and consists of an impact and gap analysis by relevant organizations and supervisors. Following this assessment, stakeholders have to implement the identified requirements and address the resulting gaps. Once the implementation has taken place, industry and supervisors have to monitor regulatory compliance and report to the supervisors where required, thus closing the circle.

C-2017-2-Voster-02-2

Figure 2. The Regulatory Lifecycle.

A regulatory lifecycle is determined by economic and political events and by the formal regulatory process as defined by the legislator (see the box ‘The Lamfalussy process’).

The Lamfalussy process

Development of EU financial service industry regulations is determined by the Lamfalussy process, an approach introduced in 2001 (see Figure 3). The Lamfalussy process recognizes four levels (1 to 4). It may take up to ten years before all acts, standards and guidance required by the four levels are drafted, discussed, approved and enforced.

C-2017-2-Voster-03-2-klein

Figure 3. The Lamfalussy process. [Click on the image for a larger image]

The initiation of numerous applicable regulations in combination with an elaborate regulatory process means that regulation requires management attention, creativity, technological and human resources plus significant capital expenditure by all stakeholders. Not to comply is not an option, as non-compliance has legal and public consequences for financial companies such as reputation, trust and penalties. Therefore, stakeholders have to get it right. First and foremost it is important to identify, access and capture the correct requirements from the regulations: ‘show me the boy and I will show you the man’. However, there are barriers to overcome; the most significant are discussed in the next section.

Barriers to access, interpretation and linkage

What are the barriers to legislation? First of all, there is the question of copyright. Recent research has shown that ‘the current uncertainties with respect to the copyright status of primary legal materials (legislation, court decisions) and secondary legal materials such as parliamentary records and other official texts relevant to the interpretation of law, constitute a barrier to access and use’ ([Eech16]). The same paper states ‘that legal information should be ‘open’. It seems that the strong focus on licenses as an instrument to ensure openness has buried the more fundamental question of why legal information emanating from public authorities is not public domain to start with, doing away with the need for licenses’ ([Eech16]). Europe has addressed this issue in the Public Sector Information (PSI) directive. This directive provides a common legal framework for a European market for government-held data. The consistent application of the directive in national legislation remains an issue.

Apart from the copyright issue, there is the barrier due to the differences in legislation between individual EU member states and the differences between the European Union and member states. The language of the legislation is an obvious difference. Legislation at member state level is published in the official language(s) only. There is not a single common language that is supported by all member states.

The development of legislation at member state level differs significantly as well. There is no common legislative process, like the Lamfalussy process, and no compatible legislative model shared between member states. For example, in Germany detailed rules are mostly written directly in the legislation. However, UK legislation is far less detailed and companies look at what the UK prudential authority (PRA) and the conduct authority (FSA) publish in their respective rulebooks.

Member states also make use of ‘gold-plating’. Gold-plating is defined by the European Commission as ‘an excess of norms, guidelines and procedures accumulated at national, regional and local levels, which interfere with the expected policy goals to be achieved by such regulation’ ([EC14]). Gold-plating undermines the ‘single market’ principle of the EU and the level playing field within one European market. The practice of gold-plating is a barrier to access to national markets, it restricts scalability and it creates extra costs for cross-border companies.

The question of linkage remains. Current legislation is characterized by numerous direct and indirect references to other international, regional and national legislation, policies and standards (see Figure 4). This is due to different causes.

C-2017-2-Voster-04-klein

Figure 4. Linkage European Legislation. [Click on the image for a larger image]

One of the causes of linkage is the actual legislative process. The European legislative process, including the Lamfalussy process, supports the concept of a legislative directive and a regulation. A regulation applies directly to all member states and is binding in its entirety, whereby a directive must be transposed to national law and is binding with respect to its intended result only. The consequence of such a legislative model is that national legislative text and policies refer or link directly to applicable European regulations.

Another cause of legislative linkage is the initiation of legislation itself. Initiation is a political action and politics occurs at all levels. A large number of international financial sector legislative initiatives are agreed upon at G20 meetings. Other international agreements on environmental, military, human rights or other topics are developed in similar multilateral or bilateral meetings. Consequently, many international organizations play a role in developing legislation or standards resulting in complex, intertwined legislation and rules. This is reflected in the number of organizations that play a role in drafting or monitoring these rules and regulations. The following is a non-exhaustive list of just a few organizations that play a role in the lifecycle of financial sector legislation: the Financial Stability Board (FSB), the International Organization of Securities Commissions (IOSCO), Bank For International Settlements (BIS), the World Bank, the International Monetary Fund (IMF), the Organization for Economic Co-Operation and Development (OECD), the European Central Bank (ECB), the European Commission and the three European supervisory authorities: ESMA (Securities and Markets), EBA (Banking) and EIOPA (Insurance and Pensions).

Access to Regulatory Requirements

In general, despite the above issues, it can be said that the many international, European and national legal resources are currently accessible via the Internet, be it via many different channels. The main access point for EU (financial) regulation is ‘EUR-lex’. EUR-lex is an Internet based service that can be accessed using a browser, RSS feeds or web-services and supports multiple formats like HTML, PDF and XML. National regulation can be accessed via the EU service N-lex. Furthermore, EUR-Lex also supports the search for specific national transposition measures.

Access to European Union law within EUR-Lex is simplified by the support of CELEX (Communitatis Europeae LEX) numbers. The CELEX number is the unique identifier of each document in EUR-lex, regardless of language. An EUR-lex document is allocated a CELEX number on the basis of a document number or a date. Documents are classified in twelve sectors and CELEX allows for the identification of such a sector. Examples of sectors are: sector 1 – treaties, sector 2 – international agreements, sector 3 – legislation, section 7 – national implementing measures, etc. The sector also defines the type of document supported.

The example of the water framework directive (see Figure 5) clarifies the format of a CELEX number. The water framework directive is a legislative document, hence sector 3, accepted in the year 2000. The legislation sector supports three types of documents: a regulation (R), a directive (L) and a decision (D). In the case of the water framework directive, the CELEX number assigned is thus: 3 (sector), 2000 (year), L (for directive) and 0060 (a sequential document number).

C-2017-2-Voster-05

Figure 5. CELEX.

At the member state level all European member states have their own access channels and data formats. For example, in the Netherlands access to and search of legislation is provided via wetten.overheid.nl. In addition, related policies and standards for the financial sector, drafted by the Dutch Central Bank (DNB) and the Dutch Authority for the Financial Markets (AFM), are available via www.toezicht.dnb.nl and www.afm.nl/en/professionals/onderwerpen. Unfortunately, support for other languages but Dutch is limited. The actual legislation (wetten.overheid.nl) is available in Dutch only. Some financial topics are published by the AFM in English. The Dutch Central Bank provides a best practice, as English language versions of all topics covered in their ‘open book supervision’ are available.

The UK has a similar set-up to the Netherlands, with legislation being made available at www.legislation.gov.uk and prudential and business conduct rulebooks available via www.prarulebook.co.uk and www.handbook.fca.org.uk respectively. No other language support but English is provided.

All in all, access to regulation, standards, rules and related policies is possible but highly fragmented. A unique number per document such as CELEX is only used within EUR-lex. The exchange of data relating to legislation is severely hindered by local differences between legal systems at national, regional (EU) and international level. The next sections describe the Semantic Web and related initiatives. The Semantic Web, a set of technology standards that together support access and data formats, enable seamless digitization of law. The European and international initiative address the issue of direct and indirect linkage between the different types and levels of legislation by embracing the Semantic Web.

The Semantic Web

Standardization to access and reference legal documents is underway at both an international and European level. The goal of these initiatives is to allow for harmonized and stable referencing between national and international legislation and enable faster and more efficient data exchange, navigation, search and analysis. The majority of the initiatives build upon the concepts of the Semantic Web (see Figure 6).

C-2017-2-Voster-06-klein

Figure 6. The Semantic Web. [Click on the image for a larger image]

The Semantic Web is a concept developed by Berners-Lee, famous for inventing the world wide web and founder of the World Wide Consortium (W3C): the forum for technical development of the Web. The Semantic Web can be defined as ‘an extension of the current Web in which information is given well-defined meaning, better enabling computers and people to work in cooperation’ ([W3C17]). The world wide web is dominated by HTML, which focuses on the markup of the information, allowing for links between documents. Semantic web standards improve on this by focusing on the meaning of the information by supporting among other the concepts of metadata, taxonomy and ontology.

The difference between taxonomy and ontology

The terms taxonomy and ontology are often misunderstood and confused. A taxonomy typically classifies groups of objects that may include a hierarchy, such as the parent-child relationship. An ontology is a more complex structure that in addition to a classification describes the group of objects by naming the attributes or properties of the groups and the relationships between the attributes and groups. The ‘Nederlands Taxonomie Project’ (NTP) is an example of a Dutch taxonomy initiative based on XBRL in the accounting, tax and statistics domain.

The Semantic Web is a stack of complementary technologies (see Figure 6) and supports a wide range of concepts. The bottom layer uses two standards: the Unicode standard to provide the electronic standard to represent characters and the Uniform Resource Identifier (URI). A URI allows the naming of entities accessible on the web. The second layer is based on XML. XML is a language that supports the definition of tags to express the structure of a document and the concept of metadata allowing automated processing. The Resource Descriptor Framework (RDF) standard in the third layer enables the inclusion in documents of machine readable statements on relevant objects and properties. An RDF schema supports the concept of taxonomy (see the box ‘The difference between taxonomy and ontology’). Ontologies, the specification of concepts and conceptual relations, and rules can be defined using Rule Interchange Format (RIF) and Web Ontology Language (OWL). The top three layers of the Semantic Web support logic, the expression of complex information in formal structures, the use of this logical information and the concept of trust (confidentiality, integrity, authenticity and reliability) ([Sart11]). On top of the Semantic Web we find the applications and user interface that makes use of the underlying stack.

All in all, the Semantic Web facilitates access to information, separates content from presentation, supports references to other documents that support the Semantic Web and allows information such as metadata, taxonomy and ontology to be used by other applications and systems.

Akoma Ntosa and the European Legislation Identifier

There are two major but currently incompatible initiatives to harmonize access and references between legal documents based on the Semantic Web. The international initiative is supported by the United Nations and is called ‘Akoma Ntoso’. The European Commission has thrown its considerable weight behind a European initiative called the European Legislation Identifier (ELI).

Akoma Ntoso (‘linked hearts’ in the Akan language of West Africa) defines a set of technology-neutral electronic representations in XML format of parliamentary, legislative and judiciary documents ([Akom16]). The main purpose of the Akoma Ntoso is to develop and define a number of connected standards, to specifically define a common standard for the document format and document interchange, a schema and ontology for data and metadata (see Figure 7), plus a schema for citation and cross referencing.

C-2017-2-Voster-07-klein

Figure 7. Legislation and metadata. [Click on the image for a larger image]

There are plenty of examples of how and where the Akoma Ntoso standard is used, such as:

  • the European Parliament: to document amendments on the proposals of the European Commission and the Council of the European Union, and the reports of the parliamentary committees;
  • the Senate of Italy and the Library of Congress: for the publication of legislation.

Based on Akoma Ntoso, the Organization for the Advancement of Structured Information Standards (OASIS) has started the LegalDocML project. One of the main supporters of this project is Microsoft.

The European system to make legislation available online in a standard format started officially in 2012 and is called the European Legislation Identifier (ELI). The purpose of the ELI is to provide access to information about the EU and member state legal systems ([RDK16]). The introduction of ELI is based on a voluntary agreement between these EU member states, and its goals are similar to Akoma Ntoso, but with a European focus. ELI provides for a harmonized and stable referencing of European and member state legislation, a set of harmonized metadata and a specific language for exchanging legislation and case law in machine-readable formats.

ELI is supported by the following eight EU member states: Denmark, Finland, France, Ireland, Italy, Luxembourg, Norway, Portugal (and the United Kingdom). All nine countries have representatives in the ELI taskforce. In addition to the member states, the task force is also supported by the EU Publications Office.

Both Akoma Ntoso and ELI create a number of potential benefits ([RDK16]) ([AKO16]):

  • improving the quality and reliability of legal information online;
  • enabling easy exchange and aggregation of information by supporting indexing, analyzing and storing documents;
  • understanding of the relationships between national and regional/international legislation;
  • encouraging interoperability among information systems by structuring legislation in a standardized way, while taking account of the specific features of different legal systems;
  • making legislation available in a structured way to develop value-added services while reducing the need for local/national investments in systems and tooling;
  • shortening the time to publish and access legislation;
  • making it easier to follow up work done by governments, and promote greater accountability.

Overall both standardization initiatives support the concept of interoperability, transparency and allow for the development of more intelligent cognitive applications for legal information ([RDK16]).

Conclusion

The use of RegTech to bundle and identify technologies that can benefit regulatory compliance is a good initiative. It provides support to meet the obligations and allows all stakeholders to discuss the applicability of these technologies. The use of the Semantic Web to access, navigate and control legislative rules and regulation and encourage interoperability among related IT systems, shows that progress has been made within the regulatory domain. The Semantic Web can support the identification of legislation in a consistent manner, supports the description of the legislation using a coherent set of metadata and publish legislation and case law online in a machine-readable form.

The added value of legislative information made accessible in this way allows simple queries to be made that retrieve legislations from various legislative sources, helping national and cross-border organization to gather a complete set of relevant regulatory obligations. Metadata can be used to produce transposition timelines by type of law.

In general, the use of the Semantic Web in combination with legislative documents allows organisations to carry out control and compliance activities more efficiently in complex legal domains, such as the financial sector, where there is a need to consult numerous laws, regulations and standards from different jurisdictions ([ELIW16]).

References

[Akom16] Akoma Ntoso, XML for parliamentary, legislative & judiciary documents, March 2017, www.akomantoso.org.

[EC14] European Commission, Gold-plating in the EAFRD, Directorate General For Internal Policies, 2014.

[Eech16] Mireille van Eechoud and Lucie Guibault, International copyright reform in support of open legal information, working paper draft, September 2016.

[ELIW16] ELI Workshop, 2016.

[FCA15] Financial Conduct Authority, Call for input on supporting the development and adopters of RegTech, November 2015.

[FCA16] Financial Conduct Authority, Feedback Statement (FS16/4): Call for input on supporting the development and adopters of RegTech, July 2016.

[IIF16] The Institute of International Finance, RegTech in Financial Services: Technology Solutions for Compliance and Reporting, March 2016.

[KPMG17] KPMG, The regulatory horizon, March, 2017, http://blog.kpmg.nl/regulatory-horizon.

[Lewi16] Gideon Lewis-Kraus, The Great A.I. Awakening, The New York Times Magazine, November 14, 2016.

[RDK16] Retsinformation.dk, Easier access to European legislation with ELI, March 2016, www.retsinformation.dk.

[Sart11] G. Sartor, M. Palmirani, E. Francesconi and M.A. Biasiotti (Eds.), Legislative XML for the Semantic Web, Springer, 2011.

[W3C17] W3C, The Semantic Web Made Easy, W3C.org, 2017, www.w3.org.

The impact of digitalization and globalization on political risk

Grexit, Brexit, Trump, referenda, and the rise of populism in the European Union. 2016 was an uncertain and turbulent year in terms of political risk. For companies and investors, existing economic trends suddenly became less certain. Political risk is a term that is not regularly encountered in the risk frameworks of financial institutions. However, unexpected changes in policies could significantly impact existing business models. A hotly debated topic is to what extent the development of digitalization and policies of globalization have contributed to the emerging political risk in Western democracies, and how companies could anticipate such risk.

Introduction

Brexit, Trump and populism in the European Union; these events in 2016 led to an increased interest in political risk in Western democracies. But what has caused this recent intensification of political headwinds? An argument is that digitalization, globalization and other contemporary society characterized developments have put traditional forms of organization, governance, law enforcement and justice under pressure. In 2014, Citibank warned of what they called Vox Populi risk, a new variation of political risk defined as shifting and more volatile public opinion that poses ongoing, fast-moving risks to the business and investment environment. Indeed, earlier digitalization such as the development of the internet have eroded many traditional sectors of the world economy. In the meantime, a new wave in digitalization (blockchain, robotics) will hit affect internationalization momentum. While developments of digitalization have also created new lines of work, a large part of the electorate in Western democracies is less fortunate with these developments. People who have lost their jobs, and who are less flexible to adapt to the new economic circumstances. Brexit and the election of Donald Trump as President of the United States could be seen as a backlash from this section of the electorate. This trend in electoral behavior is seen as a new form of political risk in Western economies, and could have a significant impact on how companies will anticipate their strategy and investments. The challenge for businesses is to address these concerns of the electorate, while at the same time remaining innovative and competitive in the globalized economy.

The modern definition of political risk

Since the end of the Cold War, many believed the world to be moving towards a model of universalization. A famous example is Francis Fukuyama, who argued that increasing interconnected and interdependent markets would lead to one definite model of liberal democracies and free-market capitalism ([Fuku92]). Borders would become of less importance and nationalism would make place for internationalization. Because of interdependency and mutual economic interests, international and national conflicts would occur less frequently. In addition, the exponential growth of digital innovations would make the world a ‘global village’ and create a better understanding between different cultures. In other words, because of globalization and digitalization political risk would become less relevant in a modern digitalized and globalized world.

The field of political risk is ‘the type of risk faced by investors, corporations, and governments that political decisions, events, or conditions will affect the profitability of a business actor or the expected value of a given economic action’ ([Matt11]). A risk previously mainly applied when conducting business with oil states or emerging economies. But due to the recent political developments in traditionally stable Western democracies, political risk increasingly lies in the West as well.

In January 2016 Citi Research concluded that ‘the sense that political risks have actually increased in a more globalized and inter-connected world is hard to escape’. Citi Research distinguishes the traditional ‘Old Geopolitical Risks’, e.g. military conflict, weak and failing states, unconventional weapons risk etc. and what is called ‘New Socio-Economic Risks’, which includes Citi Research’s own concept of Vox Populi risk. This includes the rise of new and non-mainstream parties, populism and more protests and referenda. Although there have been periods of Vox Populi risk throughout history, the difference today is that these events are happening in the world’s most developed markets, many of which have enjoyed a sustained period of growth and improvements in living standards and are integrated into the global economy and financial system. What is causing this change? Citi Research believes Vox Populi risk is being fueled by growing perceptions of incoming inequality and anxiety about globalization, particularly amongst the middle classes. In developed markets, this has resulted in new and alternative political parties which are having an impact on the public and economic policies ([Citi14]).

The post global financial crisis also saw the return of political risks to developed economies. Citi Research’s Political Analysis stated in its research that it now spends at least as much time monitoring non-mainstream party politics in developed economies as the emerging market-based geopolitical risks, for the first time in 20 years. The annual average number of elections, government collapses and mass protests (called Vox Populi risk events) have increased by a remarkable 54% since 2011 compared to the previous decade. In addition, they see little sign of this trend of political risk reversing ([Citi14]).

Globalization and digitalization: are they interdependent?

In the last three decades it has been seen that globalization and digitalization have gone hand in hand in shaping our world in an unprecedented manner. While the global economy has been changing rapidly since the industrial revolution at the end of the 19th century, the exponential growth of technology has changed our world faster than ever before. Since 1990, manufacturing jobs have moved to countries with lower income standards, and at the same time digital technologies have vastly improved. Less people are now needed for the same amount of work. The digitalization and globalization of the economy has eroded national sovereignty, reshaped conceptions of materiality and place, and facilitated new circulations of culture, capital, commodities, and people.

While globalization and digitalization complement each other, they are not mutually dependent. Digitalization comes forth as a more natural and logical process of evolving and innovating for less efficient processes. As humans we constantly strive for improvement and efficiency to increase our standard of living. While digitalization eroded many traditional sectors of the world economy it has also created new lines of work. A large scale study by Deloitte in 2015 ([Delo15]) showed the impact of technology on the economy of work between 1871 and 2011. The research concluded that technology has broadly created more jobs and that each development has not directly replaced human workers without finding new jobs for them.

But the policies for globalization of the labor force have almost completely eradicated certain types of sectors in developed countries while not bringing much in return for the people working in those particular industries. Manufacturing work is now vastly over-represented in China, India and other developing markets compared to, for instance, Europe. The difference between globalization and digitalization is that the first is mainly a conscious political choice, while the latter is mostly client demand driven.

Due to the spread of the internet and related technological innovations, the global economy has, and still is, undergoing a fundamental structural change. This change is mainly driven by innovative-oriented and technology-oriented companies, whose business models are based on the possibilities of the internet. The internet and the current trend of digitalization have influenced and changed the dynamic of almost all industries. The last years have seen the impact of new driving forces. Today’s marketplace is strongly affected by the progress of information technology and digital information goods are gaining more importance within the economic cycle. But nowadays it is even more important to consider digital technology as a driving force for change. Looking towards the future, digital technologies will restructure branches of trade and industrial sectors through continuous innovations. On the one hand it has created the possibility to expand business areas or implement new business segments. On the other hand it displaces the ‘traditional marketplace’ due to a faster and cheaper supply chain. This can lead to a full automation of business processes in which traditionally humans fulfilled the interaction processes of the service provisions. The rapid development of robotics is a clear example of this. A further outcome of digitalization is that the value-chain of the company changes. Service companies, but also companies who are producing physical products are faced with information intensive value-chains that have changed the traditionally productivity-driven employment within society in a radical manner.

The combination of the process of digitalization and the policies favoring globalization have strengthened each other. In recent years it is not only traditional manufacturing jobs that have been disappearing. According to research in 2014 by the UWV (the Dutch Employee Insurance Agency), the financial services sector in the Netherlands was particularly hit hard by both globalization and digitalization ([UWV14]). As a large sector in the Netherlands (banks, insurers, pension funds, insurance brokers), the share of the total number of jobs of employees remained stable until 2006 (3.6 to 3.8 percent of total jobs). This share dropped to 3.2 percent in 2013. Meanwhile the production in the financial sector has decreased much less since 2008 than the number of jobs. According to the UWV, the cause of this employment contraction are the ongoing technological developments. Administrative processes within these sectors are becoming increasingly automated, and decision rules are now mostly defined in software. But many jobs involving IT support, of which many have replaced the traditional jobs in the financial services sector, are moved offshore ([Dunk16]). This leads to a substantial reduction in personnel which will be further completed in the coming years. Obviously, the (financial) crisis has also played a role: banks are having severe problems as there is less need for financial services and banks are more cautious about providing loans. Since the world economy is now getting back on track, the UWV predicts an increasing demand for financial services employees in the short term, but also expects employment will continue to decrease in the long run.

Winners and losers of the new global village

The recent developments in politics have shown new interest in political risk and to find the underlying causes. In that respect the election of Donald Trump and Brexit, the most recent and prominent examples of Vox Populi risk, have shown that a large part of the electorate does not agree with the policies in favor of globalization and have difficulty catching up with the exponential growth in digitalization. Meanwhile at transnational corporations a new wave of digitalization is already on the horizon (blockchain, robotics, enterprise of things) and the job prospects for blue-collar workers are expected to be more threatened than ever before. Hence, it is one of the hottest topics in contemporary Western politics. The current fascination with the potential of new technologies such as robotics and blockchain help reveal the important truth that productivity increases have been the biggest and perhaps the inexorable factor reducing the number of manufacturing jobs. As seen in the previous paragraph, technological innovations now even target the service sectors as well. Most observers expect these developments to continue. In research conducted by Edelman in 2015, it was stated that innovation is also affected by trust and vice versa. The 2015 Edelman Trust Barometer ([Edel15]) finds that more than half of the global ‘informed public’ believe that the pace of development and change in business today is too fast, that business innovation is driven by greed and money rather than a desire to improve people’s lives and that there is not enough government regulation in a number of industries. They also show that countries with higher trust levels overall also show a greater willingness to trust new business innovations. Lower trust is also strongly correlated with more demand for regulation. Given that the group of people surveyed by Edelman were typically highly educated, and therefore among the key beneficiaries of globalization, these attitudes point to a widespread concern about the pace of change and dislocation ([Citi16]).

C-2017-2-Hoogeveen-01-klein

Figure 1. Stop the world, I want to get off? ‘The pace of change is…’ [Click on the image for a larger image]

C-2017-2-Hoogeveen-02-klein

Figure 2. Drivers of change in business perceived to be… [Click on the image for a larger image]

So far, the options offered by politicians and businesses for what to do about the loss of jobs are limited. While a large group of the electorate has been confronted with the looming threat of losing their jobs, politicians have promoted more international trade by negotiating free trade agreements and promoting global competition. At the same time many companies have made policy decisions that favor innovation by buying equipment over investing in its own employees and management.

The recent response of the electorate is using the only form of power they have in Western democracies; their right to vote. In his 2016 US Presidential campaign, Donald Trump stated he radically wanted to break with the economic principles that everyone had come to take for granted. More free trade, more trade agreements, more outsourcing of production and services, cheap labor of immigrants, and the transition to a green economy: it has all become less certain. Trump has claimed to revitalize the American middle class. The middle class is defined as those with an income that is two-thirds to double that of the US median household income, after incomes have been adjusted for household size ([Pew15]). Indeed, the middle class of the United States has been marginalized compared to three decades ago. The higher concentration of income and wealth at the top and the stagnation of living standards for the middle class (and those below) have already had a major impact on the public and policy debates in many Western countries.

C-2017-2-Hoogeveen-03-klein

Figure 3. Middle-income Americans are no longer in the majority (adult population by income tier, millions). [Click on the image for a larger image]

As can be seen in Figure 3 and Figure 4, the middle class in the United States is under pressure. According to economist Jared Bernstein, the middle class saw jobs go away and businesses fold in the rural communities and smaller cities where they are more likely to live. The middle class has lost factory jobs over the last several decades, as expanding trade and advancing technology pushed the economy away from production work and into services. The workers increasingly came to see trade deals as the culprit — namely the North American Free Trade Agreement with Mexico and Canada in the 1990s and the effort to open up trade with China in 2000. This economic decision has cost America at least 5 million jobs on net (The Washington Post, 2016). Trump courted the middle class by promising a restoration of the old industrial economy by renegotiating trade deals and tariffs on imports and by promising rapid economic growth from tax cuts and deregulation.

C-2017-2-Hoogeveen-04-klein

Figure 4. The share of aggregate income held by middle-income households in the United States. [Click on the image for a larger image]

This trend is also seen in other Western democracies. Therefore, political risk in the short term has become more important. One would expect that the global markets would respond to this crisis in political risk. Businesses should anticipate on this political risk and adapt to the electorate in order to regain their trust while, at the same time, keep their role as innovators to improve the quality of life.

The social role of businesses

But how can companies effectively cope with this emerging ‘Vox Populi’ risk? Companies should understand political risk; where it comes from and what could be done to in order to mitigate it.

First, it is important for companies to address the concerns of the electorate concerning the impact of globalization and digitalization on society. As stated, globalized trade policies have been a political choice and the digitalization to a much lesser extent. Meanwhile, the question whether lower production costs from offshored jobs benefit Western consumers remains to be debated. The degree to which price declines benefit consumers is largely unknown. Economist Paul Krugman wrote in 2007 ([Krug07]) that free trade with low-wage countries is a win-lose situation for many employees who find their jobs offshored or with stagnating wages. Two estimates of the impact of offshoring on U.S. jobs were between 150,000 and 300,000 per year from 2004-2015. This represents 10-15% of U.S. job creation. U.S. opinion polls indicate that between 76-95% of Americans surveyed agreed that outsourcing of production and manufacturing work to foreign countries is a reason the U.S. economy was struggling and more people aren’t being hired. Trade can at the same time lead to more goods being available at a lower price, but with the consequence of enduring unemployment and decaying infrastructures (unused factories). But even if changes in trade policy could be enacted, they won’t address the massive productivity-driven job losses in industries like manufacturing. It is important for companies to give their employees certainty. As stated, manufacturing work is now vastly over-represented in emerging markets. When taking a look at Chinese factories, these are still crowded with workers who assemble the products. While the implementation of robotics is on the rise, employees are still far from redundant. In order to mitigate Vox Populi risk in the long run, companies should reconsider the role of offshoring in their policy decisions. Offshoring shouldn’t be completely abolished, but companies should also consider the important role they fulfill in society.

Secondly, retraining workers should become one of the primary objectives for companies facing strategic changes. Instead of merely reaping the benefits of the cost reductions coming with digitalization, companies should invest a substantial amount of these resources into their own employees. In addition, companies should be able to oblige their employees to invest in themselves, whether their job is redundant or not. In Denmark, for example, companies have already adopted a proactive approach into ‘activating’ the unemployed with either on the job training in the public or private sector. In cooperation with the Danish government companies invest in both the employed and unemployed to provide practical job-related training. Underlying this model is a recognition by both the public and the private sector that unemployment in the age of globalization and digitalization is increasingly likely to be driven by a skills mismatch between candidates and the jobs available.

Thirdly, it is important for companies to embrace political risk and anticipate on it. Vox Populi risk comes forth from a certain discontent within a society. Companies should keep track of these societal developments and debates. Instead of losing touch with society, companies should stand within it by taking the leading role and anticipating its important responsibilities. A good example for addressing the concerns of the public is the KPMG True Value, the method that not only considers financial profits, but also calculates the value for society, the environment and the people. Whether a business decision involves outsourcing of production lines, or the digitalization of traditional services. It remains important to look beyond merely the financial gains.

Obviously, many other factors contribute to the surge in the politically unstable climate. These include the debates surrounding immigration, government policies, security and the growing gap between the people and politicians. By focusing on the social values and consequences of business decisions, and addressing the concerns of the people, companies could at least weather some of the social unrest and create social cohesion.  

Conclusion

This article touches upon the newly emerging political risks in Western democracies and endeavors to find a possible relationship between globalization and digitalization. A new approach in addressing contemporary political risk is necessary, because in the world of heightened political risk existing certainties for companies are falling away.

It is shown that both globalization and digitalization have had an enhanced effect on the rise of political risk. One of the underlying factors of the most recent political upheavals in the West can be traced back to years of globalization policies and the process of digitalization. Electoral results such as Brexit, the election of Trump and other political uncertainties have shown a backlash of the electorate which come with political uncertainties. These newly emerging risks have been defined by ‘Vox Populi risk’.

In order for companies to mitigate such risk, it is concluded that companies should (1) reconsider the role of offshoring production and finance in their policy decisions, (2) retrain and invest in its own employees and management for a more socially accepted role in society, and (3) embrace the newly emerging political risks from the society they operate in, and invest in the knowledge on how to anticipate it.

References

[Citi14] Taking It to the Streets: What the New Vox Populi Risk Means for Politics, the Economy and Markets. New York: Citi Group, 2014.

[Citi16] Global Political Risk: The New Convergence Between Geopolitical and Vox Populi Risks, and Why It Matters. New York: Citi Group, 2016.

[Delo15] Deloitte, Technology and People: The Job-creating Machine. London: Deloitte, 2015.

[Dunk16] E. Dunkley, Banks increase outsourcing of IT jobs in attempt to cut costs. Financial Times, June 2, 2016, https://www.ft.com/content/0950b37e-27fb-11e6-8ba3-cdd781d02d89.

[Edel15] Edelman Trust Barometer 2015, http://www.edelman.com/global-results/.

[Fuku92] F. Fukuyama, The End of History and the Last Man. New York: Free Press, 1992.

[Guha06] K. Guha and S. Briscoe, A share of the spoils: why policymakers fear ‘lumpy’ growth may not benefit all. Financial Times, August 28, 2006, http://www.ft.com/intl/cms/s/0/5a050c32-3631-11db-b249-0000779e2340.html#axzz2PPuG575g.

[Krug07] P. Krugman, Trouble with Trade. The New York Times, December 28, 2007, http://www.nytimes.com/2007/12/28/opinion/28krugman.html.

[Matt11] H. Matthee, Political risk analysis. In B. Badie, D. Berg-Schlosser and L. Morlino, International encyclopedia of political science (pp. 2011-2014). Thousand Oaks: SAGE Publications, Inc., 2011.

[Murr10] S. Murray and D. Belkin, Americans Sour on Trade. The Wall Street Journal, October 2, 2010, https://www.wsj.com/articles/SB10001424052748703466104575529753735783116.

[Newp11] F. Newport, Americans’ Top Job-Creation Idea: Stop Sending Work Overseas. Gallup, March 31, 2011, http://www.gallup.com/poll/146915/americans-top-job-creation-idea-stop-sending-work-overseas.aspx.

[Pew15] Pew Research Center, The American Middle Class Is Losing Ground. Pew Social Trends, December 9, 2015, http://www.pewsocialtrends.org/2015/12/09/the-american-middle-class-is-losing-ground/.

[Scho05] J. Scholte, The Sources of Neoliberal Globalization. United Nations Research Institute for Social Development, October 2005, http://www.unrisd.org/80256B3C005BCCF9/(httpAuxPages)/9E1C54CEEB19A314C12570B4004D0881/$file/scholte.pdf.

[UWV14] UWV, Sectoren in beeld: Ontwikkelingen, kansen en uitdagingen op de arbeidsmarkt. UWV, December 4, 2014, http://www.uwv.nl/overuwv/Images/Sectoren%20in%20beeld_analyses_def.pdf.

Governing the Amsterdam Innovation ArenA Data Lake

Enterprises feel the need to create more value out of the data they are collecting, as well as the data that is openly available. Traditional data warehouses cannot support analyses of multi-format data, giving rise to the popularity of data lakes. However data lakes require controls to be effective, data governance is of utmost importance to data lake management. Amsterdam ArenA is an example of an enterprise that joined this movement, paving the way to the creation of a smart city.

Data-driven innovation

The collection of data is greater than ever seen before. Over 2.5 quintillion bytes of data are created every day ([IBM16]) and this number is rapidly increasing. In fact, the last two years alone have seen more data created than the entire history of the human race. In line with the rapid increase of data collection, data analytics has become an increasingly popular topic. Data analytics refers to the business intelligence and analytical technologies grounded in statistical analysis and data mining. Although increasingly popular, less than 0.5% of all data has ever been used and analyzed ([Marr15]) demonstrating that much of the potential is still untapped.

Organizations are not letting the potential value slip away, 75% of organizations either have already or are currently implementing data-driven initiatives ([GART16]) ([IDG16]). The aim of these initiatives is to increase operational efficiency, improve customer relationships and make the business more data-focused. However, this is only part of the potential, as business analytics generally only considers structured data that companies collect about their operations. Innovation is about thinking outside the box, ideally it would include more than structured internal data. The possibilities when combining different datasets of different formats are endless.

One such data-driven innovation application is the development of data-driven Smart Cities. Traditional cities are extremely inefficient in terms of waste. Smart Cities aim to better control the production and distribution of resources such as food, energy, mobility and water. This can be achieved through the means of data collection and analytics. For instance, real-time data about traffic can be used to suggest alternate routes for drivers or supply levels can be altered to better meet demand based on historical purchasing data. These are just a few examples of how data can increase a city’s efficiency. Amsterdam ArenA, is an example of an organization that decided to join this movement. They have started to make use of the data that they and their partners have been collecting for years in new ways and switched their focus from the optimization of individual systems to the creation of effective network systems. This will lay the foundation for the creation of a Smart Stadium and eventually, a Smart City.

ArenA launched an initiative called the Amsterdam Innovation ArenA (AIA) that provides a safe, competition-free, open innovation platform where companies, governments and research institutions can work together to make quick advancements and test smart applications and solutions. The stadium and its surrounding area serve as a living laboratory, a hotspot where innovations are tested in a live environment. Amsterdam ArenA has a data lake which stores a large array of data that is collected internally, this ranges from Wi-Fi location data, solar panel data, video camera data, and much more. They have also installed a data analytics platform. The platform allows projects to be carried out in data labs. Data sources are gathered from the lake and combined in these analytical environments.

C-2017-1-Jeurissen-01

Figure 1. Platform Scope.

Unfortunately, integrating a number of different datasets is more complex than it sounds, think about combining video camera data (unstructured data) with a table in an Excel sheet (structured data) for example. It poses risks to the ArenA as an organization, in terms of compliance to data privacy legislation, but also the misuse of data for purposes or analyses it was not intended for. Therefore, it is important to control the use of the platform, but without lowering the innovative value of the platform, the ‘data playground’.

Data Warehouse, Data Lake: what is the difference?

The vast majority of collected data is of an unstructured nature. There are four main types of data; structured (formal scheme and data model), unstructured (no predefined data model), semi-structured (no structured data model) and mixed (various types together). Currently, only about 20% of all data is structured ([GART16]). Yet, traditional data warehouses only support structured data, meaning that the vast majority of collected data cannot be stored for analytical purposes. To resolve this, enterprises have begun using data lakes. A data lake is a storage repository that holds a vast amount of data in its native format. Neither the structure of the data nor its requirements are defined until needed. Unlike a traditional data warehouses, data lakes also support the storage of unstructured data types. In traditional data warehouses data is cleaned before it is stored, not having to do this when storing data in data lakes saves both time and money. Instead of having to clean all the data, analysts only have to clean the data that is relevant for their analysis. The costs of data storage are significantly smaller in data lakes as the architecture of the platform is designed for low-cost and scalable storage. However, there are two drawbacks to the use of data lakes, as they are still a relatively new topic the security standards of data lakes are not as high as those of data warehouses. Moreover, using mixed data formats requires experienced and skilled data scientists, who are often not present in the average organization ([Dull17]).

C-2017-1-Jeurissen-t01-klein

Table 1. Data Warehouse vs. Data Lake: key differences. [Click on the image for a larger image]

The trade-off between innovation and control

Ideally, anything would be allowed when analyzing the data in the data lake, however in practice this is impossible. On the one hand, enterprises should strive to store as much data in the lake as possible and let users have full freedom to innovate. Imagine combining real-time social media data, sales data and personalized promotions for example. The combination of this data would allow a firm to offer satisfied or dissatisfied customers (based on social media behavior) special promotions when sales are down. On the other hand, both data storage and user activity need to be controlled. There are legal mandates about the maximum storage time of specifics types of data. Video camera data may only be stored for a maximum of 4 weeks, and often even as little as 48 hours ([AUTP17]). When working with external suppliers, the data lake provider should also inspire confidence and reflect that they have control over the data lake. Data suppliers will not share their data on a platform where users handle data without restrictions. So how does one find the balance between innovation and control?

ArenA also faced this challenge when implementing their data lake and data labs. Implementing the data lake on an organizational scale, and allowing not only internal but also external users to make use of the data lake, poses risks to ArenA. Users should be given full freedom to stimulate innovation yet ArenA should maintain control over user activity to ensure data is used appropriately. ArenA also faced challenges considering privacy regulations, as part of the collected data is customer-related and saving it in its raw format infringes privacy regulations. To overcome these challenges, we developed data governance around the data lake. This enables all (external) parties to become data-suppliers in a safe and reliable manner.

Overcoming related challenges: Amsterdam ArenA

Besides the trade-off between innovation and control, two of the most common challenges enterprises face when implementing a data lake is maintaining control of what is saved and finding the right people to carry out analyses. If everything is blindly saved in the data lake, data is simply being stored and never looked at again. Actually getting value from the data is the responsibility of the end user, increasing the risk that the data becomes a collection of disconnected data pools or information silos. This phenomena is also referred to as the creation of a data swamp rather than a data lake ([Bodk15]). Try to make use of it and you will drown. Data lakes require clear guidelines on what will be saved, data definitions and quality rules. Furthermore, carrying out analyses on a wide range of different data sources requires highly skilled analysts. An assumption which is often made is that data lakes can be marketed as an enterprise tool. It is said that if a data lake is created, employees will be able to make use of it, assuming that all employees have the skills to do so. The average company has a limited number of analysts or data scientists on their payroll.

The ArenA overcame these challenges when implementing their data lake. Firstly, the recruitment of skilled staff with knowledge of existing analytics methods and applications. Amsterdam ArenA overcame this issue by creating an open-sourced analytics platform. AIA does not rely on employees alone, as they have made the platform accessible to everyone. Due to the large variety of data and the innovative nature of the platform AIA does not need to make use of generalized data quality rules. Data preparation is the responsibility of the end user. In order to avoid creating a data swamp, Amsterdam Arena stores data in the data lake using metadata (such as date, content and event information), making it easy to find specific datasets quickly and combine datasets on an event-basis. Furthermore, only unique and interesting moments of video camera data are stored, scrapping the large amounts of valueless data (e.g. video footage of an empty stadium). The data analytics platform is built on top of the data lake, and data is only loaded into a project analytical environment is a project is initiated.

The need for data governance: finding the balance

Data governance is an overarching concept which defines the roles and responsibilities of individuals throughout data creation, reading, updating and deletion. Since data lakes employ a large array of data sources, clear rules must be laid down to control operations and to comply with legal regulations. With the establishment of increasingly strict laws in the privacy domain, companies must be especially mindful that their big data operations may not be compliant. Not only must companies be compliant, they need to protect themselves from possible future developments both within their firms as well as in the market. If something goes wrong, who is held accountable? Is sensitive personal information being analyzed? Who has ownership of the data? Who decides what data may and may not be used for? What controls are in place to ensure that data is used for the right purposes? Who deletes the data once it is no longer needed? Many questions arise when considering effective big data management. These questions can be answered by implementing data governance within an organization.

Implementing data governance

The first and fundamental element of governance is a virtual organization that defines the roles and responsibilities with regards to the handling of data. Depending on the size of the organization, a number of data related roles are defined. These are distributed over three levels; strategic, tactical and operational. Generally, all accountability and data strategy decisions are made at a strategic level and day-to-day decision making takes place at a tactical level. Daily operations such as data analysis and authorization management take place at an operational level. The strategic vision serves as a guideline for what new data is added to the data lake and which projects are carried out in the data labs.

Based on the defined roles, the data lifecycle process is defined step-by-step for every activity that takes place during the process. This ensures that all individuals with data-related tasks know what their responsibilities are and which activities they need to carry out. The making of such a process flow also clarifies where the potential risks in the process lie. This allows organizations to hedge against potential risks and implement the necessary controls to mitigate them.

C-2017-1-Jeurissen-02

Figure 2. Governance Documentation.

At a tactical level, clear agreements must be made about the data and its use. This is important in order to create stable partnerships and inspire trust from external parties. Hence, data delivery agreements are made between data suppliers and data receivers. In this agreement the responsibilities of both parties are explained and agreed upon. The agreement also specifically defines both the expected content (attributes) and permitted uses of the data in question, which offers insight into the potential applications of the data and allows the organization to keep track of data and data attributes in the data lake preventing the creation of a data swamp.

At an operational level, the use of data must be controlled. Is data usage in compliance with the terms of the relevant data delivery agreement? For this reason, data usage agreements are signed by all users of the platform. To assess whether all users truly act according to the terms laid down in the data usage agreement, one of the roles in the data governance model is that of a controller, who is responsible for the continuous monitoring of user activity. An ideal analytical platform also logs all user activity making it easy to identify any wrongdoings.

Finally, there is one last control mechanism that is part of a data governance implementation; the authorization matrix. This document gives an overview of all available data and who has authorizations over the data. At any moment in time, the authorization matrix can be used to assess whether all necessary formal documentation reflects the current state of the platform.

C-2017-1-Jeurissen-03

Figure 3. Data Lifecycle Process.

The innovative governed data lake

The Amsterdam ArenA now has a running platform on which a wide variety of data is saved. From the data lake, data is periodically migrated to either the innovation platform or specific data labs for projects. These data labs are set up on a project basis when requests are made by external parties. The entire process is strictly governed and accurately documented through the means of data governance. Based on existing documentation, it is easy to assess in which stage of the process the various projects lie. During the implementation it became clear that both the data type and data transaction may influence what documentation is required. Data leaving the ArenA platform for example requires more documentation. Overall, partners feel confident in sharing their data with ArenA and many new partnerships are excepted in the near future. Similarly, there has been great interest in the platform from the user side, such as students who have been using the platform for university projects. A use case of one such project was that of students who analyzed purchasing data. They used the large food and beverage dataset to discover patterns in purchasing behavior at Amsterdam ArenA in relation to external factors such as weather, event type and customer demographics. ArenA’s analytics platform is a safe innovation playground that will play a role in developing the data scientists of the future.

Concluding

Enterprises are creating more value from data, whether this is structured, semi-structured, unstructured or mixed. Combining all available information in a data lake creates innovative ideas and new insights that will add value to the business as well as society. With data comes knowledge, and with knowledge comes power. To avoid this power being abused data lakes require data governance. Implementing data governance allows enterprises to stimulate innovation within their firms without risking loss of control over user activity.


Mitigating Third-Party Risks with Astrus

In today’s global environment dealing with the risk of doing business with third parties, e.g., clients, suppliers and agents, is becoming more and more important. We see clients struggle with mitigating the risk of doing business with these third parties. A more strategic and risk based approach is key to avoid reputation damage, liability and financial penalties.

Introduction

Risk-based due diligence is an important element in dealing with third parties and this is also considered by regulators when assessing the effectiveness of a company’s compliance program ([MOJ11]), ([POA10]), ([USDJ17]). Global transactions and regulatory scrutiny increasingly impel companies to examine their business relationships in order to assess risk, undertake informed negotiations, and comply with regulatory mandates. Failure to adequately assess clients, suppliers and agents, and to know how they operate can expose organizations to reputational damage, operational risk, governmental investigations as well as financial penalties and potential criminal liability.

To efficiently and effectively manage the third party risk, a risk-based approach is required. It is not possible or even desirable to perform the same scope of due diligence on all third parties (cost, time and effort). A risk-based approach is also reflected in regulations ([DNB15-1]) that include a component of third party risk management (TPRM) like Anti-Money Laundering and Anti-Bribery & Corruption.

An effective third-party risk program would likely include the following elements:

  1. identification of the universe of third-party intermediaries (TPIs) and those that the organization determines to be within scope (i.e. to be included in the TPRM process);
  2. managing the integrity due diligence process and risk assessment;
  3. conducting the appropriate level of integrity due diligence (IDD);
  4. ongoing monitoring of certain TPIs.

To ease the above risk-based due diligence process, KPMG developed the Astrus technology, which will be outlined in this article.

Astrus

Astrus due diligence is a cloud based solution, accessible through a portal, which provides efficient means to obtain information and assess risks associated with clients, suppliers and agents through a technology-enabled, research methodology. The result of Astrus due diligence is a report with standardized sections (see below). Astrus reports can access an extensive range of on-line public data records (more than 40.000 sources) including global sanctions and regulatory enforcement lists, corporate records, court filings, press, media and internet sources to identify important integrity and reputational information, which can be used to support due diligence assessments. Experienced Corporate Intelligence specialists, capable of dealing with 88 different languages, manually analyze and evaluate the Astrus search results. In addition, Astrus uses innovative technologies like IBM Watson Explorer to evaluate and classify results to rule out false positives, hence reducing the investigation time.

C-2016-4-Ozer-t01

Standardized reporting

An Astrus due diligence report always contains the following sections:

  1. an executive summary with all the key findings, including an overall risk indicator;
  2. background details of the entity;
  3. information relating to the shareholders;
  4. adverse press/media comment;
  5. litigation;
  6. sanctions and high-risk entity lists;
  7. key directors/principals.

C-2016-4-Ozer-01

Table 1. Example of risk indicator overview – Astrus report.

Each section contains a risk indicator, ranging from green over amber to red. The details of each section are described in the body of the report itself.

1. Executive summary

As mentioned, the executive summary summarizes all the key findings arising from the report. The overall risk indicator is determined by the highest individual risk indicator identified in each reporting section. A chain is a strong as its weakest link.

2. Background details

The Astrus technology conducts searches into a wide range of commercially-available litigation sources. The searches are narrowed to records pertaining to the subject of the enquiry, focusing on its principal place of business. The availability of online litigation information varies significantly from country to country. In those cases where there are no or limited online resources available, additional and sometimes local research is required, which can also be provided by the Corporate Intelligence team.

Examples for applying a red risk indicator for background details are when an organization is subject to regulatory supervision, is insolvent, bankrupt, or when the auditor has resigned and has drawn attention to issues of an adverse nature that have led to resignation.

Examples for applying an amber risk indicator are when there are inconsistencies identified between: company name; company number; and/or date of incorporation or when an organization is significantly loss-making, or has net liabilities.

3. Shareholders

For this section, searches into online corporate registries and international credit bureau information sources are conducted to identify the significant shareholders (>5%). Also, information to identify the ultimate beneficial shareholders (>25%) in the legal entity is attempted to be retrieved.

A red risk indicator will be assigned when for example a major shareholder (>25%) has a highly controversial reputation.

An amber risk indicator will be assigned when for example shareholder(s) cannot be identified from online public record sources, shareholder (>25%) is in administration, insolvent, bankrupt, has been liquidated, struck off or has otherwise ceased trading. The amber risk indicator is also assigned when an entity has an overly complex or opaque corporate structure (use of multiple offshore locations, trusts, foundations etc.).

4. Adverse press/media comment

This might be one of the most interesting sections. Adverse press or media comment will be highlighted concerning the target subject. Where the subject is part of a group of companies, any significant adverse press or media coverage concerning the activities of the group as a whole will also be highlighted. However, it is often not feasible to conduct detailed enquiries into the other group members, for there are companies with many, many subsidiaries.

A red risk indicator will be assigned when significant, sustained adverse press or media coverage is found, including a minimum of one high reliability source of information, for example the Wall Street Journal, Economist or Financial Times.

An amber risk indicator is assigned when for example reporting of a negative nature that is not necessarily sustained or significant is found. Or when matters of a serious nature affecting close business associates or family members are being found. Significant issues may include those such as links to fraud, money laundering, bribery or corruption, or other matters likely to give rise to a criminal offence. An amber indicator in this category may also include sustained or significant adverse reporting where the source reliability is low, such as social media or blog entries. This may also include less serious issues that are identified in high reliability sources.

5. Litigation

Within this section searches are conducted into a wide range of commercially-available litigation sources for records pertaining to the subject of the enquiry, focusing on its principal place of business. The availability of online litigation information varies significantly from country to country. Sometimes additional inquiries are required.

A red risk indicator is assigned when for example involvement as a defendant in major civil litigation, litigation initiated by a regulator or involvement in any criminal litigation is found in online resources. Also, repeated or numerous litigation as a defendant would be a ground to assign a red indicator.

An amber indicator is assigned when the entity has a litigious profile (in case the entity concerned is the plaintiff).

6. Sanctions and high-risk entities lists

For this section searches are conducted on lists of entities subject to financial sanctions and other lists of potentially high-risk entities, such as regulatory enforcement notices, law enforcement agency notices and other similar blacklists. This search includes the identification of possible Politically Exposed Persons, which is required from an Anti-Money Laundering perspective and is a high risk from a Bribery and Corruption perspective.

Examples for a red risk indicator are in case of an entity that is listed on a current financial sanctions or debarment list, if there is involvement of a director, key shareholder (>25%) or key principal of an organization who is listed on a current financial sanctions or debarment list, is an undischarged bankrupt, the subject is listed on a current regulatory enforcement list, is subject to current regulatory enforcement action, or has been subject to regulatory enforcement action or penalty in the last 12 months.

An amber indicator is assigned when the subject is formerly listed on a sanctions or debarment list, and is now discharged, formerly listed on a regulatory enforcement list (>12 months previously), provided that the action has been concluded, formerly listed on a law enforcement list, provided the action has been concluded or the individual has been discharged and there are no ongoing matters of a criminal nature, is listed as a Politically Exposed Person (current and former (within last 5 years) senior public officials, and their close family members), in case of a formerly disqualified director.

7. Key directors/principals

In this section details concerning the date of birth, nationality, education, career development, key corporate interests, adverse press and litigation are collected from online public record sources. This information is collected for all key directors which in addition will be checked against: commercially available lists of Politically Exposed Persons, financial sanctions and high-risk entities lists (see above).

Reasons for a red risk indicator can be for example misrepresentation of professional and/or academic qualifications.

An amber risk indicator is assigned when inconsistent information is identified between independent sources, e.g. date of birth information, current position or use of fictitious titles and awards.

Report on an individual

It is also possible to do an Astrus report on an individual. In this type of report, the sections ‘shareholders’ and ‘key directors/principals’ are not applicable, while the section ‘corporate interests’ is added. In the latter section, searches will be conducted within online corporate registries and international credit bureau information sources, to identify current or former corporate interests held by the individual and identify adverse press or media comment related to these interests.

Red risk indicators are raised among others in cases the entity is subject to involuntary insolvency or bankruptcy proceedings. Furthermore, the red indicator is assigned if the director or the principal has been involved in illegal or unethical conduct during their tenure of office.

An amber risk indicator is assigned in case the role or responsibility within an organization, has been overstated; the individual is involved in a large number of dissolved companies or lack of substantive information concerning source(s) of wealth.

Our vision of the future

Continuous monitoring

Doing a due diligence on a third party when entering a business relation is not enough. Things can and will change over the years and for this reason, our clients want to be informed when something significant changes on the side of their third party. This can vary from changes in ownership structure to litigation or adverse media. Astrus monitoring has been developed to mitigate the risk of changes in the risk level of a certain third party after a due diligence has been performed. Astrus monitoring monitors data sources for these significant changes and monitors adverse media and alerts the client when changes occur or new adverse media is identified. We foresee that more and more clients want to move in the direction of continuous monitoring of third parties.

New sections

In today’s world, there is a growing need for more transparency. Take for example the issue of human rights. Stakeholders want to know if a company is doing business with third parties using forced labor or child labor in their factories. Or think about the topic of food fraud. More and more we want to know what the supply chain looks like, which stakeholders are involved and what the reputation is of these stakeholders.

We foresee new sections to an Astrus report for specific needs and/or sectors. At this moment we are working on an Astrus ‘Green’ paragraph that provides the requestor with more detailed information on specific sustainability issues. For this section, new data sources are used such as certification databases.

In the future, a request for an Astrus report might look like a Chinese takeaway menu: the requestor can pick and choose which special categories that need to be included.

Predicting the future

Another trend that we foresee is prediction based on history. Due diligence investigations are often performed to identify risks which may rise when entering into a business relationship with a third party. Based on the severity of the identified risks one may decide to not enter into the business relationship or set up procedures to mitigate the risks. Determining the appropriate risk mitigating strategies would take less effort if one was able to predict the target’s behavioral pattern. This is quite difficult since the future and the target’s behavior are determined by many variables which in addition are correlated with one another. However, we believe the Astrus technology will be heading in this direction. The previous sections dealt with the different topics that constitute an Astrus report. When these topics are combined they provide valuable data on the target’s (historical) background, environment, relationships, litigation involvement, etc. Anonymizing and aggregating all Astrus reports, would populate a very large dataset which contains a vast amount of behavioral information. We believe that – in the future – such data may provide meaningful predictors to forecast any target’s behavior.

C-2016-4-Ozer-02-klein

Figure 1. Drivers to perform third-party enhanced due diligence. [Click on the image for a larger image]

Conclusion

Organizations feel the need to manage their third party risk more than ever. In the current information and data age organizations cannot hide and state that they were not aware of the risks that their business partner could pose. This is a problem that both large and smaller organizations are facing. Despite the fact that larger organizations often do have due diligence processes in place, it is still difficult to assess the risk of their entire business partner ecosystem. For smaller organization it can be difficult to have sufficient resources to assess all business partners. Solid due diligence with a tool like Astrus can help to overcome these hurdles, especially when a risk-based approach is in place.

Another effect of the information age is that society expects organizations to stay in control of their third party risk in real-time. Not only periodic due diligence, but continuous monitoring is necessary to accomplish this.

Obtaining a due diligence report is one thing, interpreting the provided results is another. Does a red risk indicator mean that you have to exit your (potential) business partner? We observe that organizations have difficulties with interpreting results from due diligence reports like Astrus. When a business partner is listed on a sanctions list this means that you cannot accept that business partner or have to terminate the relationship. With regard to the other high risk indicators the organization should be aware of the risk and implement additional measures to mitigate that high risk. Is the risk, after mitigating measures, higher than the risk appetite, the organization should consider terminating the relationship. Astrus may be a good starting point to ease the aforementioned problems.

Use case

On behalf of a global investment bank, we provide risk-based due diligence reporting on prospective and current customers across a variety of banking products and relationships around the world. We additionally provide customized and targeted due diligence reporting to assist the institution with identification of information and risk in transactions including acquisitions, joint-ventures, trade finance and other bank investments. Additionally, we provide the bank with on-demand third-party monitoring, to assist with the identification of changes in customer profiling that can affect risk rankings or KYC information for the bank’s data systems.

References

[DNB15-1] DNB, Guidance on the Anti-Money Laundering and Counter-Terrorist Financing Act and the Sanctions Act, 2015, www.toezicht.dnb.nl/en/binaries/51-212353.pdf.

[DNB15-2] DNB, Integrity Risk Analysis – More where necessary, less where possible, 2015, www.toezicht.dnb.nl/en/binaries/51-234068.pdf.

[IBM17] IBM, Watson Explorer, 2017, https://www.ibm.com/us-en/marketplace/content-analytics.

[MOJ11] Ministry of Justice, The Bribery Act 2010 Guidance, 2011.

[POA10] Parliament of Acts, Bribery Act 2010, The Stationery Office Limited, 2010.

[USDJ17] US Department of Justice, Foreign Corrupt Practices Act, 2017, https://www.justice.gov/criminal-fraud/foreign-corrupt-practices-act.

It’s Time to Embrace Continuous Monitoring

In recent years, we have observed a consistent trend towards the standardization and centralization of IT. Furthermore, Data Analytics (DA) is increasingly shaping our world. Complex analytics are supporting better and faster decisions which is driving rapid investments across all business sectors ([KPMG16]). Now after years of talking, writing and rare implementations we are currently in the midst of an era where Continuous Monitoring (CM) should also finally come to full fruition, benefiting from investments in systems and data. We expect to see more and more CM implementations in the coming years. Especially when supporters of such initiatives can convince decision makers to invest in technology for which the return on investment is difficult to determine. This article will describe a practical model which can help supporters to quantify the possible added value of CM.

Introduction

It is both ironic and disappointing that the hopeful benefits of Continuous Monitoring (CM) have still not come true. In the early years of this decade multiple articles have been written about this new and promising monitoring methodology. Advancements in information technology (IT), new laws and regulations and rapidly changing business conditions are the drivers for more timely and ongoing assurance on effectively working controls. CM was, and we think still is, a methodology which can make this possible. It enables organizations to review whether controls and system functions are working as intended on an ongoing basis.

The best has yet to come

The primary objective of any CM solution is to provide constant surveillance of data (controls and transactions) on a real or near real-time basis against a set of predetermined rule sets ([Sche13]). In case of an unexpected situation, an alarm will be triggered and a stakeholder will be notified. Such timely data enhances better oversight across the organization, it improves the efficiency of the control environment, can reduce errors and it can enhance error remediation. Unfortunately however, concrete implementations do not pop up out of the ground ([KPMG12]), ([Hill16]), ([SANS16]).

CM should not be confused with another evolving technology: Continuous Auditing (CA). CA can be used to perform audit activities on a frequent basis to provide ongoing assurance and more timely insight into risk and control issues. The main difference between these two concepts is the person responsible. CA is, as its name implies, owned by the audit function, whereas CM is a process owned by management. This article will only zoom in on CM.

The added value is acknowledged, but hard to quantify

The benefits of CM are widely analyzed in the academic literature. Not only scientists, but also organizations are aware of the possible benefits. But why are organizations still reluctant to implement CM? According to the conducted surveys and literature the major barrier relates to the quantification of the costs and returns ([KPMG12]), ([Hill16]), ([KPMG13]). Organizations are eager to learn, but shy away from high up-front investments ([Sche13]). In many risk management initiatives the costs are more apparent than the benefits. Besides that, risks are indistinct and prevented failures are barely visible.

Well this is one of the problems initiators of CM are facing when defending their business case to decisions makers. We hope that this article can help them to strengthen their business case. In the remainder of this article we will describe a systematic approach to investigate and present the added value of CM.

A first step in automating the control environment

We described that CM can be used to test the effectiveness of controls on a continuous basis. But when talking about controls we should first distinguish the different types of controls, as CM is not in all cases the best solution to perform and assess them.

Controls can be broken down into two categories: manual and automated controls. Manual controls are controls that are initiated and performed by people. Automated controls are fully implemented and performed automated systems, without the intervention of humans.

When writing about CM we need a further distinction between preventive and detective controls. Preventive controls are in place to prevent errors and inconsistencies from occurring. They are proactive and designed to keep problems away in the first place. Detective controls, on the other hand, are in place to detect errors and inconsistencies after they have happened and have been missed by preventive controls (Figure 1).

C-2016-4-Hillo-01

Figure 1. Matrix with type of controls.

Preventative and automated controls are favored ([CAPG16]), which can be illustrated by the example of a new car. Would you prefer to have a car which automatically detects a mechanical problem and that prevents you from starting the car to avoid further damage (preventative-automated control); or a car that grinds to a sudden halt when a mechanical problem is detected, ending up with high maintenance costs (manual-detective control)?

Automating controls, especially when they are preventive, will increase both the efficiency and reliability of an organization’s control environments. However, some controls cannot be turned from manual and detective, to automated and preventive. This is the point where CM enters the picture as an instrument organizations can use to further improve the effectiveness of their internal control environment (Figure 1).

CM will continuously analyze a certain behavior and will trigger an alert to the control owner in case of an exception. This control is by nature detective. However CM is able to detect anomalies automatically and can monitor this on a (near) real-time basis. We can for example shift the manual detective control of monitoring possible duplicate vendor invoices to an automated detective control. This is illustrated in the example below, where a distinction is made between the control execution and the control testing activities.

C-2016-4-Hillo-t01-klein

Table 1. Example of a manual detective control versus an automated detective control. [Click on the image for a larger image]

It sounds logical when people state that a mix of automated preventive controls together with (real-time) automated detective controls would be the optimal state for organizations. However, in almost every organization some manual controls will remain.

A supporting model that contributes to your business case

Now we have explained in which control area CM is most valuable the question arises whether and when organizations should embrace it. In order to get better insights into this question we have developed a model that assesses its potential added value, compared to the traditional approach of executing and testing controls manually.

Table 2 shows at a high level the differences between a manual detective control and an automated detective control (CM). Within a manual control environment, control owners have to perform eleven steps to execute and test this particular control. In contrast to this traditional approach, CM reduces the number of steps to four. Instead of performing all manual actions, the control owner only receives a notification when an exception has occurred or a business rule is violated.

C-2016-4-Hillo-02

Table 2. Manual detective versus automated detective.

This all seems attractive, but how can we assess the added value to support the business case? The model presented in Table 2 can help decision makers in answering the most important questions when deciding to redesign their existing manual controls: Can we save money by making use of automated detective controls? Can we improve the assurance level of our organization and does the quality of our control environment increase?

C-2016-4-Hillo-t02

Table 3. Quantifying Continuous Monitoring Model.

This model categorizes the potential benefits of a CM initiative into three different domains:

  1. efficiency;
  2. assurance;
  3. quality.

Efficiency

Performing a manual control mostly contains three activities: Executing the control, testing the control and reviewing its effectiveness. Efficiency benefits can be assessed by comparing the time it takes to perform the traditional control and the expected time to perform the redesigned automated detective control. If you multiply this with the costs of your resources, it will indicate the efficiency gains.

In contrast to the monetization of the efficiency domain, the model proposes to quantify potential assurance and quality benefits by making use of scales ranging from 1 to 5.

Assurance

With CM we can automatically assess the entire population of transactions, while in the traditional approach we normally assess the control effectives based on a sample from of the complete set. Besides that, the reporting frequency can also be enhanced. Due to a continuous working control CM is able to automatically detect anomalies and alert on a near real-time basis. By scaling the scope of transactions and reporting frequency of a traditional control and comparing it to the automated detective control, organizations can indicate possible assurance gains.

Quality

As depicted in Table 2, CM can replace human interventions by automated components which has the potential to reduce the amount of mistakes during the execution and testing of this error-prone process. Scaling the error sensitivity of performing manual controls and comparing it to the redesigned automated detective control gives organizations an indication of the quality of their control environment. The same goes for the sensitivity to fraud. By making use of automated detective controls, the opportunity of capturing fraudulent activities will increase.

How it works in practice

Let us show you how this model has been used in practice and how it can contribute to assess the added value of CM. Since 2008 an organization operation in the Consumer Goods industry has been maintaining an Internal Control Framework (ICF) that covers multiple business processes for five entities, all in different countries. In the past, an ICF created in Microsoft Excel was in place to mitigate identified risks by performing mainly manual controls. The evidence of these controls were filed in physical binders within each entity.

A few years ago this organization decided to improve the maturity of their control environment by implementing CM. They selected KPMG as their design and implementation partner and selected ten controls to be implemented in CM. This selection was purely based on the organization’s estimate of the efforts it took to perform the particular controls, but it did not take the assurance and quality aspects into account.

We assessed these controls after the implementation to determine the added value of this change from manual detective controls to automated detective controls through the introduction of CM. Two examples are explained below in Figure 2 and Figure 3. Please note that the criteria of the model in Table 3 are used in these figures. The results are presented in a Waterfall chart to indicate an increase or decrease in either monetary terms or level of the control environment. The grey color depicts the traditional control, where the green color presents the control supported by CM.

We again use the possible duplicate vendor invoices control as an example. Instead of logging on to the ERP-system, starting the program, providing parameters, running the report and analyzing the duplicate vendor invoice reports for all five different entities, CM is able to alert a specific stakeholder within the whole organization after it detects a duplicate invoice. Less man hours are necessary to execute and test this particular control, especially when realizing that the control was tested in five different entities. By using the Quantification CM model we determined that the decrease of these manual activities lead to a reduction of 180 man hours. This leads to a reduction of EUR 5.940 euro on a yearly basis, based on an average hourly wage in the Netherlands of EUR 33.

Besides the cost saving that is quantified in financial terms, the level of assurance and quality has increased. The organization for example performed this control on a weekly basis. CM ensured that the control is now executed on a near real-time basis. Furthermore, the organization has argued that they are less sensitive to errors by reducing the manual actions. Moreover, they are less sensitive to fraud due to a faster detection of possible fraudulent activities. We have summarized these benefits and depicted them in Figure 2. Another example (Figure 3) depicts the added value of CM when automating the changes to vendor master data (bank details) control.

C-2016-4-Hillo-03-klein

Figure 2. Waterfall chart showing the added value of CM for the possible duplicate vendor invoice control. [Click on the image for a larger image]

C-2016-4-Hillo-04-klein

Figure 3. Waterfall chart showing the added value of CM for the changes to vendor master data control. [Click on the image for a larger image]

Through the implementation of CM the organization can save EUR 1.386 on labor costs per year. These labor hours can be saved through a similar reduction of manual activities as with the possible duplicate vendor invoices control. The testing of this control in CM is less labor intensive than testing the traditional control. In the past, the generated SAP report contained all modifications such as a changed vendor address, zip code, representative and so on. CM enables the case organization to only assess changed bank account numbers. This has decreased the testing efforts of the control. Additionally, as with the duplicate invoice control the Quality and Assurance has increased. For example, due to more targeted and specified reports the respondent argues that the sensitivity to errors and sensitivity to fraud has decreased.

Concluding

By making use of the proposed model the organization was able to identify that the change from manual detective to automated detective controls, by the introduction of CM, was successful; in terms of cost efficiencies, the degree of assurance and the quality level of their internal control environment. The organization argued that the model can certainly be of value by the decision on whether and how to implement CM; it would certainly contribute to the business case and control selection process.

The model is a first endeavor that can be used ex-ante, where it can help organizations reviewing whether the change from manual detective to automated detective controls is worthwhile, or ex-post where it can support the organizations in evaluating the implementation of CM.

With the introduction of this model we hope to contribute to the long journey of CM. We strive to remove a piece of the existing implementation barriers. As there are just too many opportunities by the introduction of this technology, it is now time to make these visible and embrace CM!

References

[CAPG16] Capgemini, Digital Risk – Why Do We Leave the Front Door Open?, 2016.

[Hill16] R. van Hillo, Continuous Auditing and Monitoring: Continuous Value?, 2016.

[KPMG12] KPMG, Continuous Auditing and Monitoring: The Current Status and The Road Ahead, 2012.

[KPMG13] KPMG, Continuous Auditing and Monitoring: Are Promised Benefits Now Being Realized?, 2013.

[KPMG16] KPMG, Building trust in analytics: Breaking the cycle of mistrust in D&A, 2016.

[SANS16] SANS Institute, What Are Their Vulnerabilities: A SANS Survey on Continuous Monitoring, 2016.

[Sche13] B. Scherrenburg, K. Klein Tank en M. op het Veld, Continuous Auditing & Continuous Monitoring (CA/CM): How to Overcome Hesitation and Achieve Success, 2013.

Cyber Security: A Paradigm Shift in IT Auditing

With the fast increase of cyber crime, companies are regularly being compromised by hackers. In many cases this is to extract value (money, information, etc.) from the company or damage the company and disrupt business processes. These cyber security incidents not only impact the business, but also impact the financial auditor. After all, the financial auditor verifies the veracity of the financial figures as presented in the annual report. This article is to help both financial auditors and IT auditors to take account of relevant cyber security risks and determine the impact on the financial statement. “Cyber in the Audit” provides a framework and guidance for a structured approach and risk-based decision making for assurance.

Introduction

Each year cyber crime is growing stronger and stronger. This is clearly demonstrated by the increase of cyber security incidents, for example the increasing occurrence of ransomware. In addition, we see a further maturing and professionalization of cyber criminals, for example, by considering the emergence of cyber-crime-as-a-service business models that they use. In 2013 the global costs associated with cyber crime were around 100 billion dollars, increasing in 2015 to around 400 billion dollars. Continuing to rise steeply, the cyber crime cost prediction for 2017 is 1 trillion dollars, increasing to a staggering 6 trillion dollars in 2021 globally ([CybV16]). This is serious.

At board level, this trend does not go unnoticed. As such, we see that companies’ boards include cyber security risks in their top five of most important business risks ([MTRe16]). After all, most companies are completely dependent on a continuously and properly operating IT environment. This not only applies to the availability of the IT environment, but it also applies to the confidentiality of sensitive data (e.g. intellectual property and data privacy) and the reliability of the (financial) data. A disruption of the confidentiality, integrity or availability of digital data has an increasing impact on the performance and operating income of the business. This is not limited to the classic office automation, but also needs consideration regarding automated production facilities (Industrial Internet of Things like SCADA environments) and consumer devices (e.g. healthcare and automotive), for example. It is estimated that a total of 6.4 billion devices will be connected by the end of 2016 ([Gart15]). That almost equals the amount of people on this planet. Because of this “hyper connectivity” trend, the traditional IT environment of companies is stretched further and further in the public internet through automated supply chains and sourcing partners. This makes adequately controlling the IT environment and its data inherently complex.

The Relevance of Cyber Security Risks for Financial Auditors

Cyber security risks not only impact the business, but also impact the financial auditor. After all, the financial auditor verifies the veracity of the financial figures as presented in the annual report. Just like the company itself, the financial auditor strongly relies on the continuity and reliability of automated data processing. Unsurprisingly, this has been part of the Dutch Civil Code (2:393.4) for decades: “At least he (the auditor) shall make mention of his findings about the reliability and continuity of computerized data processing.” ([DCC])

Traditionally, the financial auditor relies on the testing of so-called General IT Controls (GITCs). To thoroughly understand what IT auditors are actually testing, an example is provided in Figure 1 that illustrates the user access management process (ITIL in this example).

C-2016-3-Veen-01-klein

Figure 1. User access management process example (ITIL). [Click on the image for a larger image]

In Figure 1 one can identify the different roles in the access management process which execute IT controls, for example when a person requests access to the data in the IT environment. When conducting an IT audit, an IT auditor tests the controls in this process to determine their effectiveness in design and operation. If these controls are operating effectively, a financial auditor acquires additional reasonable assurance (on top of their own control testing in the financial processes) that the integrity of financial data is ensured.

However, here is the flip side: if we take a look at the approach that a cybercriminal would take to acquire access to the data in the IT environment, this is a very different process (see Figure 2).

C-2016-3-Veen-02-klein

Figure 2. Access management process of a cyber criminal. [Click on the image for a larger image]

It is clear that there are no controls in the process as shown above. Without any approval, registration and verification, a cyber criminal can acquire access to all IT applications and (financial) data in the IT environment. In fact, the cyber criminal bypasses all internal control measures implemented in the IT applications and IT infrastructure. In addition, a cyber criminal will cover (erase) its tracks to avoid being detected by audit logging & monitoring activities for example.

Financial auditors rely on the integrity of the data a cyber criminal can change. What does that mean for the integrity of financial data in this situation?

Acknowledging this risk, the PCAOB issued guidance on cyber security risks last year. Recently, the Netherlands Institute of Chartered Accountants (NBA) published a public management letter underpinning the importance of considering this risk when perform FSAs. Furthermore, regulators are increasingly focusing on cyber security risks in their sector such as the Dutch Central Bank (DNB) in the financial sector.

In 2014, the AICPA (American Institute of Certified Public Accountants) issued CAQ Alert #2014-3 addressing the cyber security topic in the context of the External Audit ([CAQ14], [AICP14]). Unfortunately, no framework or practical approach was given. In addition, AICPA wrongly depicts the “typical access path to systems” and translates this into the wrong conclusion that the order of focus should be from application down to database and operating system, leaving out the network (perimeter). Instead, the auditor should consider the IT objects on the access path from an IT user (employee, hacker, etc.) to the data.

Just one month ago, AICPA started the “Cybersecurity Initiative”, to develop criteria that will give management the ability to consistently describe its cyber risk management program, and related guidance to enable the CPA professional to provide independent assurance on the effectiveness of the program’s design via a report designed to meet the needs of a variety of potential users ([Tysi16], [Whit16], [AICP16]). At the time of writing, the two criteria documents are still in draft. The proposal comes with an extensive list of cyber security related controls. The long list of controls is not efficiently tailored for an FSA.

At the same time, the IFAC (International Federation of Accountants) states that the effect on financial statements of laws and regulations varies considerably. As such the risk of fines for non-compliance (NOCLAR) increases. Non-compliance with laws and regulations may result in fines, litigation or other consequences for the company that may have a material effect on the financial statements ([IFAC16a], [IFAC16b]).

Such laws and regulations are proposed by the EU and implemented by the EU member states as well strengthening Europe’s cyber resilience. In 2013 the Commission put forward a proposal for a Directive concerning measures to ensure a high common level of network and information security across the Union. The Directive on the security of network and information systems (the NIS Directive) was adopted by the European Parliament on 6 July 2016. The NIS Directive provides legal measures to boost the overall level of cyber security in the EU ([EuCo16]).

The example as described and the current developments in the audit, legal and regulatory domains all concur in addressing cyber security risks as a major concern in general. As such, a financial auditor needs to consider relevant cyber security risks when conducting a financial statement audit (FSA). In addition to the traditional testing of GITCs, a financial auditor needs to assess the likelihood of GITC flip side as well.

Now, how do we address cyber security risks in the audit in a practical way? This article describes a practical approach called “Cyber in the Audit” (CitA). The approach contains the different activities to carry out, guidance for test activities and how to deal with companies that are already compromised. Finally, we address the impact of cybersecurity findings on the FSA.

A Practical Approach to Cyber in the Audit

When incorporating Cyber in the Audit activities in the traditional IT audit it is important to align these new activities as much as possible with the existing approach. This section explains the position of CitA in relation to other FSA activities and the CitA process.

Position of Cyber in the Audit

As shown in Figure 3, the IT audit supports the financial audit by testing the automated key controls. Likewise, CitA supports the IT audit, by testing the cyber security measures which prevent/detect the bypassing of the IT application and infrastructure controls.

C-2016-3-Veen-03

Figure 3. Position of Cyber in the Audit.

The CitA testing is an extension of the regular GITC testing and uses the same approach when it comes to control testing. The difference mainly lies in the topics to address and the use of technical deep dives for additional fact finding.

The CitA Process Step by Step

The flow chart in Figure 4 provides a workflow to help identify, assess and process cyber security risks in order to determine the impact on your financial statement audit. In each stage of the process, it can be decided to stop further fact finding if enough assurance on the state of cyber security controls is acquired. Each of the phases is further explained in the following sections.

C-2016-3-Veen-04

Figure 4. CitA process flow.

Determine the Relevance of CitA for the Financial Statement Audit

As part of the familiar “Understanding of IT” activities, we need to acquire an understanding of how cyber security risks are determined and controlled in the environment by extending this activity with “Understanding of Cyber”. This should not only have a technical focus (e.g. implemented security in IT-systems), but also a focus on processes (e.g. response to a cyber security incident) and governance (e.g. who is steering/reporting and responsible for cyber security risks and measures). In addition, this approach is considered to be holistic, addressing topics like Legal & Compliance and Human Factors.

This is valuable input for further determining the need for further testing of any Cyber IT Controls and/or perform “deep dive” activities. In addition, this activity helps to identify weaknesses in the holistic cyber defense of the company, which can be reported through the management letter by way of concerns for business continuity or regulatory fines (e.g. data breach notification).

An overview of such topics are illustrated in Figure 5 which is based on KPMG’s Cyber Maturity Assessment model. Of course other models can be chosen as well, such as those from ISF or NIST.

C-2016-3-Veen-05-klein

Figure 5. KPMG’s Cyber Maturity Model. [Click on the image for a larger image]

The cyber risk profile can be determined using the information from this analysis. Such a risk profile is a combination of the cyber threats the company is facing and the dependency on adequate cyber defense, which can be determined based on the understanding of cyber, but in addition on “trigger” questions such as those proposed by the NBA Public management letter ([NBA16]).

For cyber threats it is important to consider sector specific cyber threats, a high(er) chance of insider threats, primary revenue generated online, cyber fines and if the company has already been breached.

For cyber dependency it is important to take account of topics such as financial audit reliance on IT systems, most important assets (crown jewels), high level of automation, integrated supply chain and regulatory compliance.

When combined on two axis, the company is “plotted” based on the cyber threats and dependencies as shown in Figure 6. Such “plotting” has a close relationship with the sector the company is in. Typically, companies in the financial sector share common threats and dependencies (stealing money / integrity), which in itself differ greatly from for example the Manufacturing sector (sabotage/availability).

C-2016-3-Veen-06

Figure 6. Cyber risk profile plotting.

This results in a relevance rating (for example low, medium, and high) based on the cyber dependencies and cyber threats the company is facing. The rating can also be used for further selection of Cyber IT Controls.

Testing Cyber Security Measures

The second phase consists of the actual testing of IT control measures specific to cyber security. Based on the just determined cyber risk profile, one or more Cyber IT Controls (CITCs) can be selected to test. The topics that the CITCs address are Cyber security Governance, Technical hardening and Cyber security Operations. These three topics cover the protect, detect and respond measures one would expect to be in place, for example: security monitoring, cyber incident response, security awareness and cloud security. The testing of these controls follows the exact same process as the testing of GITCs and can be seen as an extension to the default GITC set of controls.

As a result of ineffective CITCs, we know that security vulnerabilities may be present in the IT environment. As such, we need to select deep dive / fact finding topics which are applicable to the situation. Such deep dives can be, for example, Red Teaming, SAP Security, Phishing activities, SIEM reviews and Cloud Security Assessment, linking to the tested CITCs. The outcome of deep dives further clarify the impact of CITC deficiencies in terms of actual technical impact. Where CITCs may be ineffective, the technical implementation may not contain security vulnerabilities after all.

Breach Investigation

In the last phase, it is important to check if the company is aware of any cyber security breach having occurred in the financial year. In addition, tooling can help to determine this if the company is not able to provide evidence for this.

In the case the company is already aware that its IT environment has been hacked (or a hack is ongoing), or that this is discovered during the fact finding activities, the following steps are a guide to help determine the impact:

  1. Determine the threat actor. What party/group/person is conducting the hack? Is this a state sponsored advanced persistent threat (APT) or just a “script kiddie”?
    This gives an indication of the magnitude and persistence of the actor.
  2. Determine the actor’s motivation. What is the goal of this hacker (group)? Are they looking to steal money, copy intellectual property / sensitive data (e.g. stock exchange data) or sabotage the production?
    This gives an indication of a possible impairment and points towards, for example, intellectual property (IP), stolen cash/fraud and/or operational sabotage.
  3. Determine actions until now. What have they been doing before they were discovered? Are there any existing logging and monitoring capabilities to determine what actions this actor has already performed? Can the logging be trusted so that it has not been tampered with by this actor?
    This gives an indication of the damage incurred until now and it can be a source for answering the first two steps.

Consider involving digital forensic experts for the above mentioned process, to make sure that the correct actions and analysis is performed in such a way that this is still of value in court.

Determine the Impact of the CitA Findings on the FSA

The results of the CITC testing, deep dives and breach investigation are aggregated to determine potential FSA impact areas. This is fed into the financial audit process in order to determine the financial audit approach and choice regarding substantive testing, can-do/did-do analysis, etc. Table 1 can be used to determine how CitA findings relate to FSA impact categories.

C-2016-3-Veen-t01-klein

Table 1. CitA Impact category and guidance. [Click on the image for a larger image]

Conclusion

With the ability to bypass all (effective) IT control measures, hackers pose a serious risk to existing accounting and internal control. With the increasing automation of our business processes and digital data becoming the single truth, financial auditors need to take these risks into account in relation to the financial statement and annual reporting. Hence, IT auditors need to change their approach and include the seeking of facts in the technical cyber security domain of their auditees.

The “Cyber in the Audit” approach explains the steps to do this, taking into account the relevance of cyber security risks for a company, the existing cyber defense capabilities and operating effectiveness thereof, and the possible breaches in the company’s IT environment. In addition, a mapping of FSA impact categories with CitA findings provides guidance for the financial auditor translation.

Without wanting to add to the “cyber FUD” (fear, uncertainty and doubt) movement, it is crucial to understand what impact cyber security risks and incidents can have in our hyper connected digital world. Do not fear cyber security – embrace it.

References

[AICP14] AICPA, CAQ Alert #2014-3, March 21, 2014, https://www.aicpa.org/interestareas/centerforauditquality/newsandpublications/caqalerts/2014/downloadabledocuments/caqalert_2014_03.pdf

[AICP16] AICPA, AICPA Cybersecurity Initiative, 2016, http://www.aicpa.org/InterestAreas/FRC/AssuranceAdvisoryServices/Pages/AICPACybersecurityInitiative.aspx

[CAQ14]Center for Audit Quality, CAQ Alert #2014-03 – Cybersecurity and the External Audit, March 21, 2014, http://www.thecaq.org/caq-alert-2014-03-cybersecurity-and-external-audit?sfvrsn=2

[CybV16] Cybersecurity Ventures, Cybersecurity Market Report, Q3 2016, http://cybersecurityventures.com/cybersecurity-market-report/

[DCC] Dutch Civil Code, Book 2, Title 2.9, Section 2.9.9 Audit, http://www.dutchcivillaw.com/legislation/dcctitle2299aa.htm#sec299

[EuCo16] European Commission, The Directive on security of network and information systems (NIS Directive), 2016, https://ec.europa.eu/digital-single-market/en/network-and-information-security-nis-directive

[Gart15] Gartner, Gartner Says 6.4 Billion Connected “Things” Will Be in Use in 2016, Up 30 Percent From 2015 (press release), November 10, 2015, http://www.gartner.com/newsroom/id/3165317

[IFAC16a] IFAC, IAASB Amends Standards to Enhance Auditor Focus on Non-Compliance with Laws and Regulations (press release), October 5, 2016, http://www.ifac.org/news-events/2016-10/iaasb-amends-standards-enhance-auditor-focus-non-compliance-laws-and-regulations

[IFAC16b] IFAC, ISA 250 (Revised), Consideration of Laws and Regulations in an Audit of Financial Statements, 2016, http://www.ifac.org/publications-resources/isa-250-revised-consideration-laws-and-regulations-audit-financial-statements

[MTRe16] MT Rendement, Vijf belangrijke bedrijfsrisico’s in beeld, August 24, 2016, https://www.rendement.nl/nieuws/id18328-vijf-belangrijke-bedrijfsrisicos-in-beeld.html

[NBA16] NBA, Van hype naar aanpak – Publieke managementletter over cybersecurity, May 2016, https://www.nba.nl/Documents/Publicaties-downloads/2016/NBA_PML_Cyber_Security_(Mrt16).pdf

[Tysi16] K. Tysiac, New path proposed for CPAs in cyber risk management, Journal of Accountancy, September 19, 2016, http://www.journalofaccountancy.com/news/2016/sep/cyber-risk-management-201615199.html

[Whit16] T. Whitehouse, CAQ: Audit’s role in cyber-security exams, September 15, 2016, https://www.complianceweek.com/blogs/accounting-auditing-update/caq-stumps-for-auditor-role-in-cyber-security-exams

Cloud Access Security Monitoring: To Broker or Not To Broker?

When moving to the cloud, enterprises need to manage multiple cloud services that can vary significantly from one to another. This, together with the modern culture of working anywhere, anytime, from any device, introduces multiple security challenges for a company to resolve. The article explores the possibility of deploying Cloud Access Security Brokers (CASBs) to help enterprises stay in control of their information security when using various cloud services.

Introduction

This year many Dutch companies were busy with cloud transformation programs, moving towards the “Cloud First” goal of their future enterprise IT. One of the key challenges enterprises are starting to face when moving to cloud is that it is extremely hard to ensure security for a variety of cloud services, each with their own unique settings and security controls, compared to the management of on-premises systems and applications. In addition, the mobility of the modern workforce is higher than ever before, when employees can easily access cloud systems and applications when off-premises and using personal devices or personal identities, not managed by the enterprise IT. This new context for enterprise IT – multiple clouds and extreme mobility, makes it hard for companies to keep up with all security risks that this new context introduces. This article examines the case of Cloud Access Security Brokers (CASBs) – a possible solution for the security of multiple cloud services in the operation of a mobile enterprise.

A State of Cloud Security in 2016

A famous Fokke & Sukke cartoon asks “Do you believe in the cloud?” ([RGvT12]). 2016 is finally the year where many of our clients are not only saying “Yes, we believe there is something”, but they are already in the middle of execution of their cloud related programs. Moving to AWS, or Azure infrastructure, shifting to Office 365 for e-mail and collaboration are no longer unique use cases for the Netherlands. Cloud is transforming from being just one out of many projects within IT to serving as an actual context for the enterprise IT existence. A typical company of 2016 is already using IaaS with their VMs running somewhere in the cloud, PaaS utilized for apps development and management, and quite possibly its CRM, ERP, e-mail or collaboration software has already been procured as SaaS. The fact that becoming a cloud user only requires a few clicks on the web and completing credit card details increases cloud adoption even more, making enterprises going off-premises just a matter of time, money, and Internet existence.

C-2016-3-Kulikova-FS

It is great to be in the middle of this enterprise transformation – when cloud technologies are becoming an essential part of IT programs. Enterprise IT was revolutionized by the Internet, and Cloud (and mobile) technologies continue this move by further liberating the workforce from the office space, and bringing offices to employees homes. Still, without proper awareness and good risk programs, situations endangering the security of organizational information can easily happen.

Consider the following example. Many corporations use cloud storage solutions for their work, for example – Microsoft OneDrive or Google Drive. When they want to share documents outside the organization, they invite external users to join their cloud folder for example in Microsoft OneDrive. An invitation is usually sent to a work e-mail address of the external user with a link to join the cloud folder. Often, due to certain settings in Microsoft, if a user already has a private Microsoft account, he can access the shared business folder with this account. All he needs is just the link; there are no other enforced authentication mechanisms. And here comes a risk for the business. Links can be easily shared; and what about finding and proactively removing all those private accounts joining a corporate cloud environment?

To address these questions and concerns, you would typically see organizations start using the combination of the words “cloud”, “security”, and “risk management”. The problem here lies in the amount of different cloud services a company needs to manage to ensure security of their critical assets. The ideal situation would be that the shift to these multiple cloud services is performed in a risk neutral way, meaning staying risk-comparable with the previous IT set up. However, it is hard to ensure security for a variety of cloud services, with their own unique settings and security controls, compared to the management of on-premises systems. Most of the cloud security risk workshops we facilitated for our clients were aimed in addressing security issues for particular cloud solutions like Office 365, Salesforce, Google for Work, Evernote, etc. While a good exercise in general, such workshops only address a particular cloud service. The strategic question would be – what should be a sustainable approach to the security of multiple, if not all, cloud solutions in the operation of an enterprise.

CASB – A Silver Bullet for Enterprise Cloud Security?

International organizations like ENISA, CSA, NIST, ISO have produced multiple articles and best practices in attempt to standardize the approach for security of cloud solutions. Yet, key cloud speakers at the 2016 RSA Conference, admitted that finding a unified way to ensure the security of cloud services is still under investigation and construction ([Fult16]). One of the key initiatives since 2015 is the Cloud Security Open API – an initiative driven by the Cloud Security Alliance to ensure that in future all cloud services and enterprise security monitoring tools can “talk” using the same APIs ([CSA15]). This will allow standardization of the security of the cloud stack and eliminate the headache of designing unique security controls for different cloud services.

While Cloud Security Open API remains work in progress another, and more importantly already existing, approach for cloud security, was mentioned multiple times during the RSA. Many presentations were talking about Cloud Access Security Brokers, or CASBs, in such a way that made them sound almost as a silver bullet for cloud security. The term “CASB” was introduced by Gartner several years ago as one of the key ways to control the business risks when moving to cloud ([Gart16]). The CASB market has grown significantly since then and is now blooming with multiple providers offering cloud security services, such as SkyHigh Networks, CloudLock, Elastica, Netskope, Adallom. Some of them have been acquired by the IT giants such as Microsoft (Adallom), BlueCoat (Elastica) or Cisco (CloudLock) to name but a few.

If you look at the market acceptance of CASB solutions ([TMR16], [MM15]), then North America and Asia-Pacific are the main regions embracing the CASBs, compared to the lower adoption rates within Europe. With the forecasted growth of the CASB market from USD 3.34 billion in 2015 to USD 7.51 billion by 2020 ([MM15]), the question is why Europe, and the Netherlands in particular, seem to have less interest in acquiring CASBs as a means to control their cloud services? In the remaining part I will explore the key benefits, drivers and pre-requisites for adopting a CASB solution, to highlight the potential of CASBs in the enterprise cloud security.

Key Security Features of CASBs

I have created Figure 1 in an attempt to illustrate the full scope of the CASB offering – why, what and how they deliver their services. CASB business case starts with the technological context in which modern corporations operate. Think about the ways in which employees can access cloud resources nowadays. They can do it by being on the enterprise network (on-premises), or on any other network (off-premises). They can login from the enterprise managed devices, such as corporate laptops and mobile devices with installed MDM, or using their private laptops and smartphones. Finally, an employee can use his work or private identity to login to the cloud service (as in my example in the beginning of this article).

C-2016-3-Kulikova-01

Figure 1. Organizational assets versus CASBs capabilities.

CASBs can help companies enhance security for all these scenarios. CASB software provides multiple security features, ranging from discovering cloud services used by employees, highlighting key risks of such usage, protecting data stored and processed in cloud, providing end user behavior analytics and performing some form of malware and threat prevention. In short, CASBs are monitoring in real time what is going on with the enterprise cloud – its ins and outs. CASBs can deliver on their promises due to their ability to integrate with already existing security tools, by analyzing traffic as a reverse or forward proxy, and by connecting directly to cloud services via their APIs (for more architecture details, refer to Gartner publications [Gart15a] and [Gart15b]).

To summarize the key security features that CASBs can deliver:

  • Cloud visibility. CASBs help enterprises to discover all cloud applications used by the enterprise employees and associated business risks. This addresses the issue of “Shadow IT” or unsanctioned apps within a company. The cloud discovery analysis will show, for example, how many different storage solutions, such as Google Drive, OneDrive, Box, Dropbox, Evernote, etc. are in use by an enterprise employees, and what the risk rating of each of those services is. To note, many enterprise on-premises tools, such as Secure Web Gateways (SWGs), can already show where their traffic goes. The advantage of CASBs is that they can also monitor traffic from users that are off-premises, and that CASBs have a large database of cloud services assessed regarding their potential security maturity that a company can rely on.
  • User behavior analytics. CASBs can provide real-time monitoring of user activities, including high-privileged actions, and alerting or blocking strange behaviors (for example, an employee downloading a large volume of data, the same user account used from different locations within a short period of time, or a user using his work-identity to connect to cloud services for private use). While many big SaaS providers also offer DLP-like functionalities, the advantage of CASBs is that rules for user behavior analytics can be set up one time and across multiple cloud platforms.
  • Data security. CASBs can act as Data Loss Prevention tools with the help of data-centric security policies such as alerting, blocking, encrypting or tokenizing data that leaves to go to the cloud. With respect to encrypting/tokenizing data, a client can choose whether to encrypt all data (less recommended) or only specific files and fields.
  • Malware detection. CASBs can help companies identify and cure malware across cloud solutions that offer API integration, such as Amazon S3, Office 365, Google for Work, and by integrating with on-premises or online anti-malware solutions and anti-virus engines. CASBs can also prevent certain devices and users from accessing cloud solutions, if required to stop malware spread.

Practical Take-Aways

KPMG has been working with CASBs in recent years, for example, as part of Cloud Security Readiness Assessment projects. Below are some of my key observations from using CASB tools at our clients about what a company wanting to adopt a CASB should consider:

  • Do not just purchase a well-known CASB, clarify the use-cases first. Understanding the use cases for which a company plans to deploy CASBs is very important. Is the client considering monitoring the user behaviors in specific SaaS or controlling overall traffic? Is just a compliance check needed when reports are being generated showing where the corporate data goes? What about access to the cloud from (unmanaged) mobile devices, does the client also want to know about this? The answers can largely affect the choice of which potential CASB provider to opt for.
  • Do not rely on default CASB settings, set up the right security policies. CASBs rely on rules or policies to generate security alerts, classify them and push that information to the built-in dashboards or to a client’s SIEM. An example would be sending an alert whenever a file with credit card data is being uploaded to the cloud, or if a user from a certain country is trying to access a cloud service. Many security operation departments lack the staff to keep up with all the alerts, and adding alerts from CASBs only aggravates the situation. Ensuring the strict policies will guarantee that the additional alerts bring actionable information and not just more noise.
  • Integrate with the enterprise IAM for the maximum benefit. To achieve the most from CASB functionality, such as the ability to alert on access to cloud services from unusual or prohibited locations, or prevent access to cloud services from unmanaged devices, it is essential that a company can connect to CASB with its enterprise Identity and Access management system (can be either on-premises IAM or IDaaS). Done correctly this will reduce the risk of unauthorized access to cloud services. For more information on using IAM for cloud solutions, please refer to [Stur11] and [Muru16].
  • Connect to cloud/on-premises SIEMs. Having one source of alerts has proven to be a better and easier way for your employees to monitor and react on cloud anomalies. Many companies already use, for example Splunk, dashboards and other on-premises security and event monitoring systems (SEIMs). Many CASBs vendors allow integration with these tools.
  • Streamline users to specific cloud providers. Finally, once a company understands where the traffic comes from and goes to and their user behavior patterns – they should build upon this knowledge by promoting specific cloud tools (for CRM, collaboration, storage, etc.) to minimize the amount of different cloud software being used for the same purpose. Banning cloud providers, for example Slack for project management, will not help much, as there will always be alternatives available (e.g. Teamwork or Trello) that users can easily switch too.

Conclusion

Even if CASBs are to be called a silver bullet for cloud security, any bullet still requires someone to shoot it. Organizations are responsible for ensuring a proper selection and integration of a potential CASB in their IT landscape. By taking into account the abovementioned considerations, enterprises that plan to deploy CASBs in order to increase their cloud security, can start their brokerage journey with a set of concrete decisions to make. This will ensure that the right CASB provider is chosen to fit the enterprise needs, and that CASB is “tuned” for the maximum security benefit of the enterprise.

References

[CSA15] CSA, Cloud Security Open API: The Future of Cloud Security, 2015, https://blog.cloudsecurityalliance.org/2015/06/29/cloud-security-open-api-the-future-of-cloud-security/

[Fult16] S.M. Fulton, RSA 2016: There Is No Cloud Security Stack Yet, The New Stack, March 2016, http://thenewstack.io/rsa-2016-no-cloud-security-stack-yet/       

[Gart15a] Gartner, Market Guide for Cloud Access Security Brokers, 2015, https://www.gartner.com/doc/3155127/market-guide-cloud-access-security

[Gart15b] Gartner, Select the Right CASB Deployment for Your SaaS Security Strategy, 2015, https://www.gartner.com/doc/3004618/select-right-casb-deployment-saas

[Gart16] Gartner, Cloud Access Security Brokers (CASBs) (definition), http://www.gartner.com/it-glossary/cloud-access-security-brokers-casbs/

[MM15] MarketsandMarkets, Cloud Access Security Brokers Market by Solution & Service, December 2015, http://www.marketsandmarkets.com/Market-Reports/cloud-access-security-brokers-market-66648604.html

[Muru16] S. Murugesan, I. Bojanova, E. Sturrus and O. Kulikova, Identity and Access Management, Encyclopedia of Cloud Computing (Chapter 33), Wiley, 2016, http://onlinelibrary.wiley.com/doi/10.1002/9781118821930.ch33/summary

[RGvT12] Reid, Geleijnse & Van Tol, Fokke & Sukke cartoon, 2012.

[Stur11] E. Sturrus, J. Steevens and W. Guensberg, Toegang tot de wolken, Compact 2011/2, https://www.compact.nl/articles/toegang-tot-de-wolken/

[TMR16] Transparency Market Research, Global Cloud Access Security Brokers Market Revenue, by Geography, TMR Analysis, March 2016, http://www.transparencymarketresearch.com/cloud-access-security-brokers-market.html

“One to serve them all”

Many companies worldwide are in the process of harmonising their IT system landscapes and centralising their hosting of several types of business and personal data across their local subsidiaries worldwide. This is not an easy feat to accomplish: besides the technical and organisational challenges associated with such a project, a variety of regulatory requirements and conditions are applicable to successfully centralise IT and data hosting and at the same time be compliant to (local) rules and regulations. This article presents an overview of the conditions companies will need to meet when they want to centralise and modernise their IT system landscape on a world-wide scale. It presents the case of a German company which had to deal with the challenges of centralisation from a regulatory and functional perspective and the process of how to achieve this. It also delivers a proven methodology and recommendations for readers who are searching for guidance and lessons learned when dealing with a project of the same nature and complexity.

Introduction

Many companies are consolidating and/or improving their IT landscape after years of relative neglect following the financial crisis of the previous years. As such, they are in the process of harmonising their system landscape across their subsidiaries. In line with this harmonisation, centralisation of IT management and hosting (at one or a limited number of locations) also becomes more apparent.

Besides practical questions with respect to technical and organisational issues, companies also need to take into account how to respect the vast amount of existing local laws and regulations. No country in the world (not even in Europe) applies exactly the same laws and regulations with respect to, for example, data storage, data retention and data (information) security.

The primary question that every company needs to answer when they are considering harmonisation is “Are you allowed to host the data in another country?” and if “Yes, but …”, then which criteria apply. These criteria can be related to some of the following questions:

  • If the company wants to transfer data across borders, what are the transfer restrictions?
  • Which retention periods apply to different types of information/documents?
  • In which format can information be stored?
  • Under what conditions is it allowed to host sensitive data?
  • How quickly should you be able to respond to data requests, either by the authorities or third parties?

The case for harmonisation

The answers to these questions differ per company and the sector they are working in. However, there are lessons to be learned that apply to any company in any sector. This is best demonstrated by describing the following case:

“An International Lease company, with corporate sites in over twenty different countries located in Europe, North America, South America as well as Asia, had to identify which conditions for the individual countries needed to be met in order to make centralised hosting of data possible. This question was related to the implementation of the new IT Strategy and subsequently the alignment of this strategy with the objectives of the business. The main goal was to harmonise the business processes and the underlying operating model and to harmonise the IT platform and landscape.”

Before the project started, the business activities were supported by eleven different contract management systems across all the countries. This had the following consequences:

  1. Relations had to be maintained with more than eleven different software suppliers. The operating systems running on those systems differed between the countries and were partly carried out by external local service providers.
  2. The ability to integrate the various country platforms into group core systems and processes is limited, which becomes more and more relevant from a group reporting perspective.
  3. Apart from the reporting aspects, time consuming roll-outs of new product introductions or global initiatives make the company less competitive and if system changes are needed, a high dependency on local key IT personnel will continue to exist.

The project’s objective was to replace the eleven applications with one standard application with limited localisation and to standardise the way of working worldwide to improve efficiency and at the same time reduce the IT costs of maintenance.

The first steps for improvement and the first lessons learned

After completion of the software selection procedure for one new contract management system a Global System Template was created for managing the leasing business as well as the financial accounting process. Subsequently, in a similar selection procedure, an IT service provider was selected to provide the data hosting services necessary to make the new IT system work in day-to-day operations. Initially, this provider was also given the following tasks for the countries within the scope of the project:

  1. Identify the local restrictions (rules & regulations) that could restrict the possibility of centralising the systems in a limited number of regional data centres.
  2. Provide an answer to the question of whether there were stricter laws/regulations for application delivery than in Germany and if there were local requirements that were blocking the centralisation of the application.
  3. Provide insight into regulatory or legal requirements that would delay or block a local entity from going live with the new system on a functional level.

This proved to be too much of a challenge for both customer and provider. Both parties formulated their initial answers to these three questions from such an operational and IT security perspective that it resulted in a list of requirements that differed vastly for each country and could be interpreted differently for each subsidiary. The second challenge was that the IT service provider was not (yet) based in all eleven countries within the scope of the project and could therefore not identify all regulatory or legal requirements that would delay or block a local entity from going live. They simply lacked the resources and knowledge to do so.

Adjusting the approach

The project looked for a party that could provide support with answering the above questions. As such the project team was asked to support both the customer and the provider in this matter. The three questions remained unchanged, but to increase the chances of success, the scope of the activities was limited to the core processes of the company and the actual roll-out of the IT system with a focus on:

  • the functional requirements of the system;
  • centralising data/systems in a data centre;
  • operating these systems in a data centre.

The regulations examined were limited to regulations that directly stated a requirement for central hosting (such as central banking regulations, banking act, tax law) and only at a high level. Regarding the requirements the following approach was used:

  1. Identification of requirements was performed based on the available documentation of the customer, legal sources, retention guides and previous research papers of earlier engagements in the field of data retention, data privacy and data transfers.
  2. Validation of requirements for the 23 countries was performed by local privacy and legal experts from the project team’s global network. An overview of the activities performed is provided below and the most important steps are further elaborated upon.

The results were used to provide insight to determine the impact of possible blocking issues per country and the identification of mitigating measures per issue. Because the roll-out of the system was planned in five waves of clustered groups of countries, the research was planned accordingly.

Consolidating a proven methodology

Based on experience in previous projects, the following methodology was set-up and validated with all stakeholders. The different steps of the methodology are as follows:

Step 1: Set-up/actualisation of a survey

To correctly identify and include all relevant functional and legal requirements a survey on transfer restrictions, privacy issues, format restrictions and retention tables needs to be developed through a series of stages. The survey can be developed by using available knowledge, similar queries and customer specific queries. The customer should review and provide feedback to customise and align the questionnaire to the customer’s specific situation. In this case, input from the earlier survey of the already mentioned IT service provider was also used to complete the list of questions.

With the questionnaire as a blueprint, the analysis of the laws and regulations focused on the identification of those regulations that directly address the rules regarding the centralisation of hosting and possible restrictions.

Step 2: Identification and categorisation of requirements per wave

During the identification and categorisation phase of the project, good practices should be used to identify the relevant requirements for all countries per wave and to judge if those requirements are consistent with each other by a core team and specialists within the project. The respective team members should complement the requirements for each country, validate the lists and provide recommendations for hosting requirements. When requirements are still missing, a reference can be made to a related standard (such as ISO27002 on Information Security) or to the requirement of a directly neighbouring country with similar laws and regulations. See Table 1 for an example specifically focused on data retention.

C-2016-2-Kromhout-t01-klein

Table 1. Sample of list of requirements for data retention. [Click on the image for a larger image]

In this case, after the delivery of the requirements of the first wave, specialists from India were included in the core team to speed up the progress to accommodate the planning of the customer.

In parallel, local experts were identified and contacted to validate the identified requirements for the corresponding 23 countries.

Step 3: Provide (re-)usable insights

After validation of the requirements, the next step is to gain a solid understanding of the results and apply these to the objectives of the customer. Using the recommendations of the specialist international network the core team should be able to interpret the legal requirements in such a way that country specifics are taken into consideration, without losing the overall view on all countries.

By gathering information on hosting requirements and conversing with the customer the project team is able to formulate recommendations on how to proceed with the harmonisation of the systems on a functional level and centralisation of hosting.

For this project, Germany was used as a starting point for developing functional requirements as it deals with the most strict requirements (from a legal perspective) and main centralisation was deemed to be in Germany. German locals took a leading role in this process based on their experience with specific German requirements and with the customer. The results of the requirements on hosting were subsequently clustered in a set of conditions that apply in general to all the countries within the scope of the project (see Table 2).

C-2016-2-Kromhout-t02-klein

Table 2. Summary of conditions and some examples of conditions per country. [Click on the image for a larger image]

Analysing the results and providing recommendations

The results of the identification of requirements show a lot of similarities of general conditions for the different countries worldwide. For Russia and Turkey it was not allowed to store data outside the country (see Figure 1). For the other countries it was allowed to store data outside the country but under the condition that the country in which information is stored guarantees an adequate level of protection. The US was no longer deemed adequate by the European Court of Justice, as data transfers between the EU and US under Safe Harbour were ruled invalid on 6 October 2015, so additional mitigating measures are necessary.

C-2016-2-Kromhout-01-klein

Figure 1. Overview of conditions per country. [Click on the image for a larger image]

Based on these results the following recommendations are to be taken into account:

  • Notify or obtain approval from the authorities for the hosting data. Prior to hosting data outside the particular countries it is advised to notify or obtain approval from the particular authorities. For the countries in which data should be available on-site for inspection by the authorities it is recommended to periodically send copies of the database to that country (or have online access to this data).
  • Store all physical documents locally and ensure the possibility of a timely response of delivering digital data. To ensure timely response to inquiries from the authorities for inspection of the data or documents we recommend, for all of the countries in which a local subsidiary is present, to store and archive physical documents locally. We also recommend to ensure (online) timely access to systems and have a policy or procedure in place in case data access requests occur (either by government or data subject access requests from individuals with regard to personal data).
  • Make clear agreements with third parties when processing personal data. When personal data is processed or transferred to a third party it is advised to take preventive measures. An example of such a measure is a formalised data processing agreement with the third party to have them adhere to a company’s security and privacy policy. To comply with privacy laws and regulatory requirements it is further advised to identify and map the current data flows to get insight into international transfers and whether data is transferred to countries that do not provide an adequate level of protection.
    For these particular countries companies should apply alternative measures to ensure compliance (i.e. model contract clauses and approval of the European Commission, binding corporate rules).
  • Develop and implement a security and privacy baseline to ensure compliance with local requirements. We recommend to develop and implement an organisational security and privacy baseline based on ‘good practices’ (e.g. ISO27002, Data Protection Acts, etc.) to comply with local regulatory requirements. This baseline should address anonymisation of test data and security of test environments to prevent data breaches from happening. The baseline should also include upcoming changes on EU privacy law.
  • Develop a records management[Records management is mostly focused on archiving unstructured data and related metadata. For a detailed approach on how to set-up and implement data archiving for structured data, see [Tege12].] policy with a records retention schedule. We recommend to develop/extend the records management policy for the countries in which Deutsche Leasing operates ([Tege12]). This policy should include a records retention schedule for different data categories and different document types (to include unstructured data such as documents on file shares). A record management policy should ensure integrity and authenticity of stored/archived records as elaborated upon in ‘good practices’ in the market (e.g. ISO15489). A records management policy should also address the topic of data migrations.
    In the case of partial data migrations at the company, data of decommissioned systems should remain legible for the retention period, meaning that this data and archived data should be accessible and readable even if there is no platform to mount and read the data. This implies that data should be stored in a sustainable format.

Conclusions

What are the lessons learned from this project?

First of all, stick to what you know and be honest about what you do not know. The combined efforts of the company and the IT service provider were to be recommended, but to provide for the necessary world-wide insight into regulations on data you need to have the experience, expertise and the capacity to deliver.

Secondly, focus on similarities between countries and not on the limitations. Of course when investigating over twenty countries on regulations and guidelines, the result will always be over twenty different sets of requirements. But, in all cases some generic conditions can always be identified that should be taken into account when moving systems and data across countries in order to be able to centralise hosting. In essence, there are more possibilities than it seems at a first glance. It does help if the main hosting country is one of the countries with the strictest rules. This simplifies the condition that the rules and regulations in the hosting country should have at least the minimum level of the originating country in order to comply with rules and regulations of these countries. In general, centralised hosting is possible within Europe, leaving out the odd ones such as Russia and Turkey.

Thirdly, regulations always need to be interpreted. A judge is not a machine, so a company always needs to explain how they deal with compliance to certain regulations. It is interesting to see that companies tend to forget that they need to allocate time and resources beforehand to do exactly that interpretation. The reason for this could be the general misconception that regulations are absolute and complete and therefore they need to be obeyed strictly. In dealing with requirements for 24 countries a company will soon enough realise that this is just not feasible. Having someone on your team who can translate requirements to actions in your daily business and who can provide an overview of the similarities between jurisdictions is not only recommended, but even a critical precondition for success.

Finally, please note that laws and regulations may sometimes already be outdated during the investigation as new rules are being implemented all the time or existing rules (such as data transfers to the US) might be part of political discussions. For this reason you always need to timestamp your assessment when dealing with regulatory supervisory bodies and implement a maintenance process of actualising your earlier results on a structural base.

Reference

[Tege12] J.A.C. Tegelaar, P. Kuiters and J.M.B. Geurtsen, Data archiving in a digital world. Roadmap to archiving structured data, Compact 2012/2.