


The combination of Prescriptive Analytics methodologies and risk management, stress tests and scenario analysis has the potential to help companies make robust optimal decisions. The starting point of successful Prescriptive Analytics projects are forecasts that leverage a systematic identification and quantification of risks. This is the input for mathematical optimization models that reflect all the trade-offs in place and that are aligned with the goals of an organization. This article describes challenges and best practices in Prescriptive Analytics.
Introduction
Decision making is at the heart of a competitive advantage for any organization. Despite heavy investments in big data, business intelligence and forecasting systems powered by machine learning and econometrics, 41% of companies struggled to turn their data into strong business decisions in 2020 ([Benn21]). While most organizations acknowledge the need to become more data-driven, many organizations are failing to achieve this goal. Only 48% of organizations expect a significant return from investments in data & analytics within the next three years ([Goed18]). How can organizations translate data into optimal decisions and generate value from their investments?
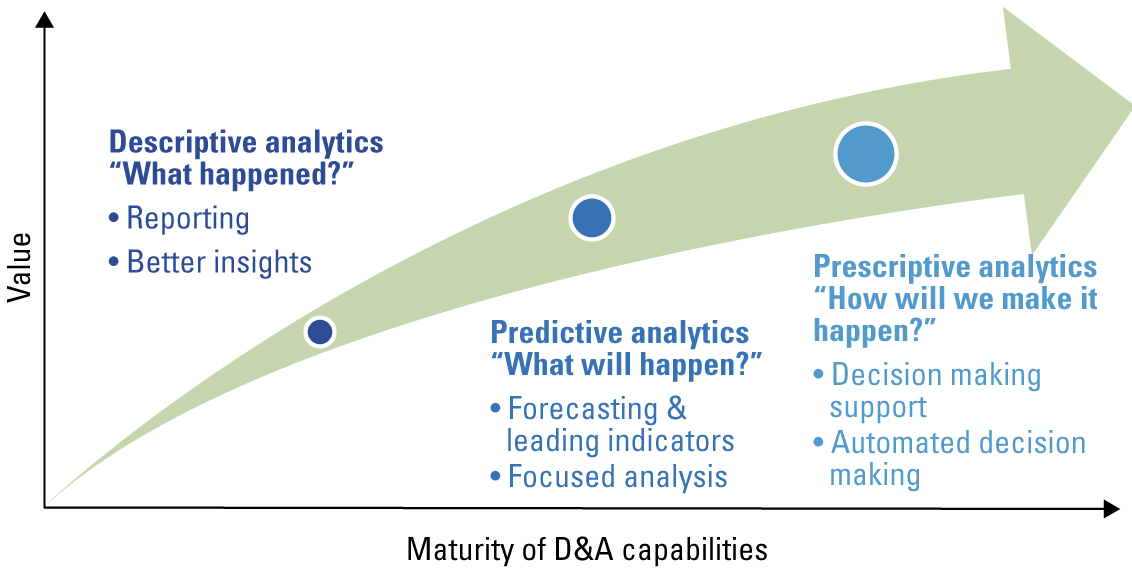
Figure 1. Development of Data Analytics maturity levels. [Click on the image for a larger image]
Over the past 10 years, large organizations as well as SMEs have been on a journey from Descriptive to Predictive Analytics. Descriptive Analytics enables subject matter experts to generate insights by applying data exploration and visualization tools to historical data, using dashboards and business intelligence reports. Predictive Analytics is a set of methodologies and tools that automatically identify patterns in historical data, whether the data is internal to an organization or acquired from an external source to generate forecasts.
Unfortunately, Predictive Analytics is only a (single) step towards optimal decision making for organizations. To take decision making to the next level, organizations need to implement Prescriptive Analytics methodologies into their data strategy. While Prescriptive Analytics is a relatively new term, the idea of Prescriptive Analytics is nevertheless rooted in operations research, a discipline established in the 1930s. Prescriptive Analytics combines forecasts (predictive analytics) with mathematical optimization and decision sciences to identify the best course of action. Prescriptive analytics can provide two kinds of output: decision support, which provides recommendations for actions, or automated decisions, in which case the algorithm executes the prescribed actions autonomously (see article “Becoming data-driven by mastering business analytics” in this edition of Compact). The transition to Prescriptive Analytics constitutes a tremendous opportunity.
What are the challenges in implementing Prescriptive Analytics solutions?
To improve decisions that are based on forecasts, you must overcome three challenges:
- understanding the limitations of forecasting techniques;
- reaching the right decision is hard even with the right forecasts;
- addressing the scarce availability of mathematical optimization skills.
Understanding the limitations of forecasting techniques
Historical accounts on pandemics date back to as early as 430 BC (Typhoid fever in Athens) and 165AD (Antonine plague). Pandemics have been a recurring threat over the course of history. Could a Machine Learning system been expected to accurately predict the exact timing of COVID 19 and its extent? Probably not. However, the risk of pandemics is always lurking. Despite that, many forecasting systems employed across several industries and domains, from SCM and distribution to finance, have not been taking into account the risk of such a rare event. As it was the case for pandemics, forecasting systems might not factor in other risks (geopolitical, adverse weather, …) that have not manifested themselves in the timeframe covered by the historical data analyzed.
COVID19 has once again reminded us of the limitations of the mathematical methodologies (econometrics, machine learning) that mine historical data (time series) and generate forecasts. Time series analysis is unable to cope with the inductivist turkey ([Russ01]). Bertrand Russel’s turkey inferred by induction, collecting several days of observations, that it would be fed every day in the morning. The turkey grew strong confidence in this assumption as more data was accumulated day after day. The animal expected to be fed, like any other day, but on Christmas Eve, the turkey had his throat cut instead. As in Bertrand Russel’s parable, forecasts based on Time Series Analysis can be accurate only as long as we can expect the economic and competitive environment to remain in line with its representation in the data. This is a very strong assumption that very often is proved wrong. Ultimately, predicting the future is impossible. Decision making needs to acknowledge this and deal with uncertainty.
How do we improve decision making?
Reaching the right decision is hard. Even with infallible, 100% accurate forecasts of the future, making the right decision would still be a challenge. It is in fact necessary to correctly formalize the decision-making process as a mathematical optimization problem leveraging skills hardly available in the organization.
Formalize decision-making processes as mathematical optimization problems
In order to translate forecasts into decisions, you need to formulate a decision-making process as a mathematical optimization problem characterized by:
- an objective function that expresses the goal that the organization wants to achieve (e.g. improve client satisfaction, maximize revenues);
- a set of constraints (e.g. production capacity).
A common use case for mathematical optimization is route planning, where an algorithm needs to define the best path to travel from city to city, for example from Zürich to Lausanne. Even such as a straight-forward, day-to-day problem can have multiple formulations with a different set of goals and a growing set of constraints (see box “Route optimization”).
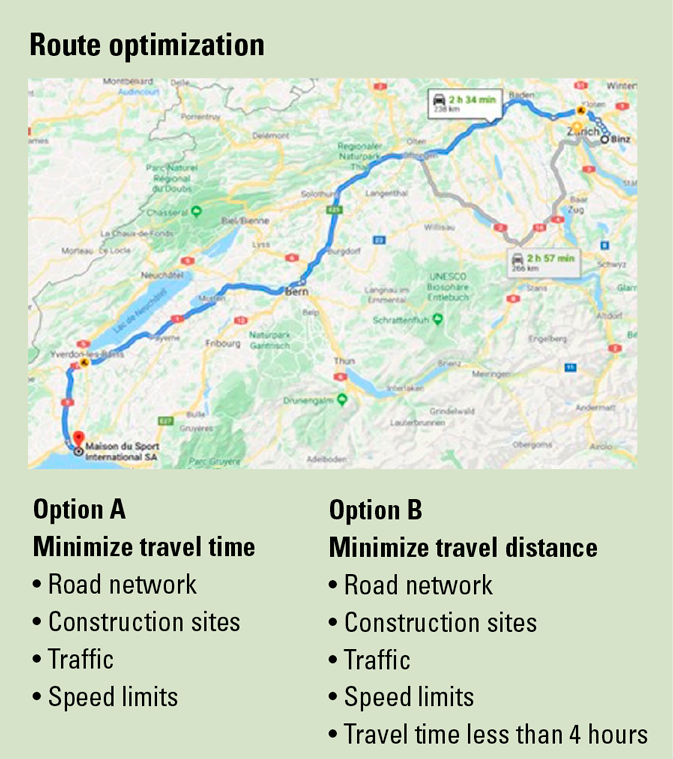
In fact, while compiling a mathematical optimization problem might seem trivial at a first glance, the task is instead of daunting complexity: the definition of an objective function and a set of constraints that are able to capture all the existing trade-offs in an organization requires deep domain expertise. This is true, for example, in production planning: you might very likely not simply ensure that all your resources are fully utilized in a production plan, but also ensure that there is enough time to perform preventive maintenance while guaranteeing fair employee schedules and taking account individual holiday plans.
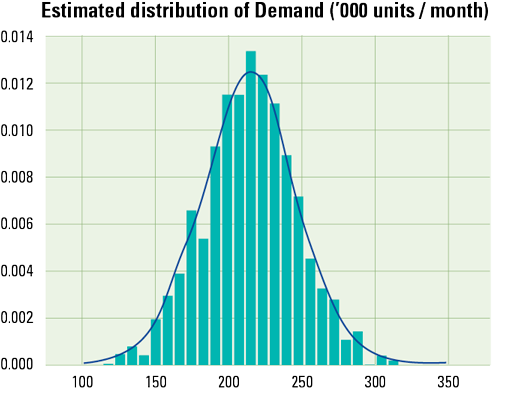
What is a probability distribution?
A probability distribution defines the probability that a variable could take a specific value. The probability distribution of an unbiased coin flip says that there is a 50% probability of getting heads and 50% probability of getting tails. Likewise, a distribution could describe product net sales or costs of raw materials, quantifying the likelihood of forecasts and scenarios.
Increase availability of mathematical optimization skills
Once the mathematical optimization problem has been formalized, it is time to tackle it by selecting and applying the right mathematical approach. The success of Prescriptive Analytics projects depends on the availability of a broad set of methodological expertise, including mathematical optimization techniques such as classical mathematical programming ([Boyd04]), meta-heuristics ([Luke13]), evolutionary algorithms ([Eibe03]) and reinforcement learning ([Sutt98]). There is no silver bullet. The choice of the right mathematical optimization technique can depend on many factors, such as:
- whether some decision variables may or may be not restricted to take discrete values. A discrete decision variable is, for example, the number of boxes that should be shipped in the upcoming week to a store. On the other hand, working with bulk shipments generally translates into non-discrete decision variables as quantities can assume any fractional value;
- whether all the decision variables can be considered deterministic or whether they should be modeled as a probability distribution (see box “What is a probability distribution?”);
- the mathematical formulation of the objective function and constraints.
Successfully tackling mathematical optimization problems does not only require strong mathematical foundations, it also requires extensive practical experience. Understanding the impact of business assumptions on the computational complexity of a mathematical optimization problem is extremely demanding. It is often the case that a slight change in a set of constraints could increase the computational time required to solve the mathematical problem from a few seconds to days if not weeks.
At the same time, it is often the case that mathematical optimization problems incurred in many business domains are not well-behaved: slight changes in the business assumptions might lead to drastic changes in the recommended action: including considerations on the sensitivity of optimal solution adds an additional layer of complexity.
Ensuring the availability of a broad portfolio of methodological expertise requires a focused hiring strategy and the ability to acquire professional profiles with vastly heterogeneous backgrounds, outside of the standard data science curriculum.
How can you make more reliable decisions?
As the future cannot be predicted, how can you cope with the uncertainty in your forecasts? How can you manage risks potentially not reflected in your data and not acknowledged by your forecasting systems? In the aftermath of COVID 19, financial and operational resilience have become key strategic priorities. Resilience is the ability to continue providing products or services when faced with shocks and disruption. How can organizations position themselves to, not only respond to disruption, but also take advantage of disruption to quickly develop a competitive advantage?
In addition to the two fundamental cornerstones, mathematical formalization and related skills availability, as discussed in the previous section, this type of resilience requires rethinking the existing decision-making processes by:
- creating a comprehensive model of a business;
- explicitly quantifying the impact of risks;
- augmenting historical data with subject matter expertise.
Creating a comprehensive model of a business
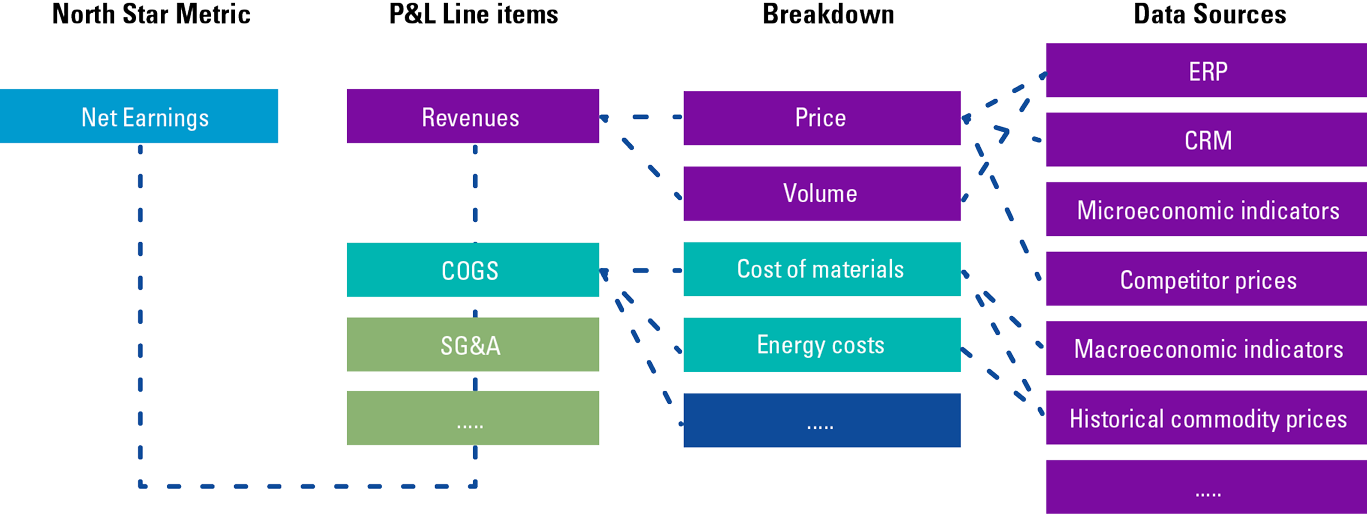
Value drivers trees are an essential framework to develop a rigorous and comprehensive representation of a business. Modelers can structure the objectives and KPIs of an organization, and visually understand all the trade-offs in place. Value drivers trees support mathematical modelers in the definition of optimization problems and in the formalization of target functions and constraints. They facilitate reasoning regarding which external variables have an impact on a business and assist in the selection of all the data sources that should be leveraged by mathematical models. Furthermore, Value drivers trees helps stakeholders identify risks and design risk mitigation strategies.
Value drivers tree
Value drivers trees break down the goal (e.g. maximizing net earnings) into financial and non-financial metrics, and help decision makers and mathematical modelers understand all the factors that affect a decision, the trade-off and the impact of each choice and scenario.
Explicitly quantify risks
Probabilistic models are an approach where uncertainty is explicitly quantified as a probability distribution: in probabilistic models, input variables are expressed as probability distributions. The output of a probabilistic model is also a probability distribution ([Koll09]). The development of probabilistic models requires higher investments than the econometrics and machine learning forecasting techniques traditionally employed in the industry. At the same time, probabilistic models are often more computationally expensive. They do, however, also have several advantages.
Firstly, probabilistic models provide a modelling framework that allows disruptive factors such as pandemics, adverse weather conditions and abrupt changes in the economic environment to be included. Rare events and catastrophe modelling become part of the day-to-day decision-making process, which in turn contribute to more resilient forecasts.
Secondly, probabilistic models can be used to generate scenarios. Scenarios analyses allow the evaluation of the financial impact of risks and disruption. With scenario analysis, stress testing becomes an integral part of financial planning and operations. They are also an indispensable tool to evaluate tactical decisions (e.g. shutting down a manufacturing plant for maintenance) and strategic decisions (e.g. renegotiating supply agreements with business partners).
Furthermore, the structure of probabilistic models can match the value drivers tree of an organization and they are inherently interpretable by decision makers. Forecasts can be broken down along the value drivers tree. This enables decision makers to easily understand on which financial and operational assumptions forecasts are based. Interpretability boosts trust and adoption.
Probabilistic model: example
What is the expected ice-cream demand at a local food stand? One approach to this demand estimation problem is by:
- looking at historical data in order to estimate ice-cream demand on sunny days;
- analyzing historical sales data in order to estimate demand on rainy days;
- accessing a number of weather forecasts services in order to gauge the risk of rain. The risk of rain is in itself a probability distribution as, very likely, the different weather forecasts will give different estimates.
The output of this model will be a probability distribution that characterizes the demand of ice-cream, taking into account the risk of rain.

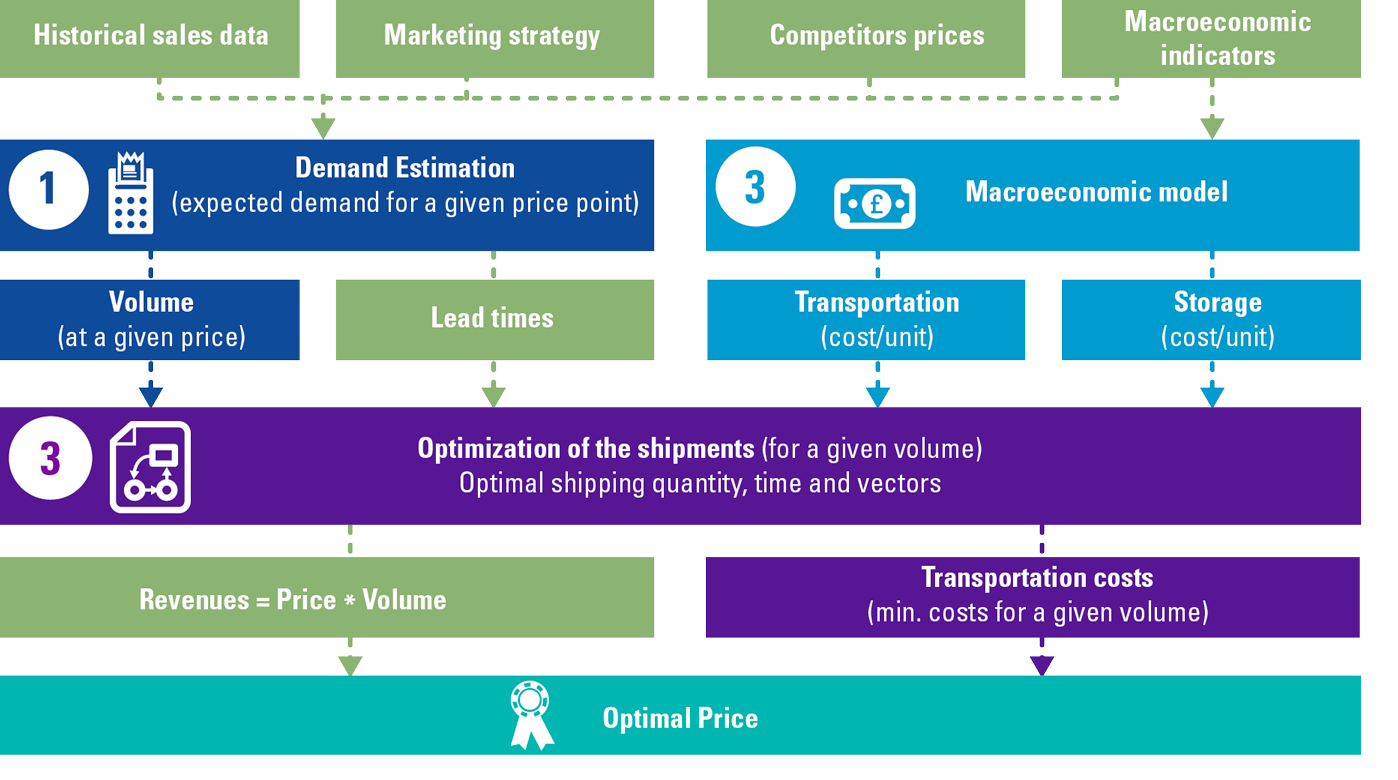
Probabilistic model: use-case
KPMG has helped an international distributor of industrial goods set the optimal price for different products in their portfolio. In order to achieve this goal, KPMG developed a probabilistic model that matched the value drivers tree of the organization and comprised of three modules:
- A module that estimated the demand for a product at a specific price point with a Gradient Boosted Trees, a Machine Learning regression methodology ([Frie01]). The Machine Learning module leveraged internal data (historical sales as well as historical promotional data) and external data, including macroeconomic indicators (leading indicators on trade finance as well as on the availability of capital to finance CAPEX investments).
- An econometric module that estimated transportation and storage unit costs given historical data and macroeconomic indicators (e.g. crude oil price).
- An optimization module that – given demand volume estimates and other key optimization parameters (e.g. estimated lead times and transportation costs) – identified the optimal shipping route and calculated the total transportation and storage costs. The problem was formulated as a Mixed Integer Linear Problem (MILP) ([Vand15]).
The optimal price was ultimately selected as the price that maximizes total revenues less transportation costs.
Augmenting historical data with subject matter expertise
Key inputs can be estimated from historical data that you already have or external data that you obtain from a third party. However, data might be biased or not paint the full picture. Historical data can, however, be augmented: internal and external subject matter experts (SMEs) in your organization, who are in direct contact with your business, have a great wealth of information that could be beneficial. SMEs may in fact have engaged clients and suppliers in conversations or perhaps had access to market surveys, competitive research or news articles. All such information is extremely valuable:
- It can augment and complement the information that can be extracted from historical data.
- It can be used to inform the generation of scenarios.
- Subject matter experts’ opinions can be integrated with insights from historical data.
The opinions of Subject Matter Experts (SMEs) should be collected from the entire organization with a transparent, auditable workflow. While collecting opinions, it is mission critical to keep track of the sources and the degree of confidence SMEs have on their estimates. SME’s opinions and the business assumption behind any Prescriptive Analytics model should be easily reviewed by the key stakeholders of the model and by senior management. Higher transparency in business assumptions will in turn boost trust and the adoption of the Prescriptive Analytics solution.
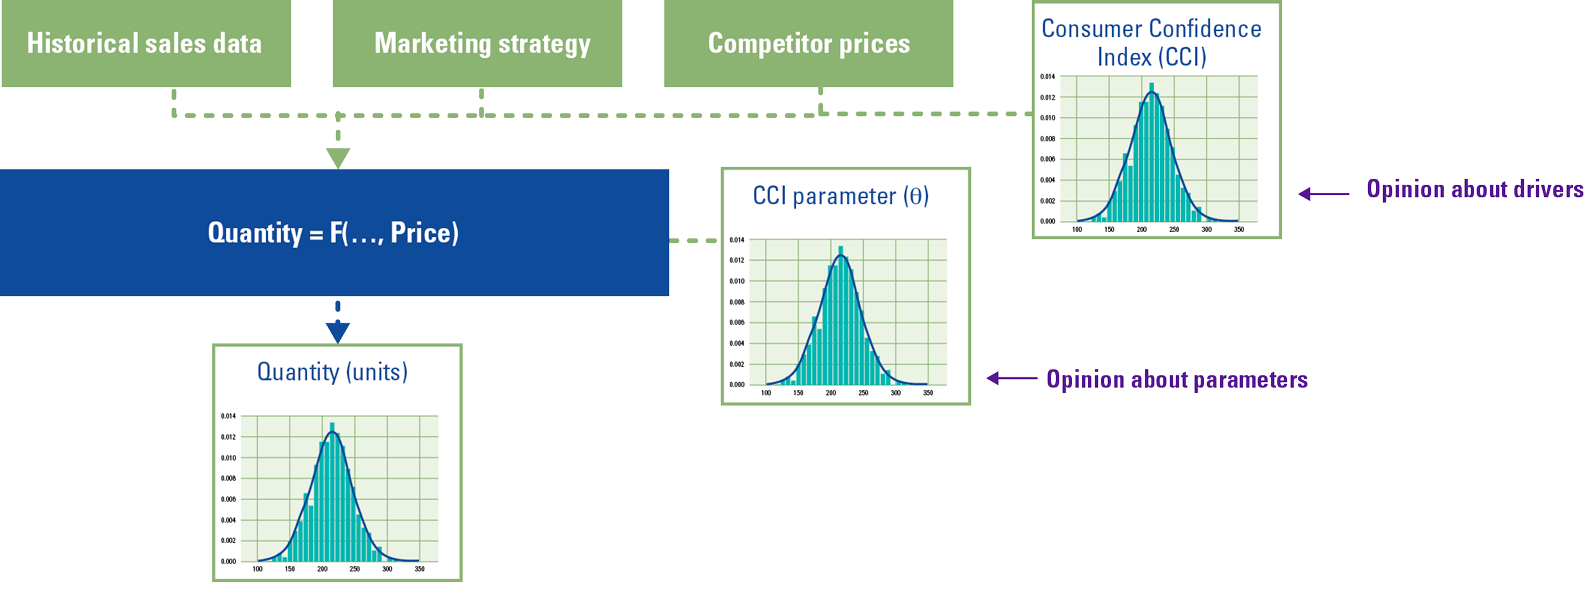
SME opinions
Let’s assume that an organization aims at forecasting demand based on internal historical data of sales and promotions, historical competitor prices and a proxy for the propensity of their consumers to spend. Let’s assume that the organization has verified statistically that the OECD Consumer Confidence Index is indeed a proxy that improves the forecasting accuracy of its model. Probabilistic models support the injection of subject matter experts’ opinions expressed as probability distributions: Subject Matter Experts can define their expectations for input variables (drivers) as well as for model parameters such as the coefficient that defines the relationship between the output (quantity) and a driver (CCI).
Conclusion
Prescriptive Analytics has the potential to boost profitability and long-term competitiveness by giving stakeholders the tools to make optimal decisions that are data-driven, but also capture the knowledge of SMEs. Prescriptive Analytics enables decision-makers to rethink their decision-making processes: integrating risk management in the day-to-day decision-making process by explicitly modelling risks with probabilistic models leads to more robust decisions that boost the financial and operational resilience of an organization, and position it to not only respond to disruption, but to take advantage of disruption to develop a competitive advantage.
References
[Baye63] Bayes, T. (1763). LII. An essay towards solving a problem in the doctrine of chances. Philosophical Transactions of the Royal Society of London 53, 370-418.
[Benn21] Bennett, M. (2021). Data Literacy: What Is It, And Why Do Executive Teams Need To Care? Forrester.
[Boyd04] Boyd, S., & Vandenberghe, L. (2004). Convex optimization. Cambridge: Cambridge University Press.
[Eibe03] Eiben, A. E., & Smith, J. E. (2003). Introduction to Evolutionary Computing. Springer.
[Frie01] Friedman, J., Hastie, T., & Tibshirani, R. (2001). The Elements of Statistical Learning. Springer Series in Statistics.
[Goed18] Goedhart, B., Lambers, E.E., & Madlener, J.J. (2018). How to become data literate and support a data-driven culture. Compact 2018/4. Retrieved from: https://www.compact.nl/articles/how-to-become-data-literate-and-support-a-data-driven-culture/
[Koll09] Koller, D., & Friedman, N. (2009). Probabilistic Graphical Models: Principles and Techniques. MIT Press.
[Luke13] Luke, S. (2013). Essentials of Metaheuristics. Lulu, second edition, available for free at http://cs.gmu.edu/~sean/book/metaheuristics/
[Russ01] Russell, B. (2001). The problems of philosophy. Oxford: Oxford University Press.
[Sutt98] Sutton, R. S., & Barto, A. G. (1998). Introduction to Reinforcement Learning. MIT Press.
[Vand15] Vanderbei, R. (2015). Linear Programming. Springer.