


In recent years, new legislation has raised the bar for banks in domains such as credit risk and integrity risk (anti-money laundering, fraud, etc.). Banks have made considerable investments in upgrading their efforts to comply with these regulatory standards. Big Data techniques now offer new potential to increase both the efficiency and effectiveness of these tasks by up to 50%. Algorithms can plough through data, stored in data lakes collected from various data sources and thereby bring surveillance to the next level. Banks that successfully apply these techniques also have an excellent starting point to create value from Big Data in other domains. Value for the customer and value for the bank. In this article we will show the possibilities and impossibilities of Big Data techniques in relation to risk surveillance.
Impossible Is Nothing?
The promise of Big Data is impressive. It can help us better understand individual customer needs, increase sales, find better ways to organize processes, predict criminal behavior, reduce traffic congestions or even lead to better focused cancer treatments. We are at the start of a great journey towards a new paradigm: the data driven society. Many business sectors are being reshaped at an astounding pace, fueled predominantly by new digital innovations based on data analysis. We live in a world where everything is measurable and in which people, and almost every device you can think of, are connected 24/7 through the internet. This network of connections and sensors provides a phenomenal amount of data and offers fascinating new possibilities which, together, are often called Big Data.
Chances are that you’ve read articles or books about the impact of Big Data. We can quote boxing legend Muhammad Ali, stating “Impossible is nothing”, to summarize many of these. But we also need to be realistic. As of now, a large part of the potential of Big Data is still nothing more than a promise. In this respect, the term vaporware springs to mind. In the early days of the computer industry, this word was introduced to describe a product, typically computer hardware or software, that was announced in the media but was never actually introduced on the market nor officially cancelled. Use of the word later broadened to include products such as automobiles.
Big Data and Surveillance
There is no doubt that Big Data can be very helpful for banks to comply with legal and regulatory requirements in the integrity risk and credit risk domains. Automated analysis of data from various sources is an effective approach to trigger red flags for high-risk transactions or clients and to reduce the false positives. Especially the combination of data from multiple sources – internally and externally – is what turns data analysis into a powerful tool. Applying these techniques is not only a more cost effective way to deal with compliance requirements – e.g. reducing the number of staff involved – it is also more effective.
A clear indicator is the application of Big Data analytics in the credit risk management domain of a retail bank. Using credit risk indicators based on behavioral patterns in payment transactions, has proven to lead to significant earlier detection of credit events than conventional indicators based on overdue payments and overdrawn accounts. In fact, it enables banks to predict which clients will run into financial difficulties up to a year in advance. The social physics – meaning, the behavior of people – seems even more valuable for a bank than conventional data such as age, income or repayment history. The same approach can radically enhance surveillance techniques to identify violation of anti-money laundering regulation or customer due diligence policy.
An important question is: are people able to lift their current reservations to rely on algorithms and machine learning techniques. A basic prerequisite for the success of Big Data analytics is a change in attitude towards the insights that data analysis can provide, since these insights are often better than human experience or intuition. Andrew McAfee – one of the authors of The Second Machine Age – points at this in an article with the headline: Big Data’s Biggest Challenge? Convincing People NOT to Trust Their Judgment. He stresses that human expertise has its limitations. “Most of the people making decisions today believe they’re pretty good at it, certainly better than a soulless and stripped-down algorithm, and they also believe that taking away much of their decision-making authority will reduce their power and their value. The first of these two perceptions is clearly wrong; the second one a lot less so.” We must reinvent the way we look at data and take decisions. In the words of Ian Ayres, from his book Supercrunchers: “Instead of having the statistics as a servant to expert choice, the expert becomes a servant of the statistical machine.”
Improving Credit Risk Indicators
Traditionally, credit risk indicators used by banks signal changes in the creditworthiness of a customer whenever a “credit event” occurs. For example, when a payment is missed or a household is left with a residual debt after selling a house. The ambition of many banks is to signal such possible payment issues months or even a year in advance. These signals would enable a bank to help a customer by offering a payment plan before payment problems actually occur. It allows customers to be helped better and engaged with more closely. Credit losses can be reduced and experts can be deployed more efficiently.
One way to improve the predictability of credit risk indicators is to monitor transactions: payments, investments, savings. Based on these (payment) transactions common behavioral patterns of individual customers, industries and customer segments can be identified. When historical data is available (e.g. up to three years of transaction data) group-specific “healthy” behavior can be identified. Behavior that deviates from the healthy norm can be a potential credit risk indicator. Data analytics has shown that a shift in payment behavior is visible up to 12 months before a consumer or small enterprise defaults on its payments.
How Is It Done?
To develop predictive analytics models for signaling credit risks the following steps need to be taken:
- Select data sources, such as payment transactions, and install this data on a big data analytics platform.
- Explore the data and find characteristics. Solve data quality issues and anomalies.
- Classify all transactions: label transactions based on type and periodicity.
- Cluster customers based on corresponding behavior.
- Identify “normal” behavior of these clusters and of individual customers.
- Identify behavior that deviates from normal behavior.
- Find deviant behavior that correlates with defaults.
- Build these findings into a prototype predictive model.
- Validate the correctness of the model.
- Iterate steps 1 to 9, with the aim of creating a self-learning algorithm that is integrated in the architecture. For example one that minimizes false positive indicators over time.
So is the potential of Big Data in relation to surveillance within reach for banks, or do we risk another case of vaporware? Based on our experiences with Big Data analytics, we are convinced that the surveillance potential of Big Data is far more than vaporware. We present our case for this in the remainder of this article.
Technical Advances in Computing
To this end, we first touch upon some technical developments that underpin the rise of Big Data. One obvious reason is the digitization of society: nearly all information is digitized or can be digitized. Another is the fact that the cost of computing power, bandwidth and computer memory continues to fall dramatically, while capacity increases exponentially over time (Moore’s law). Furthermore, there is a shift in the technical approach of handling data. Traditional data management and analysis is based on relational database management systems (RDBMS). These systems typically require data to be entered in a structured and inflexible way, i.e. filling relational tables with structured, specific information. On top of that, the architecture of an RDBMS is not well suited for distribution over multiple machines, leading to increasingly expensive hardware when the amount of data is growing or when more or increasingly complex analytics are required.
Big Data storage systems aim to reduce complexity to store cost-effectively and manage large datasets and to make the data available for analysis. This is achieved by adopting a distributed system architecture of nodes which specializes in the parallelization of tasks. Well known examples are the Google File System and the Hadoop Distributed File System. In practice, these systems form the basis of many Big Data applications.
With trends like agile development, an approach complimentary to the traditional master data management MDM is gaining popularity in the world of Big Data. Rather than an upfront definition of standards, data from various sources (sometimes from outside the organization) are brought together in a “data lake” with minimal changes to their original structure. As the standards and data quality requirements can differ from one analysis to the other, data quality measures are postponed (or at least partially) to the analysis stage. The benefits of a data lake approach for data analysis are plentiful: the ease of implementation, the speed of combining data sets and “fishing” for new insights, and the flexibility of performing data analyses.
Running on top of this, the analysis software used for extracting value from data is growing ever more mature. Analysis routines range in use from the exploration and visualization of data, the combination and molding of datasets, the selection and trimming of data, multivariate analysis techniques, model building and validation, etc. These techniques, such as machine learning tools, grow ever more advanced and more and more often these get collected into standardized analysis libraries. Examples are: ipython, pandas, numpy, scipy, sklearn, R, ROOT, etc. And here’s the great news: these programs are open source and are available to everyone to contribute to and to experiment with. Altogether these create the toolbox of any data scientist.
First Steps to a Data Driven Organization
These developments indicate that the technological barriers for turning Big Data promises into tangible results are getting low and surmountable. The question that is perhaps even more important: is the organization ready for it? We can distinguish a complex of seven domains that deserve attention.
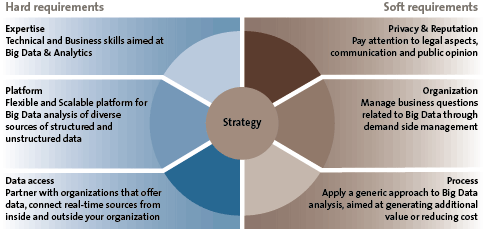
Figure 1. Seven key components of a data driven organization.
First of all, Big Data analytics must become an integral part of the overall strategy of the company, supporting the short and medium term ambitions of the businesses. The idea to improve products and services of the bank with data analytics must be adopted throughout the entire organization.
On the left side of Figure 1, you see the three “hard” requirements regarding expertise, technology and data:
- The combination of technical and subject matter (or business) expertise is critical in order to identify and develop analyses that impact bottom line results. Big Data expertise must be available within the organization: Big Data scientists, technical skills (data analytics, platform) and related business skills.
- Organizations must have a flexible and scalable platform and the accompanying tools and techniques to deploy big data analysis. The technology should facilitate experimental freedom, fuel creativity and stimulate cooperation.
- Organizations must have the required data available and easily accessible (both internally and externally, structured and unstructured, real-time and historical).
On the right side of Figure 1, you see the three “soft” requirements that are just as relevant:
- Organizations must be able to deal with legal requirements and privacy guidelines that come with the handling of sensitive data.
- Big data teams must seamlessly align with business experts. Therefore Big Data efforts and processes must be organized throughout the organization.
- Organizations must have a generic approach to Big Data analysis, aimed at generating additional value and reducing costs. The organization has an adaptive, agile approach that supports business and correlation driven developments.
In the following, we address a number of important preconditions.
Big Data Governance
Implementing a Big Data strategy implies totally new ways of working and room for experimentation. Often, a supportive environment for innovation leads to novel products, creates new markets and leads to more efficient and effective processes. However, this does not mean that business leaders should grant their people an unlimited license to experiment. Rather, they should facilitate experiments under active governance. This implies room for creativity and experiments on the one hand, and a highly professional Data Analytics organization and processes on the other. One can make the comparison with the technique used by professional racing drivers that involves operating the brake and gas pedals simultaneously with the right foot: the heel and toe racing.
Good governance is quintessential to ensure that Big Data projects live up to expectations and that their potential is more than “vaporware”. Executives are in the position to make sure that Big Data projects and/or departments get the power and the resources that are needed to succeed. It deserves to be in the driver’s seat to transform the business in three domains: realizing growth, controlling risk and optimizing performance. Strong sponsorship from the top is an important prerequisite for this. Board members who “walk the walk and talk the talk” and explicitly communicate that Big Data will be decisive for the future of the organization, have proven to be an essential success factor for big data initiatives.
More Than Number Crunching
The success of a Big Data initiative depends on the quality of the data scientists. Big Data analytics requires data scientists who have a PhD or Master’s degree in exact sciences (computer science, mathematics, physics, econometrics), are experienced in pruning, trimming, and slimming large volumes of (low quality) data, have knowledge and experience in numerical and statistical methods (such as Monte Carlo simulation), are experienced in using standard (proprietary) software for analysis (such as Excel, SAS, SPSS) and in applying machine learning and multivariate analysis tools (such as decision trees, neural networks, etc.)
Yet executives need to be aware that Big Data analytics is much more than number crunching. It is about using data analysis in the proper context. We quote Sherlock Holmes, saying “It’s human nature to see only what we expect to see,” as an important warning.
Skilled data scientists are fully aware of the risks of misinterpreting data – for instance by confusing correlation and causality. Central in their work is to deal with the so called Simpson’s paradox. This paradox can be explained by statistics about the use of life jackets. At first glance, these statistics show that people not wearing life jackets more often survive in case of an emergency. This is of course counterintuitive, but does make sense on closer examination of the numbers: sailors wearing life jackets were more often experiencing bad weather conditions, which is a dominant factor in survival. Sherlock Holmes would have thought this through, being able to look beyond the obvious. This is exactly what we need from data scientists and is also the main argument why Data & Analysis is much more than number crunching by fast computers. Data scientists must be able to put their analysis in the context of what’s truly happening “underneath”, while working closely with highly involved business experts to ensure correct business conclusions are drawn.
Scoping the Value for Banks and Its Customers
With proper attention to the aforementioned conditions, banks should be able to successfully apply Big Data in the surveillance of risks to comply with legal and regulatory requirements. Perhaps more important is that Big Data analytics will open up new opportunities in other areas. In fact, interpreting behavioral patterns will be a key differentiator for banks in the near future. A bit of imagination leads to numerous new possibilities, like real-time lending based on behavioral analytics or reducing credit losses significantly by offering a customer a payment plan even before a credit event occurs.
Technologically, the possibilities have become both immense and affordable. We are now actively exploring this potential step by step. One key precondition is to be fully aware of the sensitive nature of personal data: banks should restrict themselves to using data in a way that customers are comfortable with. The first priority is to bring value to the customer in terms of quality, service and speed, without compromising privacy. It’s all about using data in the best interest of the customer. Doing so will safeguard the trust and integrity that are essential to every financial institution.