


Information Risk Management (IRM) is an area of expertise with considerable room for future growth and development. In the previous article on this matter (see Compact 2013-1 “The 2020 Vision of Information Risk Management”), it was concluded that even though the IT landscape has changed dramatically since the sixties/seventies, IRM methodologies have not changed all that much. Since then, the threats have changed, but the process and the tooling that is used to achieve perspective on risk remains the same. In our vision we presented a future state in which it will be possible for the ultimate overseer of risk management in a large organization to have a real-time overview of current risks, aggregated to a comprehensible level. Furthermore, in this future state, drilling down to the harmed asset(s) or business entities is possible, so that exceeding the defined risk thresholds automatically leads to alerts, and structural overruns are input for designing new projects or programs, to improve defense against malicious entities or anomalous events.
Introduction
Since Information Risk Management can be viewed top-down as well as bottom-up, major advantages can be realized when linking these two views together. For one thing, you can actually determine the effect on the business if certain threats were to materialize. Just using the top-down approach might be too high level, and just using the bottom-up approach might be a waste of resources on risk management. By combining the approaches, you can identify the problem areas from a top-down perspective and substantiate them with a bottom-up approach.
Sounds great! But how can this all be realized? A qualitative model does not deliver the dashboards that we require in order to steer the risk management process. You will need models that link IT-assets to business processes: to see the impact of a hacked server on the finance process, or to see what the effect is of an additional control in a generic access management process. When creating models to facilitate all this, you will discover that you run into all kinds of practical issues that have to be solved. This article will describe some of the more practical solutions (and questions yet not answered) to realize this vision, in order to provide the risk manager with the single view of risk that is needed.
A quick reminder of things to come
Just as a refresher, we briefly described these major elements in our 2020 vision:
- Single view on risk: one central register of risks regarding information; not only risks to data, but also to infrastructure, as well as risks coming from external sources such as third parties/joint ventures;
- Real time: data on risk is fed into the systems on an ongoing basis, not by means of an annual questionnaire;
- Dynamic reporting: company-level overview of the major risks, with the ability to drill down to the elements that are causing the high risk levels;
- Department-specific views: each business representative is able to view the risk levels for his/her part of the organization;
- Evolution: seeing not only the current status of risk, but being able to see the development of risk over time and even being able to extrapolate risk levels into the future (being able to respond to risk proactively);
- Risk-based: taking action on tangible risks, instead of implementing controls without knowing which risks are covered;
- Risk appetite: being able to define a threshold above which to take action; for example, in the form of new controls to trigger movement away from threats;
- Rationalized remediation: being able to decide where to take action, to maximize risk reduction for the least amount of money;
- Helicopter view on the risk chain: not just looking at risks that emerge from our own business, but also having an overview of risk that emerges from our service providers.
So, it boils down to a top-level overview of the major risks from an information management perspective (the threats that have the biggest impact if they materialize, and where our vulnerabilities are the biggest), combined with the impact on our day-to-day business. What do we need to realize this view?
Do we need a brand new risk assessment process?
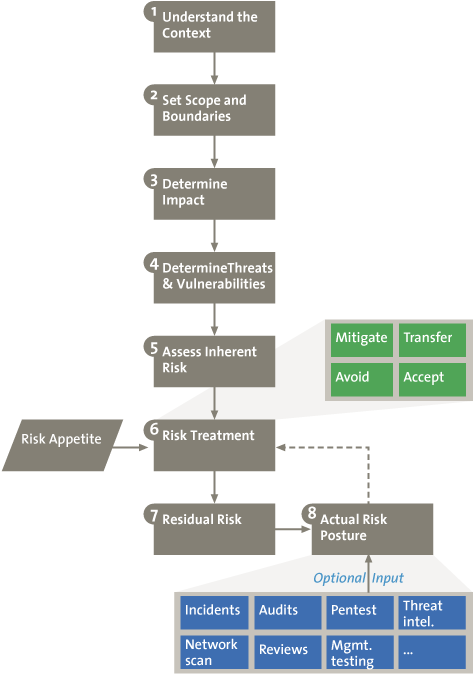
Figure 1. The Risk Assessment Process.
Risk analysis is a well-known process. Figure 1 is a depiction of the risk management process as most of us know it. There might be variations to it, all with their own benefits, but in essence, risk management consists of determining the scope, identifying the likelihood of threats, determining potential impact, and taking counter measures to deal with the identified risks.
It is important to note that this process will not dramatically change in our vision. However, changes will be visible in the way in which data on risk is collected and reported. Especially for larger organizations, reporting on risk in a precise way can be difficult, and often emerges in terms of gut feelings. Also, the process as depicted in Figure 1 is often performed with a bottom- up approach, while we advocate a combination of both top-down and bottom-up risk management.
Top-down versus bottom-up
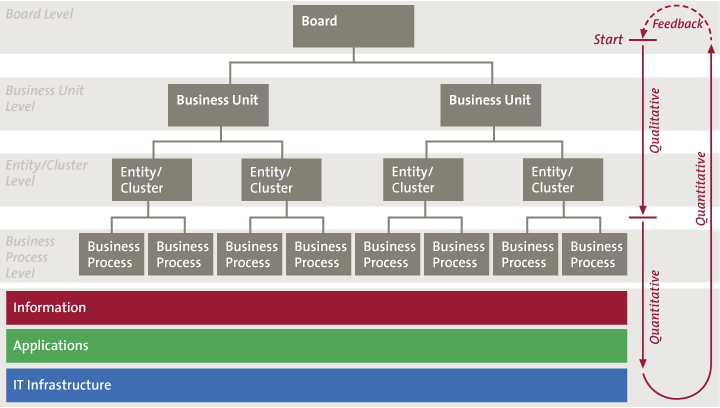
Figure 2. Linking top-down & bottom-up risk management.
The first important question in determining risk levels is: where to start? Should it be at the top (board level), or bottom (assets). Determining risk levels from only a bottom-up perspective is bound to fail. When determining risk levels we need the broader picture to form an opinion on Impact and Risk Appetite. This is where top-down risk management comes into view.
Top-down risk management starts, obviously, at the top. On a board level, processes need to be in place that drive the lower-level risk assessment and risk remediation. In the ideal situation, IRM is integrated with other areas of risk management in order to ensure that risks are presented to the board in a consistent manner, enabling them to make well-informed decisions on how to respond to risk.
For example, when performing bottom-up risk analysis, you might start focusing on every single firewall, router, server, application, et cetera. However, looking from a top-down perspective, the board might indicate that the biggest impact for the company would come from involuntary publication of specific intellectual property or techniques (Coca Cola, or manufacturing procedures for high-grade steel). From that higher level view, you can work your way down to specific IT infrastructure, and determine the most relevant threat and vulnerability levels.
Top-Down Risk Management
Top-Down Risk Management refers to the process of performing risk assessments on the highest level in the organization and cascading down that input to the lower levels in the organization, ultimately to the IT infrastructure level. The input to the lower levels can consist of, amongst other things, the Risk Appetite and Impact information.
At the higher levels in the organization, it is not feasible to discuss specific vulnerabilities or threats that are present in the IT environment, because these technical observations generally do not make sense at that high level. In top-down risk management, the board and the lower levels will define the areas of biggest IRM impact in a qualitative manner, for example in terms of High, Medium and Low risks (not based on actual figures or hard statistics). On the levels below the board, the level of detail in the qualitative assessment will increase until the business process level is reached. Only at a business process level is it possible to link actual information or data to process steps on one hand, and on the other hand, to link that information to the IT environment: applications and IT infrastructure. To determine the impact on lower levels, the bigger picture needs to be taken into account. Obviously, a clear mapping of organization structure including business processes is a prerequisite to making this work.
Risk appetite
Besides input on impact, the other important element determined by information from the board level is risk appetite. Although there are several definitions of risk appetite or tolerance, we see risk appetite as the amount of risk one is willing to accept. If risk were expressed in dollars, the risk appetite could also be expressed in dollars. For example, a risk appetite budgeted at 1 million dollars annually means that damage in the range of 5 million dollars could be tolerated once every 5 years. As long as the calculated risk is below your risk appetite, you will not need to take action to mitigate the risk.
In a multinational organization, individual businesses or even business process owners should not be allowed to decide on their own risk appetite in isolation, for they do not know what level of risk appetite is borne by other parts of the organization. In the end, all “amounts” of risk appetite in the divisions will be aggregated to one big risk figure for the entire organization. Therefore, the risk appetite should be defined or set by the board, indicating how much risk they are willing to take. This can be distributed among the lower levels, which can decide on mitigating their risk to levels below the assigned risk appetite. Risk appetite can be set in different ways.
First, where risk management is of a more qualitative nature, risk appetite can be set by means of guidelines and directives. Management needs to take into account the nature of their business and determine which risk scenarios would be too devastating to face. For example, the IT systems steering the flower auctions in the biggest flower auction center in the world (Aalsmeer), can never be down. Damage if the auction systems were down would be enormous, especially since the auction cannot be postponed to the next day. Compared to the IT systems, HR systems are, with all due respect, far less important in this scenario. So from the top down, it is critical to maximize efforts ensuring the continuity of the auction systems, and pay less attention to the continuity of the HR systems. Had we left the decision on priority of the HR systems to the HR manager, this might have resulted in a different and unsuitable outcome.
Second, in a mature quantitative risk management process, where risks are expressed in monetary value or risk points, management can set the risk appetite as a quantitative number. For example, management could decide that risk appetite is not more than 1 million dollars. This can be further detailed. For example, management could decide that the 1 million will not be divided evenly across the organization, but that 100k is the limit for the production department, and the remaining 900k of risk can come from the other departments.
Initially, determining the level of risk appetite in a quantified way is difficult, if not impossible. What is a reasonable value? How are others doing? The board needs some existing value as a benchmark, whether internal or external. Therefore, a heuristic “feedback loop” is required in which input from the operational level is delivered to the board in a quantified way. This is one area where top-down and bottom-up risk management meet. The bottom-up information is used when performing the cycle for a second time to define a more realistic value for risk appetite. When performing the cycle for the first time, management could choose to define risk appetite as a percentage (e.g., 10% of the inherent risks) or an absolute level in a qualitative scale (e.g., all risks need to be brought down to a “low” level).
Managing risk in large environments: quantification
For a small environment, information on risk levels could be reported by indicating the major threats, how these threats are covered by several kinds of measures, and what the residual risk is for the information assets and consequently for the business processes in the environment. No quantitative metrics would be required; perhaps a High/Medium/Low categorization would suffice. However, for a large company with worldwide presence, hundreds or thousands of IT systems and an infrastructure that cannot be fitted into one football-field-sized data centre, this kind of reporting per data set would not suffice. The simplest reason for this is that the data in those reports no longer provides any information; due to the massive size, you will not get a holistic risk overview by using the methods that small companies use. Across the board, you need to have uniform quantification of all kinds of criteria used for risk analysis, such as threats, vulnerabilities, controls, risk appetite, security incidents, et cetera.
It is important that everybody across the board works with the same definitions. For example: Risk is the vulnerability that a certain threat will materialize and thus create damage. A risk therefore is expressed in terms of dollars or risk points. We often see terminology used in different ways, adding to the lack of clarity. For example, “hacking” is often mentioned as a risk. However, hacking is actually a threat. Adding the vulnerability level to hacking, as well as its impact, creates Risk. Not having a clear vocabulary is a major reason for failing effective and efficient risk management.
Another observation is that the real business value generally resides with the data (or data sets), instead of just in applications. Performing impact assessments on applications is insufficient when multiple types of data, all with their own characteristics and value to different business processes, flow through the application landscape. For that reason, data sets are at the core of information risk management. For example, an ERP system like SAP might have many data sets, ranging from the records of the number of holidays that staff members have left, to very confidential information such as not-yet published profit and turnover for a publicly listed company.
Quantifying inherent risk
After understanding the context and determining the scope, one of the first steps in the risk management process is determining and assessing inherent risk. When quantifying (inherent) risk, you need to quantify likelihood (threat, vulnerability) and impact. The risk levels will show which threat categories include risk levels that are relatively high / low (see Figure 3). When linking the data set with metadata (such as the processes in which this data is used or to which business unit this data set belongs, et cetera), the risk levels can be reported from each desired angle. Before starting to quantify the threat, vulnerability and impact, you need to have some discussions on (again) definitions:
- Threat: it can be argued that threats can be influenced by control measures (e.g., deterrent controls). However, for ease of use, there is no harm in deciding that threats are externally influenced and that they cannot be mitigated. Hackers will not retreat if you build a good firewall: the threat will not change, but your vulnerability will diminish. Of course, in some cases you can move away from a threat: building your data center on high ground results in a lower threat of flooding. In other words, threats are determined by the environment that you are in.
- Vulnerability: if you have no measures at all, your vulnerability is very high. If you calculate the risk based on the assumption that there are no controls, you will know the inherent risk. When determining vulnerability, discussions emerge about whether or not to take existing controls into account. For ease of use it is wise not to take existing controls into account. It will show you where you have to take counter measures (i.e., in the areas where threats and impacts are the biggest). When taking the control measures into account, you can see the effect of the controls on the specific risks.
- Impact: when discussing impact, there is the option of taking into account low and high impacts and everything in between: there might be a small fire (relatively likely) or a big fire (relatively unlikely). However, some simplification may be helpful, involving a scenario tracking only one variable or a single event. It simplifies the application of risk management. Applying multiple scenarios might make your risk assessment more detailed, but it might also give you a false sense of precision.
However, apart from the utility in applying a simple scenario, it is a good idea to think of a worst-case scenario in which everything breaks down. It will give you insight into critical operations and the potential disaster you do not want to unfold.
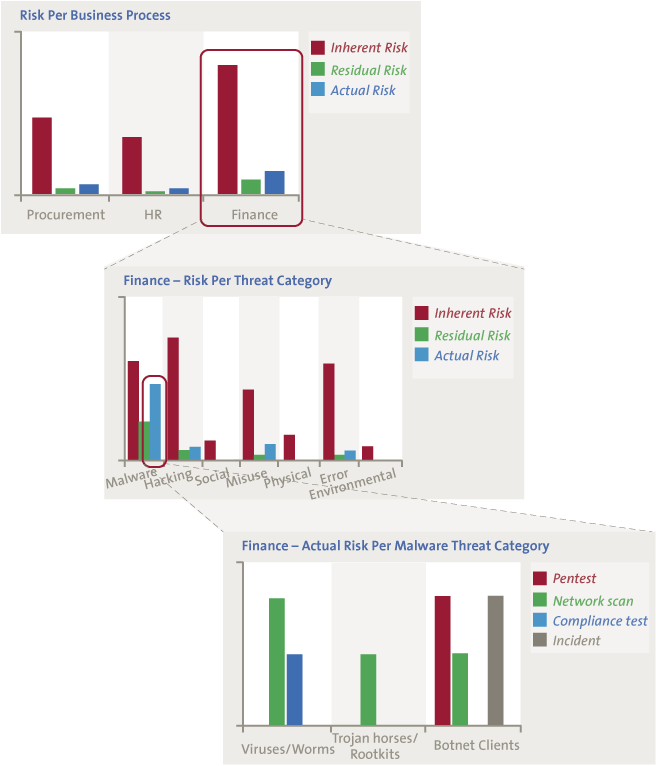
Figure 3. Drilling down in risk levels.
Deciding on control measures
When you have determined the inherent risk levels for several datasets, you need input on how much risk the organization will tolerate. We refer to the earlier paragraph on risk appetite. With this data, you can easily present views per dataset on risk levels for each threat, showing whether or not these risk levels exceed the maximum risk appetite.
Next, with repositories of control objectives, each having an assessed strength or power, you can decide which control objectives to apply. Each control objective reduces the vulnerability, and thus diminishes the risk level for specific threats. Of course we assume in this stage that the controls for these control objectives will be 100% operationally effective.
The ideal is to be able to select control objectives that will impact multiple datasets, such as password management on a network level. One control has an effect on multiple datasets, bringing down the residual risk for the company significantly. With a well-defined architecture in which infrastructure, applications, datasets and business processes are connected, you can easily demonstrate the effect of more or fewer controls, right up to the point where you approach the risk appetite levels.
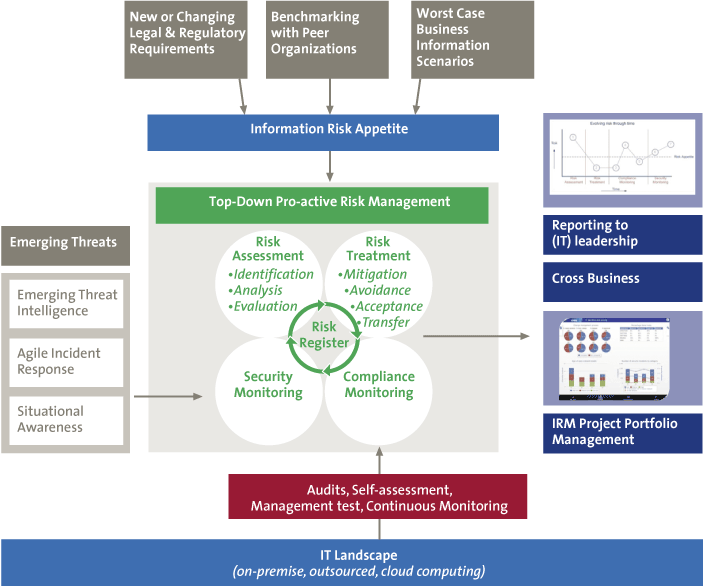
Figure 4. Connecting all the dots in the Risk Register.
Quantifying compliance
Once you have set inherent risk levels, and you have set control objectives and controls to the extent that you do not exceed your risk appetite, the next phase is processing the impact of compliance audits.
Since controls have a certain strength and capability to reduce vulnerability to certain threats, you can determine the effect of specific controls being ineffective or only partly effective. In such a case, vulnerabilities are less reduced than with a fully effective control, raising the risk levels. You can immediately see what risks have increased due to ineffective controls (the actual risk).
Just as some controls can bring down risk levels for multiple datasets/applications, the non-compliance of certain controls can have a huge impact. For example, a failure of the controls on password management on the network level will increase risk throughout the organization. Risk dashboards will instantly turn red.
Once the failing controls are successfully retested, the operational effectiveness indicator can be set to 100% again. Therefore, it is a temporary risk increase.
Quantifying security monitoring
Besides having control failures, there are also instances which cause increase in risk, but have little to do with non-compliance. For example, even though the controls regarding patching are compliant, it can happen that specific patches have not been processed, increasing the risk for certain IT systems. If this needs to be quantified, a security analyst has to determine to what level the vulnerability increases. When the patch is processed, the vulnerability will be back to normal again.
Another role of security monitoring, is threat management. At a certain moment in time threats are rated based on what happens in the environment. In times where hackers are more actively targeting the organization, threat levels will go up. By monitoring external events, but also by determining the big picture in all kinds of smaller incidents, threat management can reassess threat levels throughout the organization. Obviously this has an impact on risk levels, perhaps in such a way that risk appetite levels are exceeded. This activates the link to risk analysts, to reassess if controls must be added or removed. Then we have completed the circle as depicted in Figure 4.
Data analytics and automated security scanning
The process of translating non-compliance and security incidents to risk levels is a time consuming exercise and subject to interpretation. Certainly in large environments there is the need for efficiency. If we look forward to 2020 we envision that a major part of risk monitoring and translation into risk levels will be done by data analytics and automated scanning.
Compliance scanning on configurations is the easy part. You can define settings for password requirements, three-way match controls, backup schedules and so on. These settings can be linked to controls and scanned daily to determine compliance. Not being compliant increases vulnerability and therefore risk. This puts us closer to the real-time risk dashboarding that we talked about earlier.
More difficult to realize is processing unstructured data: for example, all kinds of incidents, results from intrusion detection systems, activity levels in hacker forums, scanning Facebook pages, Twitter and other emerging platforms in the social community. Translating this data to specific threat levels or vulnerability levels requires complex rule sets, but will certainly be the way forward in information risk management.
Keeping it practical
Using the described risk model will give management tremendous insight into the risk levels as they are today. However, if you apply the model full scope, without any form of smart adaptation, the risk- and compliance staff will be overloaded by deciding what threat levels to apply, making estimates on vulnerability levels and impact levels, et cetera. Deciding on these elements for every data set in your organization from scratch is a no-win situation. Therefore you need to ask yourself how to simplify using the model, without changing it so much as to diminish its reliability. From our experience, we can list the following simplifications:
Starting with the biggest impacts
Top-down risk analysis can identify which areas are most vulnerable to the biggest impacts were a threat to materialize. There is no sense in starting by determining risk levels in the catering process (although a bad cook will certainly diminish company morale). On the other hand, the corporate reporting process must be very accurate, and if corporate reporting were to publish the wrong information (or leak revenue figures before formal publication), the impact could be enormous.
Using a 5-point scale
Providing the users of the model with a five-point scale for assessing Threat, Vulnerability and Impact will simplify the decision as to which numbers to apply. We do not even have to think in numbers: Very Low, Low, Medium, High, Very High will suffice. Also, it will provide more assurance that different users will apply the same ratings as other users for the same situation. Using a five-point scale does not mean that behind the scenes of the model all calculations will be simple, but that’s of no concern to the user of the model. Also, it is very important to present the outcomes in terms of the same five-point scale (or the same criteria used in gathering data), because this will reinforce the meaning, coherence, and therefore acceptance of the outcome.
Threat profiles
Using threat profiles will have a major impact on the ease of use of the model. Suppose that for a certain dataset 20 threats are considered relevant. For each threat, a threat level and vulnerability level will have to be determined (as well as the impact of controls on the vulnerability). Doing this from scratch will take you a lot of time for each dataset that is embedded in this model.
Threat profiles can contain all this information as master data, and can be selected by risk analysts based on several characteristics. This data can form an excellent basis for fine tuning, but at least you will not have to start with nothing. The characteristics that form the basis for the profile selection can be varied. For example, is it an internal application or can it be reached from the outside (for example, a vendor portal). Other criteria could be internally/externally hosted, highly confidential yes/no, and so on. Each profile can contain basic assumptions on threat levels and vulnerability levels, but can also provide default control objectives and suggested controls.
There are at least two important remarks to be made. First, it must be possible that the suggested threat levels, vulnerability levels, and so on, can be fine-tuned based on the specific data set (without changing the master data of the profiles). Second, the maintenance of these profiles will affect all risk assessments in place, which means that you will need highly skilled staff to maintain these profiles. Setting the master data threat levels too high might triple all alarm bells on the dashboard of the top level information risk manager.
Including your IT-organization / service provider
One very important element of the model concerns how to include the IT department. The problem that arises when the IT department is performing risk assessments on, for example, infrastructure, is how to determine the impact of the materialization of specific threats on specific devices. For example, what is the impact if SAP were not available for one week. If SAP is used by several business units, how does the IT department determine the impact of SAP going down? The answer is simple: they don’t! They only provide threat levels and vulnerability levels. Any business unit using SAP can use the output of the risk assessment from IT and attach their own impact levels to the provided threat levels and vulnerability levels. After all, the impact can differ from business unit to business unit. One unit might only use it for time writing, the other as an overall integrated ERP-system, the third might only use it for corporate reporting and consolidation, which only needs to be available in alignment with the corporate reporting time line.
Simplifications
Although the model can be made more detailed after a certain period of use, when starting with this model it might be wise to avoid implementing certain complex correlations from the world of risk assessments. We will give some examples to illustrate this:
- Impact levels can differ in time. The impact of unavailability of the corporate reporting systems might be much higher in January then in May. You could argue for determining the risk level for each month of the year, but realizing this adds tremendously to the complexity;
- Two combined incidents might have a bigger impact than each of the events separately. When embedding this in the model, you would have to create endless scenarios of different combinations of events. By just combining two events you are far from complete. If you are not willing to complete all different scenarios, there is no point in combining some random events;
- The same goes for controls. The combination of controls failing might have other consequences based on the specific combination of controls.
The risk model is a model after all, and models will always have their limitations. The last 10% of tuning might take 99% of your time. Also, making the model more complex could lead to resistance in using the model.
Limitations to the model
Organizations moving towards a risk management model as presented in this article need to keep in mind that a model is always a simplified representation of the truth. As pointed out in this article, there are possibilities to “keep it practical” by scaling it for smaller tasks or a larger environment, as needed. However, time will need to be spent on maintaining the master data: linkage between applications and business processes, threat strengths, control strengths and such. The risk analysts working with this model in real life still have the potential to use their common sense and professional judgment, which comes with the risk of inconsistencies throughout the organization.
Furthermore it requires a significant amount of effort to create the complete enterprise-wide picture of residual and actual risk from a bottom-up perspective. However, you can already start painting the risk picture on higher levels in the organizations using a qualitative approach without any (automated) linkage with the lower levels.
Although we try to combine actual risk metrics from the operation, the risk picture is still based on an expected risk level. This means that the risk levels by no means aim to provide a mathematically accurate value: the reality might differ from the predictions. However, the model does provide the means to show where the biggest risks are and provides the details as to how these risks have emerged.
Prerequisites for the model
The model pictured in this article is not the easy-start / quick-win type of approach that suits any organization. Even for companies higher in the maturity levels in information risk management, this will still provide challenges. A few fundaments need to be available, as listed below. Note that the “80-20 rule” can be applied here: it is not necessary that each of these items be 100% complete before benefits can be realized:
- Clear mapping between business processes, information assets and IT infrastructure;
- Consistent usage of the model across the company, including by the risk analysts performing the assessment;
- Agreement on quantification methods to be used, including formulas;
- Guidance for risk analysts using the model, including descriptions per scale used;
- Agreement and maintenance of the master data, such as control strength and threat strength;
- Strong governance to ensure consistent implementation of agreed upon methodology;
Conclusion
In this article we have described how to gain insight into risks, and how these insights can be presented to top management. In comparison with qualitative models, a quantitative model can provide you with information on all kinds of questions and decisions. Where to add additional control measures? Where to remove some of them? What is the effect of a failed patch procedure on, for example, the financial reporting process, or what is the Achilles Heel in my architecture?
To get valid insight, especially in large environments, it is extremely important that everybody in the risk chain use the same definitions, threat scales, impact scales, et cetera. Furthermore, the link with top-down risk management is important. It is of supreme importance that impact levels are determined based on the relevance of a certain asset to the business. Furthermore, simplification is critical for determining impact and vulnerability levels. If it is too complex (because we all want to take into account all possible events and degrees of impact, or we want to use “hundred-point scales,”) the chance that all your risk analysts will come up with comparable results will be very small.
Information risk management is not a make-work project simply to keep IRM staff busy. The results must give meaningful input to the business as to what the consequences are for their business processes if, for example, sensitive information were to be stolen, or steering information were to become compromised.
Examples of used vocabulary:
- Threat: a potential cause of an unwanted incident, which may result in harm to a system or organization (ISO 27002). For example, a hacker or a tsunami. The level of the threat (HML), is mostly determined by external factors. If you are in a line of business where intellectual property is of high value, the threat level for “hackers” might be high. The threat level of a tsunami is low if you are located on the top of a mountain.
- Vulnerability: a weakness of an asset or group of assets that can be exploited by one or more threats (ISO 27002). For example, inadequate patching. The level of the vulnerability is determined by the context. For systems that need extensive and regular patching, the vulnerability on “inadequate patching” might be high.
- Impact: The negative effect of an event occurring. For example, when a hacker succeeds to compromise the SAP data, the impact is High: e.g., potentially in the range of a million dollars. Note that a positive impact (an opportunity) is normally not included in Information Risk Management.
- Risk: the result of Threat, Vulnerability and Impact, where the combination of the Threat and Vulnerability defines the likelihood (or also known as probability) that the impact will occur. For example: the risk of a hacker (= threat) entering our SAP system through exploits that exist due to faulty patch management (= vulnerability) causes one million dollars in loss (= impact).
- Risk appetite: the level of risk you want to accept, for example, because you estimate that preventing the risk is more costly than taking the damage. Ideally the Risk Appetite is defined on the highest level in the organization and then cascades down to the different business units/business processes. To define the level of risk appetite in an organization, some form of risk quantification is required. If you think the risk exceeds your risk appetite, you can take measures that lower the threat (for example, moving your data center to a low-earthquake region or creating goodwill in the hacker scene), take measures that mitigate the vulnerability (for example, maintaining adequate firewall management), or take measures that lower the impact (for example, remote wiping of mobile devices, mirroring data cross data centers).
Literature
Information Risk Management Vision 2020 – Compact International Edition 2013.
ISO/IEC 27001:2005 Information security management systems.
ISO/IEC 27005:2011 Information security risk management.
The Standard of Good Practice for Information Security (ISF 2012).