


History shows that fraudsters are very innovative and have developed a wide range of schemes to commit and hide fraud, like we have seen in the recent Libor scandals. In order to stop fraudsters, many organizations are looking for effective countermeasures to outsmart them. The increasing amount of available data provides new opportunities for innovative techniques to detect suspected fraudulent behavior. These techniques use characteristics from the data that fraudsters are unaware of or is extremely difficult for them to control. This approach helps fraud investigators to find signs of fraud they did not even know existed. By being innovative themselves, investigators prevent fraudsters’ schemes from succeeding.
Introduction
Analysis of fraud cases shows that the typical fraudster is 36 to 45 years old, generally acting against his or her own organization, and mostly employed in an executive, finance, operations or sales/marketing role ([KPMG13]). Above all, fraudsters are creative. Although creativity cannot be measured, the history of fraud cases reveals how creative the fraudsters are. Fraudsters exploit a wide range of vulnerabilities, from doing business with nonexistent customers, like Satyam did to inflate revenues, to executing complex financial transactions, such as Enron did to hide their debt. When the fraud is detected by investigators, the fraudsters will continue innovating to cover it up. To prevent and detect fraud, organizations need to be more innovative than the fraudsters and always one step ahead of them. We need methods so advanced and complex that they can detect even the most subtle and innovative acts of fraud, yet so simple that they are easy to use.
Any fraud investigation will start by setting out the topics and questions for investigation. Choosing which method to employ to identify possible fraudulent behavior depends on these questions. Which methods are most applicable is further limited by the available data. Several innovative solutions to detect signs of fraud activity using various types of data exist, and more are being developed. The next sections describe some of these solutions.
Innovative methods to detect signs of fraud
Investigators using traditional methods search large volumes of data for known signs of fraud, signs they already know based on their previous experience ([Rijn11]). However, such an investigation will only uncover the tip of the iceberg. To outsmart fraudsters we need methods that will also detect anomalies that may be signs of fraud, signs that investigators were not already looking for and frauds they were not already aware of. In other words, instead of looking for “things I know that I don’t know about the data,” investigators need to find “things I don’t know that I don’t know about the data,” as illustrated in Figure 1.
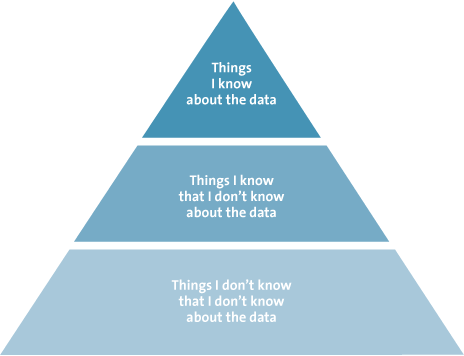
Figure 1. Information extraction pyramid.
The ever-growing amount of data poses challenges for traditional fraud investigations that will only identify a small part of the actual scams. But large volumes of data also presents opportunities for new and innovative detection methods. As data is generated following fraudulent acts, it becomes increasingly difficult for the fraudster to mask the fraud by controlling and manipulating this data trail. New analysis tools and methods can detect subtle anomalies and patterns in large amounts of data, turning the challenge of large volumes of data into an opportunity.
Pattern recognition
There is a class of innovative solutions based on recognizing patterns in data. Pattern recognition itself is not a new concept. In fact, humans perform pattern recognition on a daily basis. For example, recognizing an object as a banana is a pattern-recognition task. Humans learn to recognize bananas based on a combination of features including color, shape and size; the values for these features for a banana are “yellow,” “curved cylinder” and “15-25 cm long.” Pattern-recognition methods are based on the same principle. They use features to make inferences about the data.
The advantage of automatic pattern-recognition methods is that they can be used to read the data to learn the features of a scam. Users of these techniques do not need to define which features and values they are looking for. As a result, these methods identify things you didn’t know that you didn’t know about the data. Just as we recognize bananas based on their features, it is possible to recognize signs of fraud using specific features. For example, features describing pharmaceutical health-insurance claims include the age and gender of the patients, expenses of the claims and the dispatch rate of the medicine. When the values for these features deviate from the expected values, that may indicate fraud with the insurance claims. The insurance claims for one person who received medicine worth 60,000 euros on multiple days in a year stand out, as compared to the pattern of insurance claims of other patients. Pattern-recognition methods are able to identify combinations of a large number of features to detect deviating, possibly fraudulent, behavior.
A Bayesian network is a method that is suitable for detecting deviation from a pattern. A Bayesian network learns the relation between features. Features that are dependent on each other are connected. For example, where a transaction is entered by a user who is an employee, the date and time of that transaction should correspond to the time of day and day of the week that the employee is known to be working. The simple Bayesian network of this example is given in Figure 2.
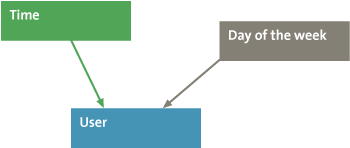
Figure 2. Simple Bayesian network.
A Bayesian network develops probability distributions that explain how the nodes and arrows interact. For example, Figure 3 shows how the user and day of the week are correlated. Since Mary never works on Mondays, the probability that Mary entered a transaction on Monday is zero. Hence Bayesian networks are able to construct probable scenarios from many features of transactions. Subsequently, the network and probability distributions are used to give a score to each possible scenario. This score indicates the likelihood of the combination of specific feature values of that scenario occurring. A very low likelihood score indicates a deviation from a pattern, which may be the result of fraud ([Rijn11]). The likelihood score of a transaction being entered by Mary on Monday is very low. So, when the pattern-recognition method finds such a transaction, it may have found a fraudulent activity. Fraud is confirmed when further investigation of the transaction reveals that Peter the cleaner used Mary’s account to transfer money to a friend’s bank account.
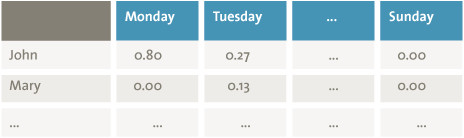
Figure 3. Probability of combinations of day of the week and presence of employee.
Process-mining techniques, a subfield of data-mining techniques, extract features from the event logs created by Enterprise Resource Planning (ERP) systems to identify business processes. These features include which activities are executed when and by whom. Process-mining techniques are able to extract the actual processes instead of the designed process. A discrepancy between the actual and designed process may indicate a violation of the procedures and therefore be a sign of fraudulent behavior ([Jans11]). Furthermore, process-mining techniques can show incomplete or incorrect processes, which could pose a risk of fraud.
Visual analysis
Visualization methods combine computational power with human pattern-recognition capabilities ([Keim06]). These methods convert complicated data into a comprehensible visual representation. Humans are able to derive useful information from this visual representation. This principle is already used in simple graphs and bar charts. These graphs and charts summarize data in a way that makes the information easier for people to grasp than if they were to try to understand it from the source data records alone. Complex graphs may be 3-dimensional and add additional information by using color. Figure 4 gives an example of a complex visualization. Increasingly innovative methods produce more advanced visualizations and allow the user to interact with this output and the underlying data. This way visualization methods can reveal unusual patterns that may indicate fraudulent behavior that is not apparent from the original data.
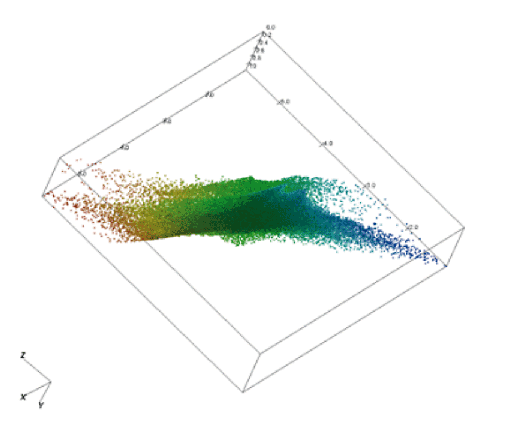
Figure 4. Example of a complex visualization.
The tool Visual Ledger is an example of an innovative method that applies visual analysis methods to visualize the series of transactions present in the general ledger. A general ledger records all the transactions relating to a company’s assets, liabilities, equity, revenue and expenses. Business processes (for example, the procurement process) result in predictable series of transactions that affect a series of general ledger accounts. Accountants rely on their knowledge and expertise to know which series are expected. Therefore accountants are able to identify any series of transactions that deviates from the expected norm. It is possible to follow these series manually. However, due to the large number of transactions in a general ledger, manual analysis is only possible for a sample of the data. Using Visual Ledger it is possible to analyze all such series of transactions. Figure 5 shows a schematic overview of the visualization produced by Visual Ledger. The tool allows the user to zoom in on the transaction details between two accounts.
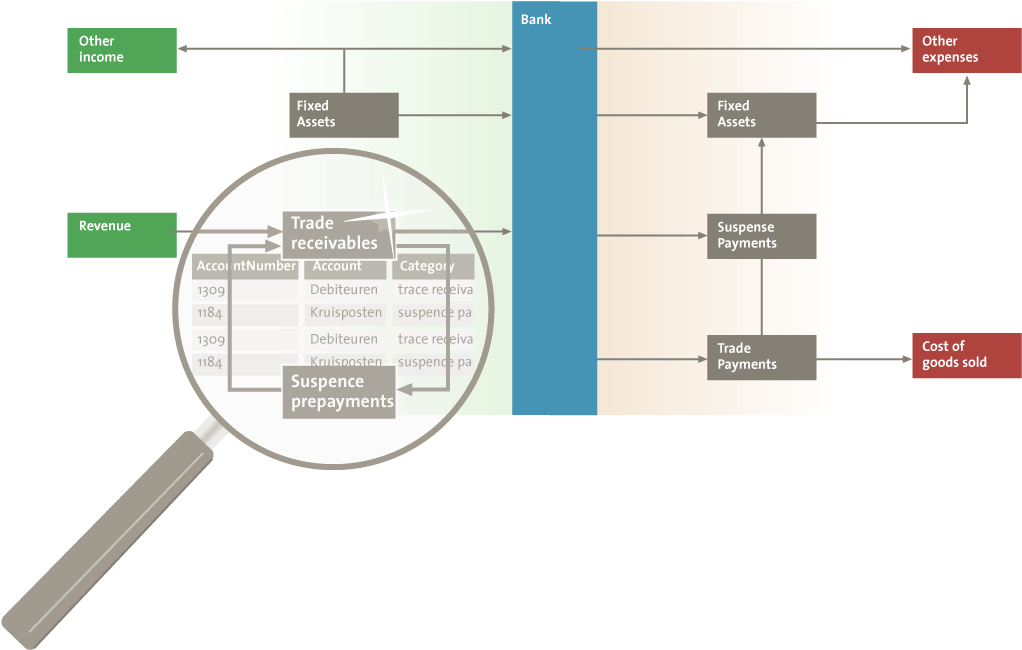
Figure 5. Schematic overview of the visualization produced by Visual Ledger. The tool allows the user to zoom in on transaction details. [Click on the image for a larger image]
The general ledger does not explicitly segregate a series of transactions. The general ledger contains all transactions performed on the general ledger accounts, but does not register which changes belong together or which succeed each other. This information is necessary to detect fraudulent behavior among the transactions. Therefore, the tool first segregates a series of transactions based on the information that is registered in the general ledger. After identifying the series of transactions, a visualization of this series is constructed.
For visualization tools to be easy to use, the visualization needs to be intuitive ([Keim06]). As an example, Visual Ledger shows how cash and cash equivalents flow into and out of the organization. Visualizing all accounts of an organization not feasible, due to the large number of accounts. However, these accounts can be grouped into larger more high-level categories ([Rijn13]). By interacting with the tool, the user is able to retrieve specific account and transaction details. Accountants can use the tool to identify unusual money flows by combining the visualization with their knowledge of what is normal for the organization. The accountant can retrieve the transaction details of the unusual flows to judge whether further investigation is required.
Text analysis
Pattern-recognition and visual-analysis methods are very useful for analyzing structured data. In addition to structured data, organizations have large amounts of unstructured data in the form of textual documents. These documents contain a wealth of information that can also be used to detect signs of fraud. The use of text in fraud investigations is not new. Descriptions of transactions are analyzed as part of ongoing anti-money-laundering measures, and e-mails are searched based on keywords. Innovative text-analysis methods automatically scan texts according to certain characteristics. These characteristics are used to analyze the texts. As a result of unconscious psychological processes, writers disclose identifiable personal characteristics or clues about whether they know the text to be truthful. Therefore, it is potentially possible to identify the author of a text or determine whether a document is likely to be fraudulent ([Fiss13], [Mark14]).
One advantage of these screening tools is that automatic text-analysis methods, unlike manual analysis, are objective. Just like the pattern-recognition techniques, the method defines features based on the data. Text-analysis methods use linguistic features extracted from the texts to detect patterns. Examples of commonly used linguistic features are word counts and grammatical word classes. Figure 6 gives an example of the word counts for two sentences. From these word counts it can be concluded that the sentences are most likely about data, and more specifically about structured data. Grammatical word classes can be extracted automatically to provide additional information about words. Figure 7 gives an example of the word classes for the sentence “The man has a large blue car.” The papers of disgraced scientist Diederik Stapel that contained fraudulent data he had knowingly manipulated used fewer adjectives than his accurate papers on his legitimate research. He also used more words that expressed certainty about the results in his fraudulent papers, as compared to the legitimate papers ([Mark14]).
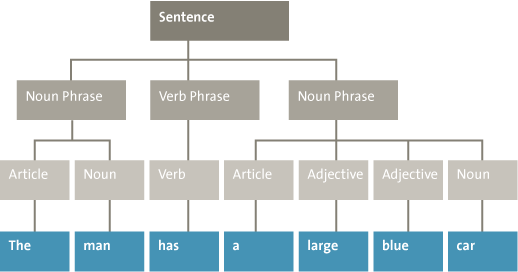
Figure 6. Example of word counts for two sentences.
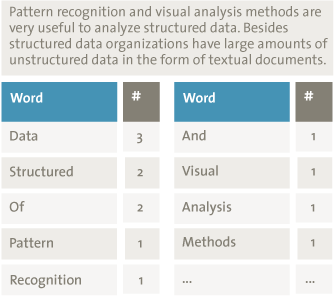
Figure 7. Example of word classes extracted from the sentence “The man has a large blue car.”
Another advantage of these screening tools is that automatic text analysis is very efficient. The manual analysis of texts is time-consuming, considering the large amount of textual documents an organization has. It is not feasible to analyze all these documents. Automatic text analysis overcomes this problem. This provides the opportunity to analyze more and larger documents. For example, a large number of annual reports can be analyzed. In the past, analysis of annual reports has focused on the financial information. However, in the last couple of years the amount of textual disclosures in annual reports has increased. These texts may contain clues indicating the presence of fraud. Currently, a method is being developed to test whether annual reports of companies where fraud was committed can be distinguished from non-fraudulent reports, based on the linguistic features of the texts.
Analysis of digital behavior
Information containing signs of fraud is not only present in the financial data and textual documents of an organization. It is also in the behavior of its employees. A lot of this behavior is captured digitally on websites and social media. Behavioral expressions can be analyzed using open-source intelligence methods. The results of these analyses can be used in several types of fraud investigations.
For example, sentiment-analysis methods can be used to analyze the writers’ emotions. These methods identify whether a piece of text contains a positive or negative emotion, or they detect a more specific emotional state of the writer. These methods can, for example, discern from a message whether the writer was happy, sad or angry. These emotions can be used in subsequent analyses. For example, sentiment can be used to distinguish true hotel reviews from deceptive hotel reviews ([Yoo09]). To prevent fraud within an organization, sentiment analysis can be used to assess the emotions and behaviors of employees. When necessary, the organization can take measures to influence the behavior of its employees, reducing the probability that dissatisfied employees will commit fraud.
Sentiment analysis uses information contained in the messages themselves. However, all documents and social media messages also have metadata that describes the document or social media message. Examples of this type of information include the name of the document author, the time of creation and location of the network on which the document was created. Metadata is stored automatically and is nearly impossible for fraudsters to influence. For insurance companies, the metadata can be very useful in determining whether insurance claims are false. For example, when a policyholder files a claim for car damage that happened in Amsterdam, metadata from social media may show that the policyholder was in New York at the time of the claimed car damage.
Metadata, optionally in combination with the actual messages and other information on websites, can be used to extract information about social networks. These networks determine which people know each other and how close their relationship is. This information can be useful in fraud investigations. For example, when John approves insurance claims a social network can show that he also approved a claim for his neighbor Jane. Figure 8 shows a very simplified social network for John, showing that he is closely related to Jane. Further investigation of the relation between Jane and John shows that they are in a close relationship. The false insurance claim was filed to cover the costs of a joint vacation.
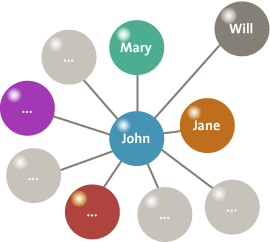
Figure 8 .Simple social network showing the relations of John.
Conclusion
Depending on the data available and the questions fraud investigators ask, an investigator can choose among several innovative solutions that are already available (or will be in the future). Each of the previously discussed methods makes use of the large amounts of available data and is able to find signs of fraud you did not know you were even looking for. These methods extract patterns from a combination of a large number of data features. It would be difficult for a fraudster to manipulate all these features in such a way that they would follow the normal patterns. Therefore, these methods have the ability to outsmart the fraudsters. With these solutions we are one step ahead. In the future, methods like the ones described will be able to predict fraud before it even happens, based on the data trails at the very early stages of fraudulent actions. With such methods we are even several steps ahead of fraudsters.
References
[Fiss13] M. Fissette, Author Identification Using Text Mining, De Connectie, 2013.
[Jans11] M. Jans, J. Martijn van der Werf, N. Lybaert and K. Vanhoof. A Business Process Mining Application for Internal Transaction Fraud Mitigation. Expert Systems With Applications, 38:13351-13359, 2011.
[Keim06] D.A. Keim, F. Mansmann, J. Schneidewind and H. Ziegler, Challenges in Visual Data Analysis. In: Proceedings of the conference on Information Visualization IV ’06, IEEE Computer Society, 2006.
[KPMG13] KPMG, Global Profiles of the Fraudster, 2013.
[Mark14] D.M. Markowitz and J.T. Hancock, Linguistic Traces of a Scientific Fraud: The Case of Diederik Stapel, PLoS ONE 9(8): e105937. doi:10.1371/journal.pone.0105937, 2014.
[Rijn11] Q. Rijnders, P. Özer, V. Blankers and T. Eijken, Zelflerende software detecteert opvallende transacties, MAB 3, 2011.
[Rijn13] Q. Rijnders, T. Eijken, M. Fissette and J. van Schijndel, Behoefte aan visuele technieken voor verbetering controle, MAB 6, 2013.
[Yoo09] K. Yoo and U. Gretzel, Comparison of deceptive and truthful travel reviews, Information and Communication Technologies in Tourism 2009: Proceedings of the International Conference. Vienna, Austria: Springer Verlag, 2009.