


Financial institutions are required to comply with regulatory reporting according the Capital Requirements Directive (CRD IV). This set of regulations and directives obliges financial institutions to report (among others) on the borne credit risk and the capital requirements. Examples of regulatory reporting include COREP and FINREP. In this article we discuss the CuRVe tool that eases the analyses of such reports and helps grasp the essence of the reported figures.
Introduction
Regulators, e.g., The Dutch Central Bank (DNB) and The European Central Bank (ECB), have been paying more and more attention to regulatory reporting, i.e., prudential reporting, such as COREP. Consequently, the bank’s management needs to be well informed about the reported figures, for them to be able to discuss these figures more effectively with the regulators. To assist banks (or credit institutions in general) in this process, CuRVe has been developed to facilitate in the following matters:
- validating the reports based on the European Banking Authority (EBA) and DNB validation rules;
- providing a dashboard, including results of diverse sets of Data Analytics, trend analyses and visualizations, which enables the user to quickly grasp essential figures and anomalies;
- the detection of outliers and discrepancies between several (subsequent) reporting periods.
CuRVe
The CRD IV package instructs the European Banking Authority (EBA) to request both capital and financial information from European banks (more generally European credit institutions and investment firms). To obtain this information, the EBA has developed reporting frameworks, which include among others the following:
- COmmon REPorting (COREP) in which capital information needs to be reported. This covers for example credit risk, market risk, operational risk and own funds.
- FINancial REPorting (FINREP) in which the financial information needs to be specified. The FINREP is based on international financial reporting standards (IAS/IFRS).
Generating this type of regulatory reports has proven to be a cumbersome process. Not only due to the technical issues that may rise during the conversion of such reports into the mandatory reporting format (XBRL), but also due to the complexity of business rules which the reports must adhere to. In addition, more complexity is involved in the process, as the required data may be sourced from many different locations and systems. Furthermore, a lack of resources to generate and review the reports on a timely basis has also proven to be a burden for banks. As a result, getting the reports ready and submitting them in time may become a primary goal, while being in control and comprehending the reported figures may diminish. To remedy this trend, it has become vital to be able to perform analytics on such reports, in order to be able to easily and fully comprehend the reported figures.
Towards this end, the CuRVe tool first transforms the CRD IV report (which is in XBRL format) into tabular data and subsequently applies the EBA validation rules to the report, to validate its internal consistency and in general its compliance with the EBA standards (for more information, see the box about “Data Point Model and XBRL”). Then, the report is subjected to several analytics, of which the results are visualized through an interactive (web-based) dashboard. The dashboard includes filters that can be applied to slice and dice or drill down into the data, allowing for visual inspection of the templates within the reports in a more intuitive way.
CuRVe Validation
CuRVe enables users to easily identify issues within the CRD IV reports, before submitting these to the ECB or other local authority. The CuRVe engine validates the reports based on the EBA validation rules. These rules are issued by EBA and test the validity, consistency and plausibility of the reported figures. Dutch banks must submit their CRD IV reports through “het Digitaal Loket Rapportage” (DLR), after which these reports will be subject to the EBA validation rules and additional DNB data quality checks. If any validation rule results in a blocking error, the report will be rejected by the DNB.
A basic validation rule as shown in Table 1, compares two values on the C 01.00 template of a COREP report. The formula states that the reported value in row 720 in column 10 should be equal to the negative of the value reported on row 970 in column 10. A failed validation will be reported in a standardized validation report.
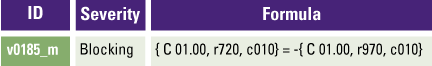
Table 1. Basic EBA validation rule. [Click on the image for a larger image]
The list of validation rules, as published by the EBA (currently version 2.7.0.1) contains 4.527 rules distributed across all CRD IV reports. These validation rules can result in more than one test, as one rule may apply to many rows and columns within a single report. Consequently, this can result in tens of thousands of validation tests. CuRVe includes a methodology to automatically test all the applicable rules for a CRD IV report and generates an overview of the failed validations. The CuRVe validation engine can process all EBA validation rules – from basic formulae to the more complex ones. Table 2 shows several validation rules along with the severity of the rule.

Table 2. EBA validation formulae examples. [Click on the image for a larger image]
CuRVe Analytics
The analytics reflect experience and insights gained over the years regarding the assessments of regulatory reporting. KPMG’s Risk & Regulatory specialists have used their in-depth knowledge to enhance the various analytics. The analyses show multiple cross sections of the reports and give insights in trends for key parameters on a quarterly basis. In this manner, irregularities and outliers may easily be detected in several parts of the reports. CuRVe allows the stakeholders, such as the bank’s management and auditors, to understand the CRD IV reports better and ask or answer relevant questions. In the past years, CuRVe has already proven its added value within the KPMG audit practice. The results of the tool have been frequently used to perform risk assessments and analytical procedures on the reports, as part of the audit process.
Figure 1 depicts an example from the set of analytics which is included in CuRVe. One of the COREP requirements is to classify each exposure into a certain exposure class (depending on the features of the underlying instrument). This analysis shows the distribution and the development of the exposure classes over time. Exposure classes that tend to be too large compared to one another or to the previous reporting period might indicate for instance an increased concentration risk. The drill-down functionality allows further examination of the exposure classes, by inspecting the included risk weights (which are used to calculate the required capital that the bank must hold) and how these have developed over time.
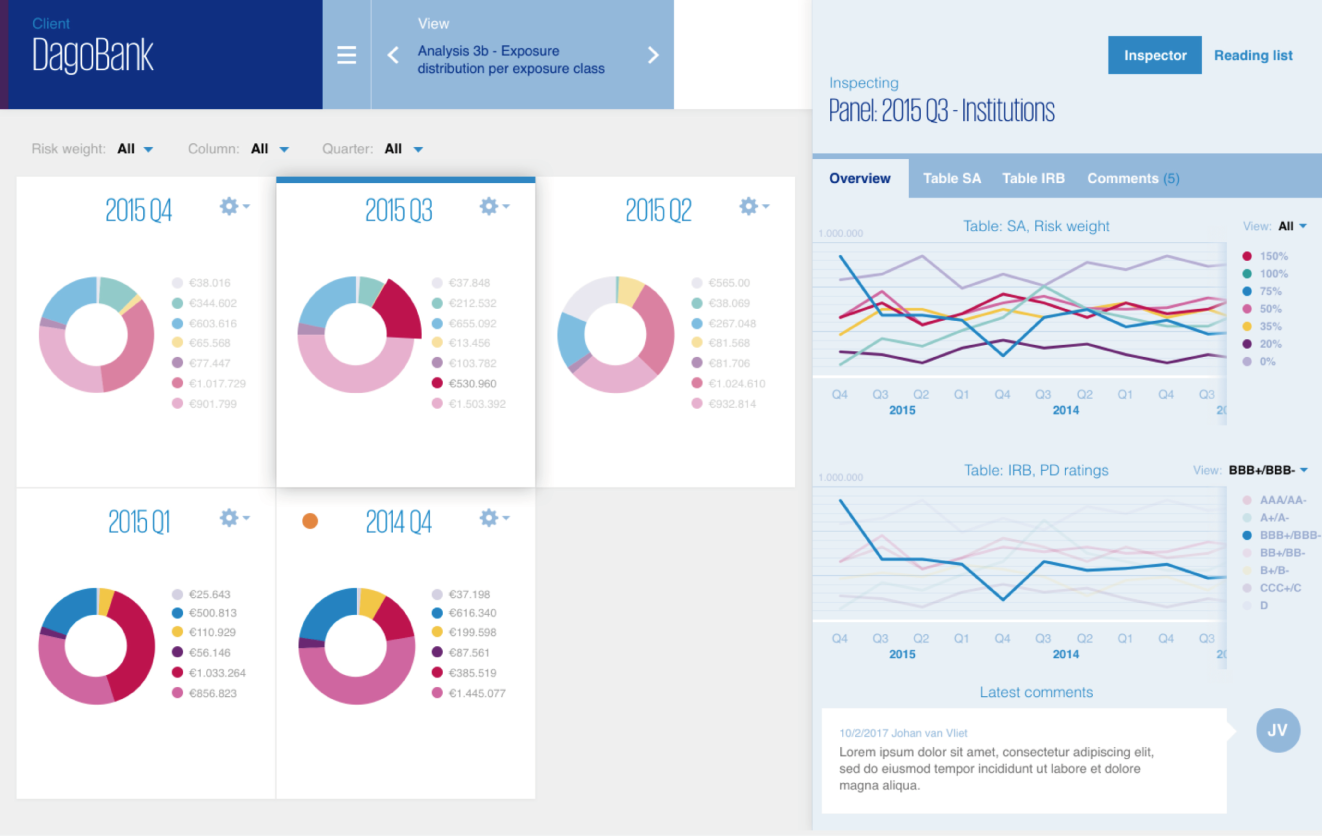
Figure 1. Development over time of the exposures per exposure class and the risk weights that are represented in these exposure classes. [Click on the image for a larger image]
Another example of an analysis that is performed within CuRVe relates to compliance with regulation. This shows the (standardized) risk weight per exposure class against benchmark risk weight bandwidths based on the regulation. A screenshot of such an analysis is shown in Figure 2. The expectation is that the risk weights (corresponding to the various exposure classes) fall within the defined bandwidth. When this is not the case, the dots will turn red instead of green, which might indicate an erroneous risk weight. Each dot corresponds to the lowest/average/highest risk weight (depending on the filter set) of a reporting period.
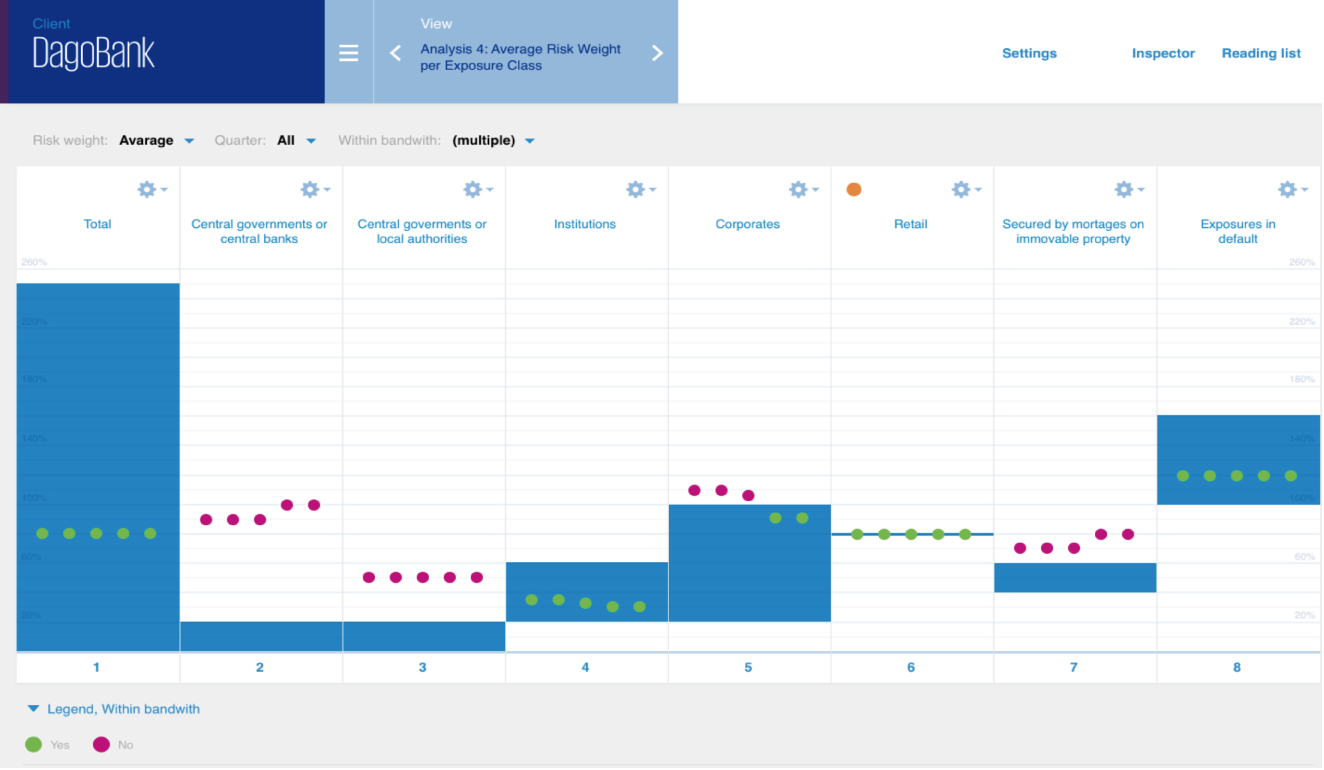
Figure 2. Visualization of standardized risk weight per exposure class relative to regulation. [Click on the image for a larger image]
A final example (Figure 3) of an analysis that is executed within CuRVe concerns the graphical breakdown of exposure. The higher the exposure amount in a country, the darker the color of the country in the dashboard. Filters can be applied to further customize the analysis. Additionally, it is possible to further drill down, to see for example the various applicable exposure classes within a certain country.
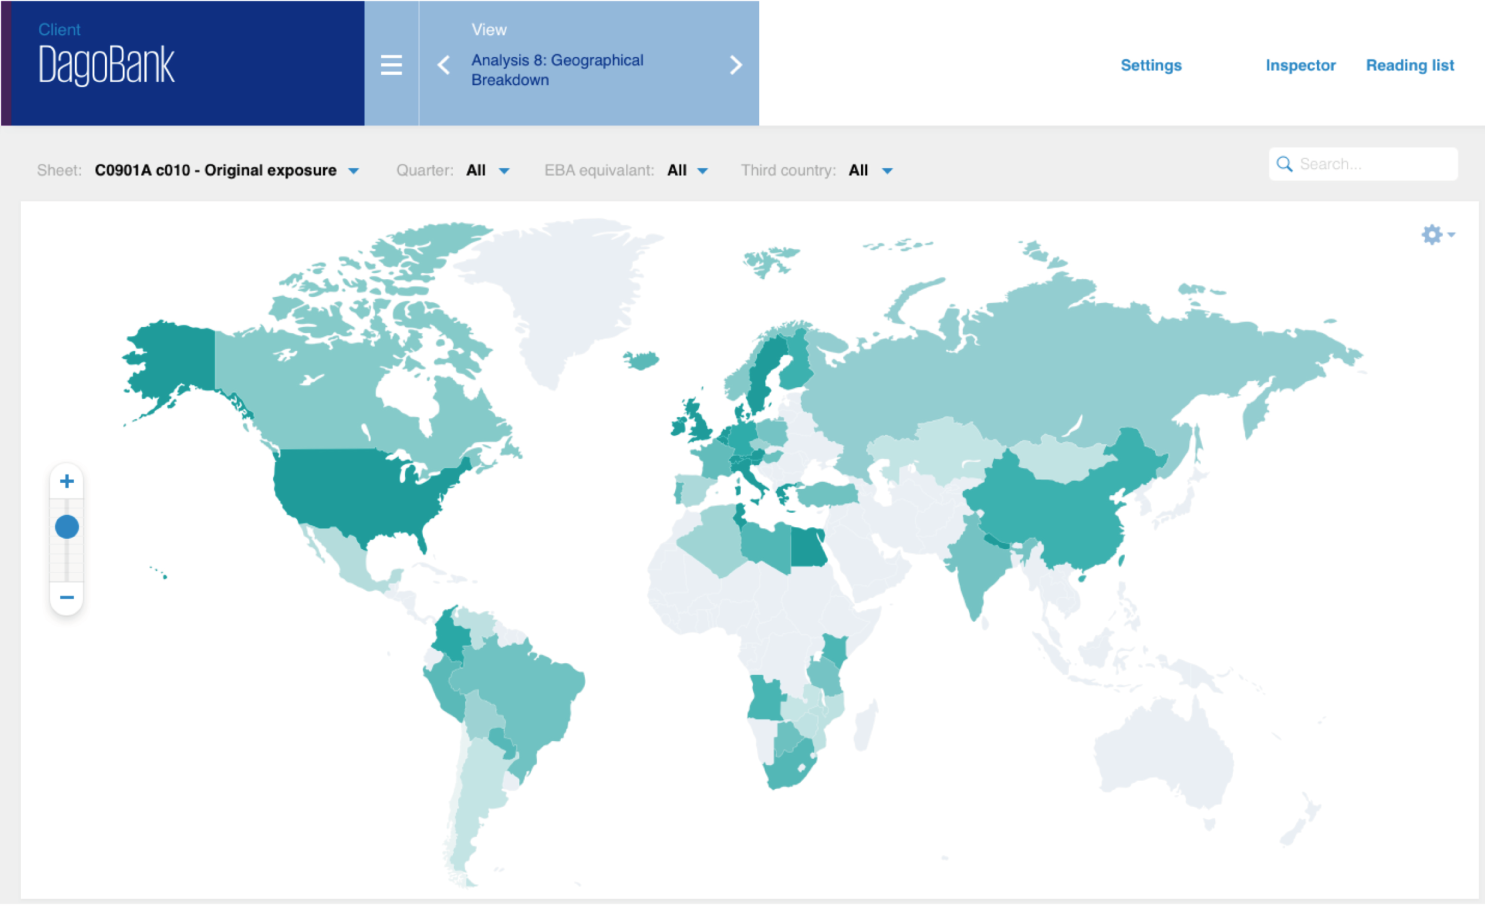
Figure 3. Geographical breakdown of exposures amounts. [Click on the image for a larger image]
Next to the discussed analyses, the CuRVe dashboard includes sixteen other analyses that provide valuable insights. By doing so, multiple cross sections of the reports are visualized and anomalies, trends and possible discrepancies between the sequential reporting periods are spotted. Finally, CuRVe also leaves room to include models that reflect the Single Supervisory Mechanism (SSM) principles. These principles represent the holistic approach of the regulators to assess the bank’s risk and capital position. The regulators use among others the governance, information relating to the bank’s business model and Key Risk Indicators (KRIs), which quantify risk areas (such as market risk, liquidity risk, credit risk, etc.) to perform a risk assessment. The KRIs may easily be calculated/obtained from the CRD IV reporting, i.e., COREP, LCR (Liquidity Coverage Ratio), etc. This type of information is therefore already included in CuRVe. The additional information relating to the governance and the bank’s business model will, for this reason, allow assessments that will be more in line with the regulators’ risk assessment of the bank.
Data Point Model and XBRL
At first sight, an XBRL1 file looks like an XML2 file which has been encrypted, combined with a lot of complex codes. And due to the way of recording the reported values in an XBRL file, the size of the file is significantly bigger than probably expected for recording only a couple of thousand values, which are reported in a regulatory report. For example: it is no exception that a report consisting of 350 values may lead to an XBRL file of 2.300 rows with ‘encrypted code’. In this example, less than 15% of the number of rows in the XBRL file contains the reported value itself.
To understand which information is included in an XBRL file, or to import the data from an XBRL file into a database to perform data analytics, the EBA Data Point Model (DPM), published and maintained by the EBA, is required. By combining the data in the XBRL file and the DPM, you can find the corresponding coordinate (template, row, column) in the regulatory report for each reported value in the XBRL.
The content of the DPM, and how to associate the XBRL with the DPM, is not a straightforward process. This will be clear when analyzing the DPM, an Access Database of 500 MB containing almost 80 tables, which is just the DPM framework. Some of these tables have hundreds to thousands of rows, and one table counts more than a million rows. The tables in the DPM contain information with respect to the current version of the DPM, but also with respect to all other older versions (taxonomies).
CuRVe is a tool that can convert each XBRL file (see Figure 4 for an example) regarding COREP, FINREP, Large Exposure, LCR and NSFR into a ‘regular’ table, i.e. a table in which the reported value and the corresponding template, row and column are stored in just a single row. All taxonomies in the DPM are imported in CuRVe, so CuRVe can import XBRL files from years ago with older taxonomies, and XBRL files which are based on the newest taxonomy.
Once the XBRL report has been converted to a flat table, the next step is to validate the report based on the EBA business rules.
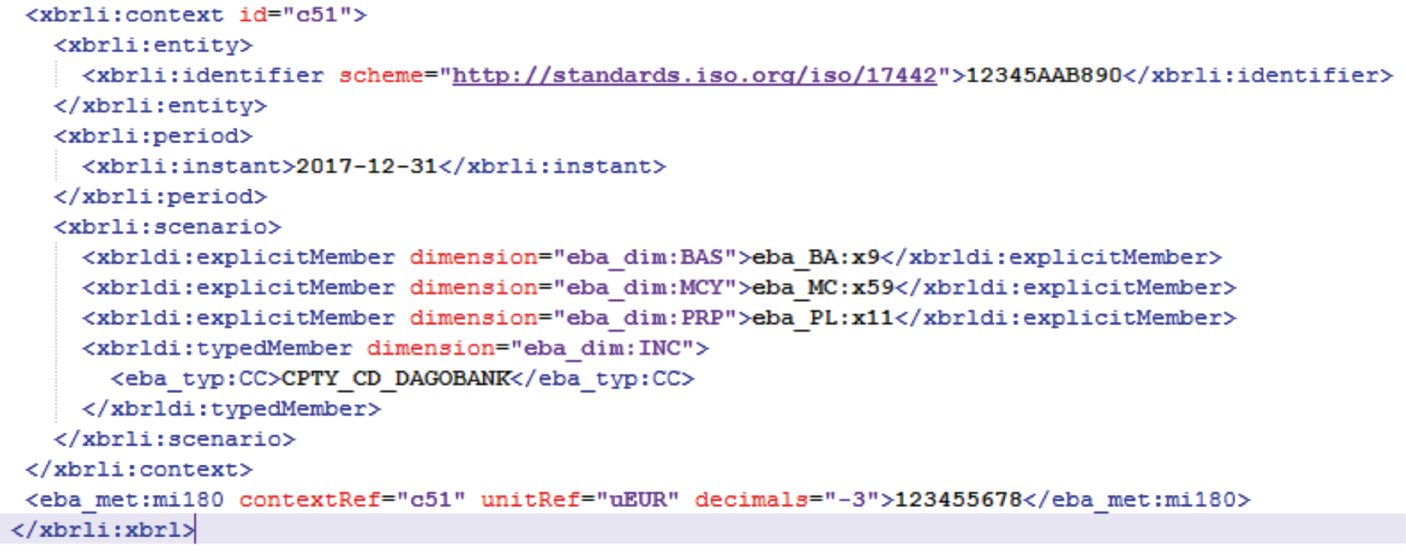
Figure 4. COREP reporting in XBRL format. [Click on the image for a larger image]
Conclusion
This article deals with how different regulatory reporting schedules may be converted to tabular data, validated and analyzed using CuRVe. This allows the CuRVe users such as analysts, the bank’s management or auditors to quickly review and gain valuable insights into the banks’ regulatory compliance, reported figures, data quality, completeness and accuracy of the report using easy-accessible (web-based) dashboards.
As a result, CuRVe may contribute in reducing the regulatory burden – for instance, through preventing re-submissions to the regulator (due to errors in the report) and preparing the management for any (report-related) queries from the regulator. In addition, (internal/external) auditors may exploit CuRVe to prepare risk assessments, perform analytical procedures and challenge the reported figures as part of their regulatory reporting audit program.
Notes
- For more information about XBRL, see: https://nl.wikipedia.org/wiki/XBRL.
- For more information about XML, see: https://nl.wikipedia.org/wiki/Extensible_Markup_Language.