


The world is being inundated with data; with every mouse click and every tweet, internet users are disclosing more and more of their private lives; GPS receivers and other sensors are being added to an increasing number of devices and products to gather data automatically; transactions are being recorded in an ever-more detailed way. This development offers organizations unprecedented possibilities to make use of valuable information about customers, markets and products. However, maximum value can only be extracted from this data if organizations are capable, in technological and organizational terms, of deploying zettabytes and petabytes of data to gain strategic advantage.
Introduction
In the book The Hitchhiker’s Guide to the Galaxy (1979), a supercomputer is asked to give the answer to “The Ultimate Question of Life, the Universe, and Everything.” The fascinating and relevant response, after 7½ million years of calculation is: 42.
Although this is fiction, this type of supercomputer seems to be just around the corner. At the beginning of 2011, an IBM supercomputer called “Watson” participated in a specially arranged version of the American TV quiz Jeopardy! with two former Jeopardy! record-holders. The questions were presented in text form and could cover every conceivable topic. For example, one of the questions was: “Harriet Boyd Hawes was the first woman to discover & excavate a Minoan settlement on this island.” Watson, with the help of 2,880 core processors, 500 GB of unstructured data, including the English version of Wikipedia, and 3,000 predictive models, managed to interpret the question faster than its opponents and give the correct answer: Crete! In this way, Watson could answer a large number of questions faster than his human opponents ([IBM]).
In real-life practice, this supercomputer is now used for a number of relevant tasks, such as the scanning of academic literature for medical specialists. By making smarter use of all the available data, many organizations also expect to gain a competitive advantage over their rivals: they expect to be better and more quickly informed about customers, market developments and internal processes, and can therefore take faster and (strategically) better decisions.
This expectation is reinforced by two trends. First, the amount and diversity of “analyzable” data available to organizations is increasing exponentially. Second, the information that can be extracted from this data is so important that organizations can even lose their raison d’être if the potential business value of this data is not fully recognized and appreciated. The overarching term for the techniques used to deal with this huge quantity and diversity of data is “Big Data.”
What is Big Data?
The term Big Data is used to classify data on an extreme scale and also covers the specific techniques to deal with this data. The concept of Big Data includes more than just “lots of data.” Big Data refers to large quantities of data that are used intensively and where traditional methods of managing this data tend to bring performance issues. Traditional relational database concepts were not designed to manage and analyze unstructured data, and therefore they cannot easily cope with environments in which data is stored in a distributed fashion. To make a distinction between traditional data and Big Data, three dimensions can be applied to measure the scale of the data:
- velocity: speed of the inflow and outflow of data in a dataset, in both reading and writing processes
- volume: the amount of available data at any given moment
- variety: the extent of differentiation in data format (numbers, text, images, video, audio).
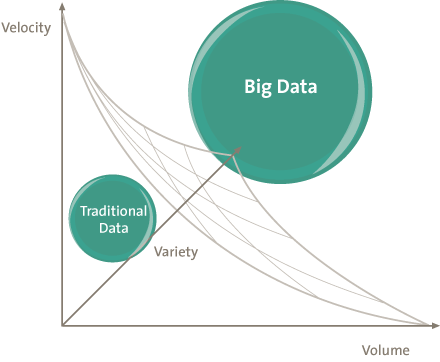
Figure 1. The data scale.
Examples of such data on a large scale include unstructured weblogs, security camera images, videos on YouTube, metadata with regard to use of internet, purchasing and searching behavior of customers in a(n) (internet) shop, and combinations of these sources. It is common to compensate any rise in data volume or the number of requests by expanding the capacity, by adding new harddisks or extra servers for example. However, the benefit of additional hardware in such situations can be limited. This is especially true if data changes regularly or if there are almost continuous flows of information, such as sensor measurements, Twitter messages or images from security cameras, and with applications that have many simultaneous users (websites and company applications can accommodate thousands of users at the same time). In such situations, there is more to be gained with more efficient steering and co-ordination with the aid of (database) software than by merely investing in hardware and bandwidth.
Techniques and methods
Brewer’s CAP theorem ([Brew00]) states that, by definition, a distributed database (divided among several servers) can only satisfy two of the three criteria (see Figure 2).
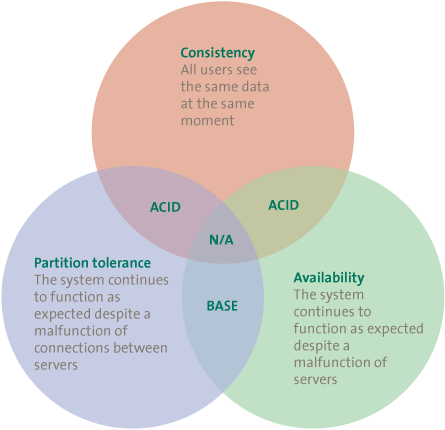
Figure 2. CAP theorem.
At present, the most frequently used type of database is the relational database. This type of database is reliable in terms of consistency and availability. A relational database consists of tables, where every table contains information on a certain topic, such as Customers or Orders. The customer’s complete address data is not usually noted at every new order. Instead, in addition to the product, quantity and required delivery date, an extra column is added to the Orders table. This extra column contains an index number that refers to a certain line in the Customers table, which contains information on the customer, including the customer’s address.
To guarantee that no data is missing or contradictions arise in the database, changes (additions, removals or adjustments) are processed in line with the four basic principles of relational databases: Atomacy, Consistency, Isolation and Durability (ACID). These principles signify the following:
- Atomacy. An operationis processed wholly or not at all.
- Consistency. References in the database must be accurate. If an order refers to a customer, the customer can only be removed if the orders are first removed.
- Isolation. The transactions are executed independently of one another, so that users are not to influence one another. If an overview of all the customers is requested for both Amsterdam and Rotterdam customers, it must not be possible for another user to simultaneously change the address of a particular customer from Rotterdam to Amsterdam, so that the same customer occurs in both lists. The result of the other user must be committed earlier or later to the database.
- Durability. After completion, committed transactions cannot be made undone, not even with a system crash or power cut.
By accepting only those transactions that comply with these specifications, a database can be set up as a consistent whole and can cope with temporary communication disruptions between components (harddisks, servers) of the database. In traditional databases with large amounts of data which is used intensively, the workload and storage are often distributed among several physical disks or servers. This requires extra steps to ensure ACID specifications in transactions. Often, records ought to be temporarily locked prior to a process, so that other processes have to wait, resulting in a lowering of performance.
The alternative to ACID are the BASE principles (Basically available, Soft-State and Eventually consistent). The core of this approach is that the various decentralized parts of the database first allow transactions to take place and only then are the transactions mutually synchronized. Databases based on the BASE principles score well on the aspects of Availability and Partition Tolerance. However, this does create the possibility of conflicting data. Various mechanisms can be applied to deal with this in real-life practice and to reduce the impact, but the problem cannot be entirely removed. However, in view of the fact that possibilities to divide a query are very important with Big Data, BASE will generally prevail above ACID in such situations. Calculation capacity and storage can be better distributed, so that the added value of extra hardware is greater. A comparison between both concepts is shown in Figure 3.
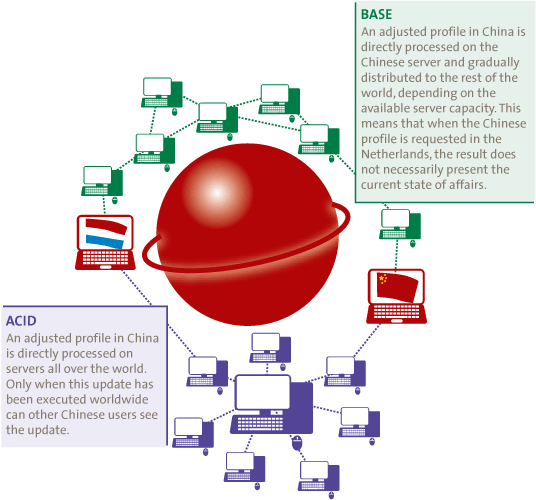
Figure 3. BASE in comparison to ACID in a profile website.
Alternatives for the relational database: NoSQL
Various alternatives are in use to replace the relational (SQL) database model while ensuring complete retention of the ACID principles. Most of these systems have their roots in one of the large-scale web services. The systems have often been developed with the nature of the data they process as their starting point. Instead of a relational database model, they use different techniques.
In the following section, we shall deal briefly with databases on the basis of a key-value store and on the basis of the BigTable concept. Other alternative methods are databases on the basis of Graph Theory (suitable for the analysis of social networks and for transport networks) and document stores for the storage and distribution of documents.
A key-value store has a top-down structure of data that resembles the hierarchy also found in an XML file (see Figure 4 for an example). This may be convenient for a database with genealogical data, as the ancestors and the descendants are placed close together, with the inclusion of relevant data such as marriages and dates of birth, for instance.
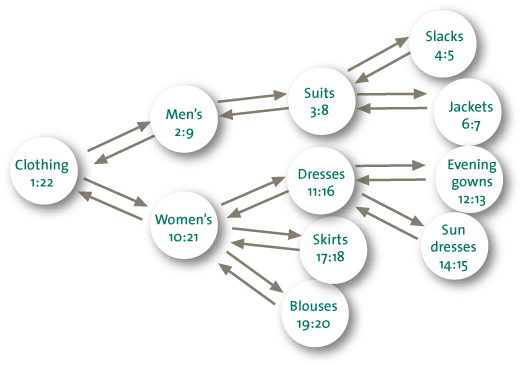
Figure 4. Example of a key-value store.
Hbase is an implementation of the Google BigTable system. Tables are multidimensional whereas a relational database has only two dimensions (rows and columns). Big Tables are physically divided into pieces of approx. 200MB. These pieces themselves can be distributed among an almost infinite number of harddisks and servers. Special META1 indexes indicate where these pieces can be found. Only the META0 index, which contains the locations of the various META1 indexes, is central to all users. In view of the fact that the nature of the data requests to META0 is very short and simple (“Where is the meta1 index for the Customer table?”), the speed of META0 will not readily form a bottleneck. The entire model is wholly scalable if the database increases on one of the aspects of Velocity, Volume of Variety. The Google BigTable is used for YouTube among other things ([Cuon07]).
Big Data analytics
Besides the management of Big Data, real value is only added when information has been gleaned from the available data. There are two reasons why the analysis of Big Data deviates from the analysis of traditional (relational) data. The first has to do with the extreme scales on which Big Data exists; consider the above-mentioned three Vs. In general, the data is distributed and often also doubly stored, and little or no use will be made of relational databases. This difference between Big Data and traditional data in their nature and storage methods leads to new techniques being needed to extract information from the available data in a meaningful way.
A second difference concerns the data preparation for the execution of analyses which differs from traditional business intelligence (BI). Whereas, with traditional BI, the emphasis lies on modeling the data in line with a previously defined data standard, with Big Data analytics the accent lies much more on statistical model-validation of the analysis itself. As a consequence, the initial formulation of a new analytical method will cost relatively much time, whereas a repeat of a same analysis procedure on new data will go faster. This means that Big Data analysis requires a different approach with regard to the data analysis methodologies used. Besides paying attention to new methods needed for the entire data analysis process (from data selection and acquisition to the testing of hypotheses and reports on these), we shall also direct our thought to techniques that can be used to perform analyses on available data rather than on the other processes in a data analysis process ([McKi11]). In addition to the techniques mentioned here, there are many other possibilities, but these lie beyond the scope of this article.
Natural language processing
Natural Language Processing (NLP) is a collective term for techniques that are used to fathom human use of language. This technique is well suited to carrying out analyses of the enormous quantities of unstructured, written information such as e-mail flows, scientific articles or internet blogs. Based on a previously defined query about a piece of text, an answer can be formulated with the aid of these techniques. In this context, one can think of an analysis of sentiment on Twitter. When the name of a company or product is mentioned in a tweet, the surrounding words can indicate whether this is a positive or negative reaction, and even its intensity can be noted. Another domain in which this technique is beginning to gain popularity is the scanning of e-mails from members of staff to identify potential fraud patterns or other breaches of integrity. One of the aspects of company fraud is an employee’s motive to commit fraud. Scanning e-mails for phrases such as “reach sales target” or “bonus” may be indications of cases of fraud.
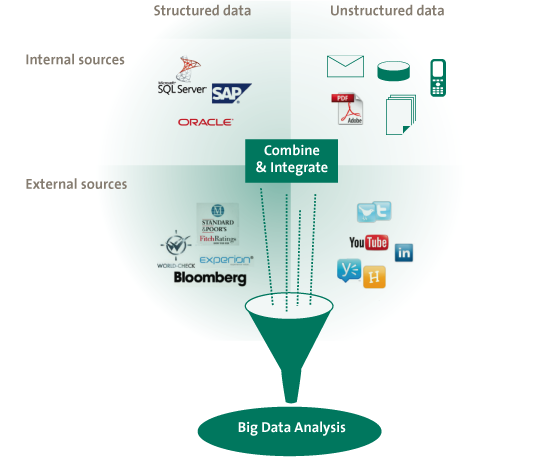
Figure 5. Big Data analysis.
Network analyses
Network or cluster analyses form a different type of analyses. Network analyses are directed toward social networks for example, and contain techniques that are used to chart the relationships, and characteristics of these relationships, between hubs in a network. This refers to, for example, information flows through a social network in the form of tweets or messages from one user to another. When networks are charted by means of this type of analysis, it is possible to determine which people are most influential in the network, or how a certain sentiment toward a product is developing. This is very valuable information for marketing purposes.
Another form of network analysis deals with neural network analysis. In this field, algorithms based on biological neural networks, such as the human brain for instance, are developed and applied to data. The aim of this is to discover non-linear patterns in data, such as the identification of dissatisfied high-value customers or fraudulent insurance claims.
Outside the digital world we can reflect on the cameras that capture the pedestrian flows on special days in European or American metropolises. The volume of such flows may depend on the behavior of almost a million people. Similar to surfing and purchasing behavior, every user follows a different path although these routes conceal data patterns and mutual dependencies. On the basis of such patterns, measures can be taken to steer these human masses.
Predictive analyses
This technique is based on statistical calculation, where the goal is to calculate the probability of a certain outcome, given one or more input variables. This kind of technique can be applied to predict the future behavior of customers in the case of, for example, a change in the layout of the shop. A much-used technique in this field is regression analysis, in which a statistical model is developed to predict the value of one dependent variable on the basis of one or more independent variables. Another technique, issuing from the realm of artificial intelligence, is “Association Rule Learning” ([Fu00]). The aim of this technique is to establish which combinations of factors will most probably lead to a certain result. Think of an analysis of sales in a supermarket. In the past, analysis based on this technique has indicated that there is a large chance that people who buy diapers will also buy beer.
Visualization of results
To present the volume of data in a practical manner, a good visualization of the analysis results is of major importance. Whereas tables or simple two-dimensional graphs are sufficient to communicate traditional data analyses, new techniques have been developed to express results from Big Data analyses. In general, it can be stated that the goal of Big Data analytics is to provide insight into several dimensions or correlations within a dataset and that these should have a primarily predictive character in the form of probability distribution. Although the output of Big Data analytics can assume the same form as traditional BI output, the discerning capability of Big Data is most apparent when use is made of strongly visualized presentations. This is probably partly because end users of the results of Big Data are further away from the data and, as a consequence, have probably developed less affinity with the available underlying data. Techniques have been developed to enable this, such as Tag Clouds, Heat-Maps, History Flows (used to follow the contributions of authors in articles for example) and Spatial Information Flows (results of an analysis are projected on a chart to visualize goods flow, for example). The old adage that a picture is worth a thousand words (or 1000 petabytes in this case) certainly applies to Big Data.
Applications of Big Data
The “Obama 2012” campaign
For the American presidential elections of 2012, Barack Obama gathered a team of academics to work on the “Dreamcatcher Project,” a scheme to establish what (potential) voters are concerned about. The “dreams” of the voters are literally captured by making use of personal narratives of voters or via social media such as Facebook and Twitter. The exact methods to translate these data into electoral behavior are known only to the campaign team. However, it will probably include elements such as the distillation of personal information such as name, address and residential data, hobbies and interests, and even information such as income group or newspaper subscriptions. The sources of all this information may be commercially available consumer data, such as Facebook profile details, submitted web forms or recorded (telephone) conversations with voters. A connection between all this available data will aid the campaign team in predicting the issues to which a voter may be sensitive and what the most likely voting outcome will be. In addition to this, merely by following click behavior of website visitors, the form in which a message ought to be presented in order to be most effective can also be determined with great precision.
Financial institutions
Whereas supervising institutions demand increasingly detailed insight into the transactions, positions and risks of financial institutions, the financial institutions themselves are experiencing an increasing need for information on processes, customers and transactions in order to be able to make predictions about the future behavior of customers, optimum price strategies, fraud patterns, possibilities of process optimization, and risk developments.
On the basis of a Big Data approach to the available data, a world of possibility can open up. For example, one can think of an improvement of the know-your-customer procedure, which is currently obligatory for financial institutions, by performing analyses of unstructured social media data and by relating them to internally available demographic and historical data on existing customers. In addition, accurate predictions about creditworthiness, credit risks (Basel III) and provisions (Solvency II) can be made at customer level. By means of a combination of data from various systems, both internal and external, in-depth insight can be gained into developments in quantitative risks and the commercial attractiveness of customer groups or products, on the basis of the historical behavior of similar customers and real-time transactions. Finally, by continually monitoring the financial transactions that are settled by the institution and by comparing these to relevant data from various other sources, patterns that may indicate fraud, money laundering, imminent bankruptcy, or funding of terrorism can be visualized even before the transaction has been settled.
Implementation issues
The above-mentioned techniques are not a substitution for current systems and processes of analysis, but can be applied as supplements. Elements of these techniques can also be found in traditional BI solutions. Where organizations actually come up against the boundaries and restrictions of the processing possibilities, the addition of Big Data concepts can open doors that would otherwise remain closed. This therefore implies that Big Data and traditional BI can and should coexist within a single organization. In this context, one can consider an organization such as Facebook, where the profiles are accessed by means of a Big Data solution, whereas the financial administration will probably operate on a traditional relational DBMS.
To enable this kind of incorporation of Big Data, a number of organizational preconditions have to be taken into account. A first question that arises in this framework concerns the location where Big Data analytics ought to take place: within an organization or outside it (outsourcing) or perhaps as a hybrid form of these two? A question related to this involves the ownership of Big Data. Should a separate BI section be made responsible for Big Data analytics or should a BI function be set up in each of the departments in order to tackle Big Data issues?
The newness of the concepts, the required advanced technical knowledge, a shortage of talent, the enormous amount of hardware, and the diversity of data sources within the organization seem to justify a centrally managed BI department. Indeed, these issues appear to be almost sufficient reason to outsource the technical implementation of Big Data analytics completely. However, Big Data analytics typically concerns strongly demand- or business-driven issues, and it requires a tight integration of the technical implementation and the department making the request. This being the case, it is necessary to seriously consider the place of Big Data analytics within the organization. The integration of Big Data solutions with the existent BI department might not even be the best solution, in view of the above-listed deliberations.
A second issue covers the physical storage and processing capabilities for Big Data. Of course, constructing a new and expensive data center to store and to access Big Data is one possibility. However, here too, the benefits may not weigh up against the required investment in time, energy and cost. An additional factor is that this new data center will be in use for only part of the time (peak times), and at the moment when full use is being made of the data center, there again may be problems with capacity. As a possible solution, two concepts that have gained popularity recently can offer the desired flexibility: data virtualization and the storage of data in the cloud.
Besides the organizational issues, Big Data also entails a number of legal or ethical ones, including that concerning the protection of privacy. Collections of data can provide information on a topic that is completely different from the one for which the data was originally gathered (data on phone-call behavior is recorded for administrative reasons but is also very useful for marketing purposes or tracing crime). Registrations that were once too large and complex to provide information leading back to specific persons can be analyzed by Big Data techniques in such a way that individuals become traceable after all. By means of text comparisons with other texts on internet, the author of an anonymous letter (or witness testimony) can probably be uncovered. In addition, Big Data is frequently used to link various data sources. By combining datasets, information that leads back to a particular person can be found (extended profiles on the basis of surfing behavior on internet). Finally, the way in which information on internet users is revealed is increasingly difficult to fathom for the user. If a setting in Facebook is not correct, it is quite possible that a profile may be shared with everyone who wishes to participate, without the user knowing anything about it.
Of course, the current measures for the protection of privacy such as the Privacy Act, for example, remain in force. But the application and enforcement of this law and other international rules may be problematic due to the combination of data files. The quantity of available data makes it difficult for supervisors to determine if a combination of data sources forms a possible breach of privacy while separate registration itself remains within the guidelines. Moreover, capacity restrictions among supervisors, such as the Data Protection Authority, also form a bottleneck. This means that an increasingly large part of the responsibility for the processing and protection of data must be borne by the organizations themselves, and thus remains out of sight of the user and the supervisor. The variations in culture throughout the world, with regard to privacy-sensitive data, make this a very complicated topic.
Pessimists believe that Big Data will hasten the end of privacy as a concept. The responsibility will indeed entail a whole new set of guidelines and criteria for organizations to ensure that privacy is still guaranteed. Supervisors must undertake progressive yet prudent action, although we believe that the end of the privacy era has not yet arrived.
Conclusion
The prospects of Big Data are promising, but an integral methodology to make optimum use of the possibilities offered by Big Data is still in the development stages. A suitable solution must be developed for each organization, and especially for each issue, where the business requirements of the organization are the guiding factor. This being the case, it is advisable to have the input of experts with knowledge of the entire transformation process: from data to information to domain knowledge to wisdom (= decisions).
The time is ripe for all organizations to consider the strategic deployment of (Big) Data. We can distinguish two variants here. First, there is the radical variant, a completely data-driven organization that is particularly suitable for start-ups or strategic re-orientations. In that case, Big Data becomes the central component in business operations. The second variant is the more gradual one, where Big Data concepts are a necessary supplement to the existing BI infrastructure and give substance to the strategic need for information.
To most existing companies, the gradual variant will be the most suitable. The relevant data can be extracted from the current environment and combined with other sources that have been inaccessible up to the present. The Big Data solutions are gradually integrated with the remainder of the systems. This gives organizations the opportunity to gain more strategic advantages by means of gradual expansion. But it is advisable to act before the competitors do, taking full account of all the risks and challenges.
References
[Brew00] E. Brewer, during ACM Symposium on Principles of Distributed Computing, 2000. Theoretically elaborated by Lynch and Gilbert in Brewer’s Conjecture and the Feasibility of Consistent, Available, Partition-Tolerant Web Services, ACM SIGACT News, Volume 33 Issue 2, 2002, pp. 51-9.
[Cuong07] C. Do Cuong, Google Techtalk, 23 June 2007, http://video.google.com/videoplay?docid=-6304964351441328559#.
[Fu00] X. Fu, J. Budzik and K.J. Hammond, Mining Navigation History for Recommendation, Proceedings of 2000 International Conference on Intelligent User Interfaces, New Orleans, 2000, pp. 106-12.
[IBM] IBM IBMWatson, http://www-03.ibm.com/innovation/us/watson/index.html.
[McKi11] McKinsey Global Institute Big Data: The next frontier for innovation, competition, and productivity, 2011.