
Software Asset Management: een framework volgen is niet genoeg

Aantoonbaar compliant zijn in het gebruik van softwarelicenties is voor heel veel organisaties een grote uitdaging. Deze uitdaging wordt in steeds grotere mate aangepakt en wordt vaker op de agenda gezet van de IT-organisatie die zich wil voorbereiden op de toekomst. Software Asset Management (SAM) kan hierbij uitkomst bieden. Aan de hand van beschikbare vakliteratuur en expertise van professionals kan SAM worden geïmplementeerd. De vakliteratuur voorziet in diverse methodieken en frameworks om SAM binnen organisaties te implementeren. SAM-specialisten hebben de ervaringen en kennen de do’s en don’ts van SAM-implementaties. Aan de hand van een analyse van beschikbare frameworks en interviews met experts binnen het vakgebied worden in dit artikel tien kritieke succesfactoren geïdentificeerd die aanwezig zouden moeten zijn om ‘in control’ te komen met betrekking tot de gehele software lifecycle.

Inleiding

Het blijkt voor organisaties een lastige klus om het beheer en gebruik van softwarelicenties in overeenstemming te brengen met daarvoor geldende gebruiksvoorwaarden. Of het nu overheidsinstanties, onderwijsinstellingen of grote multinationals betreft, het is kennelijk een grote uitdaging om compliant te zijn voor wat betreft de licentiepositie.

Vooralsnog is hier geen eenduidige oorzaak voor aan te wijzen. Op basis van onze ervaringen met onze SAM-dienstverlening en vanuit inventarisaties die zijn uitgevoerd ([KPMG13a], [KPMG13b]), blijkt dat een veelvoud aan mogelijke oorzaken hieraan ten grondslag kan liggen. Zo kunnen de door de softwareleveranciers opgestelde gebruiksvoorwaarden die aan het gebruik van de software verbonden zijn, complex en onduidelijk zijn. Het gebruik van serversoftware en virtualisatie blijkt een combinatie te zijn die een grote (ongewenste) impact kan hebben. Daarnaast kan het gebeuren dat er geen duidelijkheid bestaat over beschikbare licenties. Dit kan worden veroorzaakt door acquisities, fusies of desinvesteringen, maar bijvoorbeeld ook door aanwezigheid van meerdere afdelingen die zelfstandig bevoegd zijn om licenties in te kopen als gevolg van een onduidelijke (of decentrale) IT-governance. Behalve dat er beperkt zicht is op beschikbare licenties, kan er ook onduidelijkheid bestaan over het gebruik van de software. Ook dit kan weer vele oorzaken hebben. Een onvolledig beeld van de aanwezige hardware leidt ertoe dat geïnstalleerde monitoring tools geen volledig beeld van de software-installaties geven. Ook kan er sprake zijn van agents van monitoring tools die niet geïnstalleerd zijn op alle hardware binnen de organisatie of monitoring tools die niet alle geïnstalleerde software herkennen en dus onvolledig of onjuist rapporteren.

Wanneer een softwareleverancier door middel van een software-audit een licentietekort heeft geconstateerd, dienen de licenties in overeenstemming te worden gebracht met de geïnstalleerde software, vaak ongeacht of deze daadwerkelijk wordt gebruikt binnen de organisatie. Dit kan een aanzienlijke negatieve financiële impact op de organisatie hebben. De kosten die hiermee samenhangen, kunnen oplopen tot enkele honderdduizenden of zelfs miljoenen euro’s. De grootste boosdoener hierbij is vaak het eerdergenoemde gebruik van serversoftware binnen gevirtualiseerde omgevingen.

Naast mogelijke financiële consequenties brengt inadequaat softwarebeheer ook andere risico’s met zich mee. Zo brengt onbeheerde software beveiligingsrisico’s met zich mee. Het installeren van updates en patches vindt namelijk lang niet altijd op geautomatiseerde wijze plaats, waardoor onbeheerde software snel veroudert en zo een potentieel beveiligingsgevaar voor de organisatie vormt.

KPMG ondersteunt organisaties in hun uitdaging om softwarelicenties en softwaregebruik te beheersen. Doelstellingen hierbij zijn risico’s te beheersen, kosten te verlagen en de IT-operatie effectiever te maken. Wij richten ons hierbij op de pijlers mensen, processen en tooling binnen alle fasen van de software lifecycle. Uitgangspunt hierbij zijn de bestaande ISO/IEC 19770-1- en ITIL-methodieken, tenzij wij ons desgevraagd richten op specifieke software vendors of andere aan software gerelateerde aandachtsgebieden.

Wat is Software Asset Management?

Al deze mogelijke gevolgen die het gebruik van software kan hebben, leiden ertoe dat organisaties niet ‘in control’ zijn met betrekking tot software in brede zin. Om aan deze problematiek tegemoet te komen zijn handvatten ontwikkeld om het proces van softwaregebruik wel in goede banen te leiden. Door SAM te implementeren kunnen de hiervoor genoemde problemen worden aangepakt.

Bij softwaregebruik wordt al snel uitsluitend gedacht aan het gebruik hiervan door de eindgebruikers, maar SAM is breder dan dat. Kortgezegd omvat SAM het totale proces rondom het beheer en de optimalisatie van planning, inkoop, implementatie, onderhoud en uitfasering van software. De scherpe lezer herkent hier de verschillende levensfasen in die met softwaregebruik samenhangen. Dit wordt dan ook wel de software lifecycle genoemd. In figuur 1 is het door KPMG ontwikkelde licentiemanagementmodel weergegeven.

C-2016-2-Huijsman-01

Figuur 1. KPMG-licentiemanagement- en software-lifecyclemodel.

De beheersing van de activiteiten binnen de software lifecycle dient uiteindelijk te leiden tot een adequaat (administratief) beheer van de IT-middelen van een organisatie. In zowel ITIL als ISO/IEC 19770-1 wordt aandacht besteed aan de SAM-praktijk. Hierin wordt SAM gekenmerkt door de volgende karakteristieken:

  • SAM is een zakelijke werkwijze waarbij zowel technologie, processen als mensen betrokken zijn.
  • SAM heeft voornamelijk betrekking op software die de meeste impact heeft op de bedrijfsvoering. Dit houdt concreet in dat gezien de operationele impact SAM zich meer richt op serversoftware dan op software op werkstations.
  • Vaak zijn meerdere afdelingen betrokken bij SAM, denk hier bijvoorbeeld aan IT, Juridische Zaken, Financiën, HR en Inkoop. SAM is dan ook een multidisciplinair proces ([BSA15]).
  • SAM betreft niet alleen een implementatietraject, maar ook het continu onderhouden hiervan ([Rudd09]).

Waarom Software Asset Management?

Met behulp van SAM kan een drietal doelstellingen worden bereikt: ‘in control’ zijn ten aanzien van kosten, het managen van risico’s gerelateerd aan softwaregebruik en de realisatie van efficiencyvoordelen.

  1. Bij ‘in control’ zijn ten aanzien van kosten kan bijvoorbeeld worden gedacht aan een betere onderhandelingspositie die met softwareleveranciers kan worden bewerkstelligd wanneer er een duidelijk beeld is van beschikbare licenties en in gebruik zijnde software. De kans op hernieuwde aanschaf van licenties die de organisatie al bezat en van wellicht ongebruikte licenties, zal dan ook afnemen. Bovendien is de organisatie beter in staat de behoefte aan nieuwe software en onderhoud daarvan te inventariseren.
  2. De kans op negatieve financiële gevolgen door een licentiereview wordt eveneens kleiner en dit betekent een beheersing van het risico op een situatie van non-compliance. Een ander risico dat met SAM geminimaliseerd kan worden is het beveiligingsrisico. Met SAM verbetert het versie- en patchmanagement en kunnen onderbrekingen in de bedrijfsvoering voorkomen worden.
  3. Ten slotte kan bij de realisatie van efficiencyvoordelen gedacht worden aan kwalitatief betere besluitvorming doordat duidelijk is wat de behoeften zijn op het gebied van softwaregebruik. Verder kan SAM het mogelijk maken om voortvarend nieuwe functionaliteiten uit te rollen, waardoor deze snel in gebruik kunnen worden genomen. Een transparant SAM-proces zorgt ervoor dat overnames en fusies tussen partijen soepeler verlopen en dat een organisatie minder tijd en inspanning kwijt is aan de medewerking bij een software-audit.

Deze voordelen zijn kansen die bij uitstek passen bij de IT-organisatie die zich ontwikkelt en verder professionaliseert. Daarnaast worden organisaties vanuit wet- en regelgeving steeds meer gedwongen om de waarde van hun belangrijkste bedrijfsmiddelen inzichtelijk te maken in het kader van de betrouwbaarheid van hun financiële verslaglegging. Zo is een van de primaire doelstellingen van SOx interne controle waarbij specifiek de nadruk op de beheersing van IT wordt gelegd. ‘In control’ zijn met betrekking tot IT is volgens SOx van cruciaal belang om interne controle te bewerkstelligen ([Wiki15], [Inve15]). In de Nederlandse wetgeving ligt de wettelijke verplichting om ‘in control’ te zijn met betrekking tot softwaremiddelen impliciet verankerd in de accountantsverklaring. Artikel 2:393 van het Burgerlijk Wetboek bepaalt dat de accountant melding dient te maken van zijn bevindingen met betrekking tot de betrouwbaarheid en continuïteit van de geautomatiseerde gegevensverwerking. Om een dergelijke uitspraak te kunnen doen is allereerst van belang dat er een overzicht is van de hoeveelheid gebruikte softwaremiddelen binnen een organisatie. Programmatuur die onbekend is en niet beheerd wordt, kan een potentieel beveiligingsrisico vormen en dus van impact zijn op de continuïteit van de IT-omgeving (en dus geautomatiseerde gegevensverwerking). De software wordt dan immers niet voorzien van de nieuwste updates en patches, waardoor deze een risico voor de organisatie vormt ([Geff15]). Nu zal het niet zo’n vaart lopen dat een accountant geen goedkeurende controleverklaring afgeeft bij gebrek aan SAM, maar het geeft het belang hiervan wel aan. Het spreekt natuurlijk voor zich dat iedere organisatie belang heeft bij SAM. Dit vult bij uitstek de verplichting van het bestuur in om de organisatie goed te besturen. Dit is beter bekend als corporate governance.

Een vaak gehoord geluid is dat wanneer gebruik wordt gemaakt van de cloud of een cloudoplossing, de uitdagingen op het gebied van SAM minder groot zijn. Dit is slechts ten dele waar. SAM is juist een kritieke succesfactor als gebruik wordt gemaakt van cloudoplossingen om ervoor te zorgen dat de voordelen van de cloud niet worden overschaduwd door de financiële nadelen bij gebrek aan adequaat SAM.

SAM-methoden onder de loep

In de vakliteratuur zijn diverse methodieken en frameworks beschikbaar die organisaties kunnen helpen om SAM te implementeren. Aan de hand van een analyse van beschikbare frameworks en interviews met experts binnen het vakgebied identificeren we in dit artikel enkele kritieke succesfactoren die binnen een organisatie aanwezig moeten zijn om ‘in control’ te kunnen komen van de gehele software lifecycle. We kijken naar zowel ITIL als ISO/IEC 19770-1. Een derde algemeen geaccepteerd framework is CobiT. Naar onze mening biedt dit echter te weinig houvast met betrekking tot SAM omdat CobiT zich richt op IT-beheersing in algemene zin. Een aantal subdomeinen binnen CobiT heeft wel raakvlakken met SAM, maar CobiT biedt verder weinig concrete handvatten om tot een gefaseerde implementatie te komen.

ISO/IEC 19770-1

ISO/IEC 19770-1 is een erkende standaard voor SAM die zich richt op implementatie van SAM binnen een organisatie aan de hand van vier tiers. Met een conceptueel raamwerk kunnen de doelstellingen van de verschillende tiers worden bereikt. Deze tiers zijn Organizational Management Processes for SAM, Core SAM Processes en Primary Process Interfaces for SAM, die weer kunnen worden onderverdeeld in subcategorieën.

De eerste tier richt zich op het bewerkstelligen van betrouwbare data waarmee de licentiepositie kan worden bepaald. Dit is immers een voorwaarde om de doelstellingen van SAM te kunnen bereiken. Voornamelijk de volledigheid en de juistheid van informatie zijn hierbij belangrijke uitgangspunten. Dit vormt de basis voor de hoogst erkende prioriteit van SAM: licentiecompliance. Tier 1 richt zich primair op het inrichten van processen om softwaremiddelen te kunnen identificeren zodat aan de hand daarvan een licentiepositie kan worden gecreëerd.

Tier 2 richt zich op het praktische management zoals het verbeteren van managementcontrole en voordelen hieruit. Risico’s zijn geïdentificeerd en verantwoordelijkheden hieromtrent toegewezen. Denk hierbij aan verzekeren dat verantwoordelijkheden voor softwaregebruik worden erkend door het bestuur en management van de organisatie. Verder richt tier 2 zich onder meer op het ervoor zorg dragen dat de organisatie beschikt over de juiste SAM-expertise en het onderhouden hiervan. De doelstellingen van tier 2 zijn dan ook tweeledig: het behalen van quick wins en het creëren van een controleomgeving.

In tier 3 wordt SAM geïntegreerd met andere operationele processen binnen de organisatie, waardoor meer effectiviteit en efficiëntie wordt bereikt. De van toepassing zijnde processen richten zich grotendeels op de integratie met overige operationele IT-beheerprocessen die in overeenstemming zijn met andere ISO-normen, zoals ISO/IEC 12207, System and Software Engineering en ISO/IEC 20000, IT Service Management. De nadruk wordt gelegd op de belangrijkste software-lifecycleprocessen, zoals acquisitie, gebruik en uitfasering, en integratie hiervan met andere operationele bedrijfsprocessen.

De laatste tier is bereikt wanneer SAM niet alleen is geïntegreerd in de operationele processen, maar tevens is opgenomen in de strategische planning. SAM voldoet verder aan alle in ISO/IEC 19770-1 gestelde eisen. Zo vindt continu toezicht plaats of de doelstellingen van SAM worden en zijn bereikt en of nog verbetering mogelijk is. Tevens voldoen alle SAM-processen aan de toepasselijke eisen van informatiebeveiliging (zoals neergelegd in ISO/IEC 27001 en voor de praktische aspecten in ISO/IEC 27002).

C-2016-2-Huijsman-02

Figuur 2. ISO/IEC 27001: de vier tiers van SAM.

ITIL

ITIL richt zich op het IT Service Management binnen een organisatie en gaat, in tegenstelling tot ISO, in op de wijze waarop de doelstellingen van SAM gerealiseerd kunnen worden. ITIL benadrukt dat de overkoepelende doelstelling van SAM een goed werkende corporate-governancestructuur is. Aan de hand van een schaalbare en gestructureerde benadering kan dit worden bewerkstelligd. Het ontwikkelen van een duidelijke visie en strategie van het management wordt in ITIL aangemerkt als eerste belangrijke fase. De visie en strategie dienen in lijn te liggen met de algemene doelstellingen. Belangrijk hierbij is dat de risico’s die aan softwaregebruik verbonden zijn, bekend zijn. Daarna dient een algemeen beleid met betrekking tot SAM te worden opgesteld en dient dat binnen de organisatie te worden gecommuniceerd. Het beleid moet periodiek kunnen worden herzien als dit wenselijk wordt geacht naar aanleiding van bijvoorbeeld een uitgevoerde risicoanalyse. Denk hier bijvoorbeeld aan gewijzigde eisen ten aanzien van rapportageverplichtingen richting softwareleveranciers over het gebruik van software binnen een gevirtualiseerde omgeving. Een dergelijke wijziging kan ertoe leiden dat er geen periodieke consolidaties gemaakt dienen te worden tussen beschikbare licenties en het gebruik van software, maar dat dit op continue basis dient plaats te vinden, waardoor aanpassing van het beleid noodzakelijk is. Bovendien zorgt het management ervoor dat personen met verantwoordelijkheden binnen SAM voldoende capaciteiten hebben om deze te kunnen uitvoeren. Verder richt ITIL zich op het ontwikkelen en implementeren van SAM-processen en ‑procedures.

Daarnaast is voor SAM het bewerkstelligen en onderhouden van een managementinfrastructuur waarbinnen SAM-processen kunnen worden geïmplementeerd van belang. Hieronder vallen logistieke processen, relationele processen (met onder andere softwareleveranciers) en asset-managementprocessen die erop gericht zijn software te herkennen en onderhouden. Essentieel is hierbij de SAM-database, die de basis vormt voor een goed functionerend SAM-systeem door te beschikken over volledige en juiste informatie. De SAM-database bestaat behalve uit bijvoorbeeld een CMDB, ook uit andere informatie die nodig is voor SAM, zoals overeenkomsten met softwareleveranciers, toepasselijke licentieregels en toegekende licenties aan bepaalde functies of personen. Nadat SAM is geïmplementeerd, zal er doorlopend onderhoud plaatsvinden aan de SAM-database om de informatie die hierin is opgeslagen in overeenstemming te houden met aanverwante disciplines zoals continuity of operations en capacity management. Regelmatige review en verbetering dient plaats te vinden om efficiency en effectiviteit van SAM-processen te vergroten.

C-2016-2-Huijsman-03

Figuur 3. De principes van SAM (ontleend aan [Rudd09]).

Interviews met SAM-experts

Om te kunnen bepalen welke kritieke succesfactoren binnen een organisatie aanwezig zouden moeten zijn om SAM tot een succes te maken, is niet alleen gekeken naar theoretische frameworks maar ook naar de ervaring van experts binnen het SAM-werkveld. Twee SAM-managers, werkzaam bij een semioverheidsinstelling en een grote financiële instelling, hebben de standaarden en uitgangspunten die in ITIL en ISO/IEC 19770-1 zijn neergelegd, kritisch geëvalueerd. Uit deze evaluatie is onder andere gebleken dat zowel ITIL als ISO/IEC19770-1 te weinig aandacht besteedt aan het cultuuraspect binnen een organisatie. Om de doelstellingen van SAM te kunnen realiseren is meer nodig dan het implementeren van een aantal tools en processen. Het borgen van medewerking en ondersteuning vanuit diverse lagen van de organisatie is van groot belang. Cruciaal is dat de support vanuit zowel het management als betrokken partijen bij de software-lifecyclefasen gehandhaafd blijft. Juiste en volledige informatievoorziening door middel van bijvoorbeeld rapportages of kostendoorbelastingen aan deze betrokkenen kan een belangrijk hulpmiddel zijn om deze betrokkenheid te behouden en bewustzijn te vergroten.

Ten aanzien van processen binnen de software lifecycle is bovendien gebleken dat het creëren van continue traceerbaarheid van assets (‘closed loop’) ertoe bijdraagt dat organisaties ‘in control’ komen van hun software assets. Dit is niet alleen van belang tijdens het gebruik van de software, maar ook bij het uitfaseren en het zorgdragen dat licenties ook weer ingetrokken worden en beschikbaar komen. Mocht integratie niet met alle stadia van de software lifecycle bewerkstelligd zijn, dan is het in ieder geval van belang dat SAM-relevante informatie uiteindelijk wel beschikbaar is. Denk bijvoorbeeld aan uitfasering van een server en het vrijkomen van licenties. Bij voorkeur wordt de licentiepositie van de betreffende software hierop automatisch aangepast. Mocht dit niet mogelijk zijn, dan is het wel van belang dat deze informatie beschikbaar is zodat periodiek een afstemming gemaakt kan worden tussen het softwaregebruik en de beschikbare licenties.

Handvatten ten aanzien van SAM

Kijkend naar ISO/IEC19770-1 kunnen we concluderen dat er voldoende concrete eisen worden gesteld om SAM succesvol te kunnen implementeren. In de norm wordt echter niet ingegaan op de wijze waarop deze eisen gerealiseerd kunnen worden. Hierdoor is het onwaarschijnlijk dat SAM succesvol geïmplementeerd kan worden met behulp van ISO/IEC19770-1 alleen. Door het hanteren van verschillende tiers wordt tegemoetgekomen aan verschillende ambitieniveaus van organisaties. Het nadeel hiervan is dat pas bij het bereiken van de laatste tier alle mogelijke doelstellingen van SAM gerealiseerd kunnen worden. Gezien de hoeveelheid normen behorend bij deze tier, kunnen we vraagtekens plaatsen bij de haalbaarheid hiervan in de praktijk. Als deze tier behaald wordt, is het de vraag of de voordelen opwegen tegen de gemaakte kosten en gedane inspanning. Verder ontbreekt het aan duidelijke meetindicatoren op basis waarvan kan worden vastgesteld dat een bepaald stadium is bereikt. ITIL richt zich meer op het operationeel managementniveau en de wijze waarop SAM geïmplementeerd kan worden. ITIL biedt dan ook concretere handvatten dan ISO/IEC19770-1 voor de implementatie. ITIL maakt aan de hand van een aantal principes gebruik van een schaalbare en gestructureerde benadering. Voor integratie van SAM met overige bedrijfsprocessen wordt echter verwezen naar andere ITIL-modules, zoals Service Strategy, Design, Transition, Operation en Continual Service Improvement. Hierdoor zal een SAM-implementatie meer omvatten dan de normen genoemd in deze specifieke ITIL best practice.

Tien kritieke succesfactoren

Na analyse en gesprekken zijn tien kritieke succesfactoren geïdentificeerd die voor een succesvolle implementatie van SAM kunnen zorgen.

  1. Budget
  2. SAM-technische capaciteiten
  3. Licentiekennis
  4. SAM-medewerkers
  5. Bewustzijn
  6. Hiërarchie
  7. Managementondersteuning
  8. Rapportages
  9. SAM-databases
  10. Closed loop
1. Budget

Het besteedbaar bedrag dat beschikbaar wordt gesteld, moet voldoende zijn om de doelstellingen van SAM te kunnen realiseren. Dit budget kan bijvoorbeeld worden aangewend om personeel bij te scholen, SAM-expertise binnen te halen of SAM-tooling aan te schaffen.

2. SAM-technische capaciteiten

De organisatie beschikt over voldoende medewerkers met technische capaciteiten op het gebied van SAM. Zo beschikken functioneel beheerders over kennis van configuraties van de software en zijn zij zich bewust van mogelijke (financiële) implicaties van af te nemen licenties.

3. Licentiekennis

Kennis is beschikbaar ten aanzien van complexe gebruiksvoorwaarden van licenties en wat dit voor het softwaregebruik kan betekenen. De focus ligt op het afnemen van de optimale licentievorm voor de organisatie, waarbij een balans wordt gevonden tussen kosten, gebruiksgemak en beschikbaarheid van de software.

4. SAM-medewerkers

Er zijn voldoende fte’s aanwezig om de gestelde doelstellingen van SAM te kunnen realiseren. Het is niet realistisch om SAM tot een succes te maken door bijvoorbeeld één contractmanager SAM ‘er even bij’ te laten doen. Grote financiële instellingen met aanwezigheid in meerdere landen, maar ook multinationals, hebben meer dan tien fte’s toegewezen aan de SAM-functie.

5. Bewustzijn

Deze kritieke succesfactor betreft het op structurele wijze borgen dat het management en andere betrokken partijen zich bewust zijn van het belang van SAM binnen de organisatie. Fouten zijn menselijk en vinden voornamelijk plaats tijdens de operationele fasen van het SAM-proces. Om deze te minimaliseren dienen betrokken partijen zich bewust te zijn van de waaromvraag achter de toegewezen taken en verantwoordelijkheden. Dit kan bijvoorbeeld door inzicht te verschaffen in licentiekosten, trainingen en procedurebeschrijvingen.

6. Hiërarchie

Het management is in staat en bereidwillig om beslissingen af te dwingen als dit noodzakelijk is voor het realiseren van de doelstellingen van SAM. Een organisatie kan uit veel verschillende silo’s bestaan met eigen doelstellingen en belangen. Soms kan support vanuit het management noodzakelijk zijn om beslissingen te nemen in het belang van SAM.

7. Managementondersteuning

Het management legt mandaten neer in de organisatie en ondersteunt de gemandateerde(n) op structurele basis. Vaak ontstaat sponsorship pas na het ervaren van negatieve financiële gevolgen uit een software-audit.

8. Rapportages

Stakeholders worden op de hoogte gehouden om het bewustzijn van SAM te vergroten en support te behouden. Denk hier niet alleen direct aan licentievraagstukken, maar bijvoorbeeld ook aan IT-beheerders die inzage krijgen of de IT-middelen onder hun verantwoordelijkheid zijn uitgerust met de nieuwste antivirussoftware. Zoals reeds aangehaald kan verouderde (antivirus)software tot beveiligingsissues leiden.

9. SAM-databases

Er zijn binnen de organisatie registraties aanwezig van het gebruik van software, aanwezige hardware en beschikbare licenties. Bij deze verschillende informatiebronnen ligt de focus op juistheid van de informatie en het realiseren van een zo volledig mogelijke dekking binnen de organisatie.

10. Closed loop

Dit betreft de traceerbaarheid van software gedurende de aanwezigheid in de organisatie zodat er nooit hardware aanwezig kan zijn met software waar niemand binnen de organisatie het bestaan van weet.

In figuur 4 hebben wij de tien kritieke succesfactoren gekoppeld aan de verschillende fasen van de software lifecycle. Hier wordt direct zichtbaar dat in iedere fase nagenoeg elke kritieke succesfactor van belang is.

C-2016-2-Huijsman-04

Figuur 4. De tien kritieke succesfactoren gekoppeld aan de software lifecycle.

Samenvatting

Organisaties hebben vaak grote moeite om aantoonbaar compliant te zijn als het gaat om het beheer en gebruik van softwarelicenties. In de vakliteratuur zijn diverse methodieken en frameworks beschikbaar om SAM te implementeren. Aan de hand van een analyse van beschikbare frameworks en interviews met experts kunnen we concluderen dat de beschikbare frameworks alle handvatten bieden voor SAM, maar dat het hanteren van één enkele methodologie waarschijnlijk onvoldoende is om SAM succesvol te kunnen implementeren. Bovendien benadrukten de SAM-experts dat in zowel ITIL als ISO/IEC19770-1 te weinig aandacht wordt besteed aan cultuuraspecten binnen organisaties. Naast duidelijke rollen, verantwoordelijkheden en processen zal er een omgeving moeten worden gecreëerd waarin bewustzijn over de relevantie van SAM bestaat. Denk hierbij bijvoorbeeld aan juiste en volledige informatievoorziening zoals SAM-rapportages, kostendoorbelastingen of anderszins inzicht in de kosten van licenties en softwaregebruik.

Daarnaast zijn op basis van ervaringen tien kritieke succesfactoren geïdentificeerd die binnen een organisatie aanwezig zouden moeten zijn om in control te kunnen komen op het gebied van SAM binnen de gehele software lifecycle.

Literatuur

Literatuur

[BSA15] BSA, The Software Alliance, Navigating in the Cloud: Why Software Asset Management Is More Important Than Ever, 2015, p. 8.

[Geff15] M. Geffner, Why your old computer poses security risks. Bankrate.com, 5 augustus 2015, http://www.bankrate.com/finance/mobile/old-computer-poses-security-risks.aspx

[Inve15] Investopedia, Sarbanes-Oxley Act Of 2002 – SOX, 2015, http://www.investopedia.com/terms/s/sarbanesoxleyact.asp

[ISO12] ISO/IEC, ISO/IEC 19770-1: 2012: Information technology – Software Asset Management – Part 1: Processes and tiered assessment of conformance, 2012.

[ITGI07] IT Governance Institute, CobiT 4.1: Framework, Control Objectives, Management Guidelines, Maturity Models, 2007.

[KPMG13a] KPMG, Cost Effective Alternatives to Software Asset Management, 2013.

[KPMG13b] KPMG, Is unlicensed software hurting your bottom line? Compliance trends and practices to increase revenue, 2013.

[Pres15] I. Preskett, I. (2015), Integrating ITIL and ISO 19770, 2015, IP Associates Limited, 2015. Geraadpleegd op 8 oktober 2015 op: http://www.ipassociatesltd.co.uk/whitepapers/integrating-itil-and-iso-19770

[Rudd09] Rudd, C., ITIL V3 Guide to Software Asset Management, The Stationary Office, 2009, p. 6.

[Wiki15] Wikipedia, Sarbanes-Oxley, 2015, https://nl.wikipedia.org/wiki/Sarbanes-Oxley

Heads or Tails: Market Surveillance and Market Abuse

In 2016, two sets of financial regulations will dominate Financial Investment Firms: the second versions of both the Market Abuse Directive and the Markets in Financial Instruments Directive. Both sets of directives and their related regulations will be in force by July 2016 and January 2017 respectively. Both sets are rule based and sizeable, the total number of pages published so far exceeds 10.000. Despite their differences, both collections share a common goal: to ensure the integrity of the financial markets and to ensure investor confidence in these same markets. They aim to accomplish this by setting clear requirements to tackle market abuse such as market transparency, (market) abuse risk indicators and transaction reporting obligations. A direct consequence of these requirements is that investment firms and regulated markets have to invest heavily in market surveillance processes and tools.

This article takes the reader on a journey in time, from the mid 1980s to the present day and addresses market abuse / market surveillance by discussing orange juice and cleanliness but also the content and the implications of EU legislation.

Introduction

Question: What do frozen orange juice and an airline have in common? Answer: Both subjects played a major part in films about market abuse in the 1980s. In the movie Trading Places Billy Ray Valentine (played by Eddie Murphy) and Louis Winthorpe II (played by Dan Aykroyd) are treated like pawns on a chess board by two wealthy brothers. The brothers are caught in their own web when they use a confidential report on crop forecasts of orange juice for insider dealing purposes. Inside knowledge about the end of an investigation into an accident involving a small airliner allowed Bud Fox (played by Charlie Sheen) to impress Gordon Gekko (played by Michael Douglas) in the film Wall Street. Trading Places had a happy ending, Wall Street finished less upbeat. However, in both movies the authorities did their work, the villains were caught, punished and justice prevailed.

Market Abuse, constituting of Insider Dealing and Market Manipulation, threatens the integrity of financial markets and impacts investor confidence in those markets ([EU14a], [EU14b]). Without market confidence, trading in financial instruments stops and history has shown us that this halt has dire consequences for the overall economy.

The above mentioned films are set against a historic background where markets themselves were opaque, where trading took place on either the physical floor of exchanges or via phones and where immediate access to information was limited to a select few. Thirty years on, the world has changed dramatically. Information is omnipresent, trading venues can be accessed electronically by both professional and retail participants, national exchange monopolies within Europe have been shattered and have resulted in a large number of competing execution venues. Clearly, the stories depicted in these 1980 films are no longer a reflection of today’s capital markets or are they? Is Gordon Gekko’s motto “Greed is good” still the prevailing slogan, do we need to accept Market Abuse as an undesirable but inevitable component of the securities markets?

This article looks at the current status of market abuse, looks at upcoming legislation to address it directly and presents an overview of the market surveillance requirements and other organizational, process, data and system requirements to prevent, detect and report market abuse related incidents.

C-2015-4-Voster-01

Figure 1. Example of a modern market surveillance system.

Market Abuse in the Twenty-First Century

Numerous high visibility market abuse incidents have been detected and reported since the beginning of the new millennium. A number of individual institutions have been significantly damaged due to the illegal behavior of single rogue traders. There was Société Générale that lost almost €5 billion in 2008 ([Walc08]) and UBS that lost approximately €2 billion in 2011 ([Farr15]). However, it is the manipulation of Financial Market Benchmarks that came to light as a result of the London Interbank Offered Rate (LIBOR) scandal, that left a permanent scar on the integrity of capital markets. Signs had been on the wall since 2007. However, in 2013 things came to a head for benchmarks when financial institutions admitted their involvement in collusion to deceive other participants in the market ([BBC13]). UK and US authorities reacted by showing their muscle and imposing enormous fines on the financial institutions involved and taking individuals to court. Furthermore, guiding principles and legislation on both sides of the ocean were introduced to regulate major benchmarks such as LIBOR, the London Gold Fixing and the ICE Brent index (crude oil) ([HMTr14]).

Has the current market recovered? Has the firm hand of the law resulted in a correction of behavior? The next sections look at the current status by analyzing the annual reports of the supervisors of three countries: the United Kingdom, Germany and the Netherlands.

The Financial Conduct Authority (FCA), the regulator of the UK, appears to have detected optimistic signs regarding market abuse / insider dealing in its 2014/2015 annual report. Since 2008, the FCA calculates and publishes so-called “market cleanliness” statistics in its annual report. These statistics are an indicator of insider trading in the UK equity markets (see Figure 2). The metric is measured on the basis of abnormal price movements observed before takeover announcements of publicly traded companies, relative to the sum of all takeovers in a given period ([FCA14]). The 2014/2015 edition of the annual report states that “the observed significant decline in the incidence of potential insider trading suggests that insider trading has become rarer”. This is positive news and suggests that the measures taken have an impact on behavior and practices.

However, the same FCA annual report includes statistics about the number and type of suspicious transactions that have been reported during the 2014/2015 period. Suspicious transactions refer to transactions that could possibly indicate either “misuse of information/insider dealing” or “market manipulation”. Unfortunately, the total number of suspicious transaction reports (STR) has increased steadily for at least the last 3 years, up from just above a 1000 STRs in 2012 to over 1600 STRs in 2014 (see Figure 2). The majority of these reports were about inside information/dealing. This difference in trends between the “market cleanliness” indicator and the number of STRs related to misuse of information/insider dealing provides an insight into the challenge of drawing conclusions from single market surveillance figures. The FCA, rightly so, points out its focus on both the model validation and data quality in order to rule out any incorrect results ([FCA14b]).

C-2015-4-Voster-02

Figure 2. FCA Market Cleanliness / STR statistics.

In Germany, BaFin, the German Federal Financial Supervisory Authority, published similar pessimistic results regarding market abuse in its 2014 Annual Report ([BaFi14]). Where the FCA emphasized inside information and insider dealing in its report, BaFin detailed market manipulation. In 2013 the BaFin reported a reversal in a trend of increased cases of market manipulation. However, the 2014 figures for market manipulation were on the increase again (2013 – 218 investigations, 2014 – 224 investigations) (see Figure 3). The majority of these cases were due to market surveillance activities at German exchanges (130/214). BaFin also emphasized the assistance it requested from non-German supervisory authorities. In total, BaFin found evidence of 162 cases of market manipulation in 2014. In summary, as yet market abuse has not been eradicated in Germany.

C-2015-4-Voster-t1

Figure 3. BaFin market manipulation investigations.

The Netherlands Authority for the Financial Markets (AFM) responsible for supervision in Holland also pays attention to market abuse in its 2013 annual report (published April 2015) ([AFM13]). Unlike the FCA and the BaFin annual reports the information shared in the AFM annual report is less quantitative and has a qualitative nature. For example, the report neither refers to an indicator of market cleanliness nor does it include specific numbers for the Suspicious Transaction Reports (STR) received. The 2013 annual report does mention that the number of STRs received has remained stable compared to the previous year (2012) and that 14 investigations of potential market abuse were conducted resulting in just one fine for market manipulation. These figures do look like good news when you compare them to BaFin figures for the same period relative to the size of the market. However, it must be noted that in its 2012 annual report the AFM observed that the number of STRs it received was well below the STRs received by other supervisors and that in addition the AFM was not satisfied with the quality of the individual STR reports. Taking these comments into account, the information from the AFM may seem to be a misrepresentation of the market abuse situation. Actual market abuse may be far worse.

Overall, one may conclude that market abuse has remained an issue for the capital markets industry in 2015. Current market surveillance indicators by authorities such as the FCA’s “market cleanliness” indicator give some hope and some roles within the capital markets domain, such as the securities exchanges, are providing important assistance to national supervisors. However, the reporting of suspicious transactions (STR) and the fines imposed has not yet resulted in a significant decline in market abuse cases.

What else can the legislator do to ensure the integrity of the market and improve market confidence. Overall analysis of how supervisors report their (market abuse) results and conclusions in their annual reports calls out for more reporting harmonization by the supervisors themselves. What about the role of other market participants? Should investment firms, banks, brokers and market makers correct market abuse without support of the authorities? The following section addresses what current and future regulation the legislator has defined in Europe to address Market Abuse.

Market Abuse Regulation

The current European regulation for market abuse, Directive (2003/6/EC) on insider dealing and market manipulation (MAD), was initially proposed in 2001 and represented in the words of the Internal Market commissioner Frits Bolkestein “a fundamental pillar of building an integrated European capital market” ([EC01]). The commission adopted the Directive in January 2003 and the directive was transposed in national legislation by member states in the following years. The overall objective of the directive is to enhance market integrity by establishing common European rules and harmonize the great variety of rules at member states level.

MAD describes market abuse in only 10 pages by defining the two main categories of market abuse: insider dealing and market manipulation. Insider dealing had been addressed in a previous 1989 directive; as such market manipulation was the new kid on the block. MAD explicitly prohibits any person from engaging in disclosing inside information, from inducing another person to acquire or dispose of financial instruments to which this information relates and prohibits a person from engaging in market manipulation. In addition, the directive requires market participants to draw up lists of insiders, to ensure the notifications of manager’s transactions. Last but not least, it was the MAD that introduced/harmonized the legislation regarding the reporting of suspicious transactions (STR). The STR, the definition of the powers of the competent authorities/supervisors and the emphasize on cooperation between supervisors should have reduced market abuse significantly since MAD was adopted in 2003.

C-2015-4-Voster-04

Figure 4. EU Timeline Market Abuse related legislation.

The topic of market abuse was also addressed by a more comprehensive capital markets framework, Directive (2004/39/EC) Markets in Financial Instruments (MIFID). MiFID replaced the 1993 Investment Services Directive (ISD) and came into force in 2007. The overall objective of MiFID is to improve the competiveness of EU financial markets by creating a single market for investment services and activities and ensuring harmonized protection for investors in financial instruments. As such, MiFID covers numerous issues. It abolishes the exchange concentration rule, establishes conditions for a European passport for investment services, defines common investor protection rules but also specifies market abuse specific requirements such as: (a) pre and post-trade transparency for equities by requiring investment firms to publish their quotes/orders and resulting trades to the public, (b) the requirement by trading venues to monitor transactions to identify among others conduct that may involve market abuse and (c) the reporting of all transactions in financial instruments to competent authorities/supervisors. All in all, MAD and MiFID together seemed like a comprehensive framework to tackle market abuse. So what was missing.

MAD is a concise, principle based directive, introduced before MiFID. However, the financial crisis in 2007 and a subsequent MAD review in 2009 and hearing in 2010 identified and addressed major shortcomings in MAD such as: (a) incomplete coverage of the (OTC) derivative markets, (b) no clear definitions to identify and separate speculation from market manipulation and (c) insufficient powers by the supervisors. Furthermore, MAD was neither aware of changes introduced by MiFID, e.g. the Multilateral Trading Facility (MTF) nor were financial benchmarks included in the explicit scope of the Market Abuse Directive. All in all, MAD required an update.

The MAD revision resulted in the Directive 2014/57/EU on criminal sanctions for market abuse (CSMAD) and the Regulation (EU) No 596/2014 on market abuse (MAR). CSMAD and MAR will be in force by July 2016. CSMAD allows authorities to impose fines as high as EUR 5 mil for individuals or 15 % of turnover for legal entities. Unfortunately, not all EU countries (e.g. UK) are bound by these criminal law measures. The Market Abuse Regulation (MAR) increases the financial instruments in scope by including spot commodity contracts, emission allowances and related auctioned products. Furthermore, MAR includes financial benchmarks, provides a clear definition of insider dealing and explicitly requires any persons professionally arranging or executing transactions to establish and implement policies and procedures to detect and report both suspicious orders as well as transactions. As such, it enhances the suspicious transaction reports. These reports are now called Suspicious Transaction and Order Reports (STOR). To assist those entities that fall inside the MAR scope, the regulation defines a non-exhaustive list of risk indicators of manipulative behavior and links the indicators to false and misleading signals and price securing (see Figure 5).

C-2015-4-Voster-t2

Figure 5. Market manipulation indicators/practices.

The inclusion of risk indicators in the regulation is a clear sign that the legislator demands execution venues, market participants and members to take increased responsibility to prevent, detect and report market abuse practices. For example, the set of risk indicators (see Figure 5) includes one called “significant volume”. An exchange is required to monitor for a significant volume by its participants/members relative to the volume of other market participants. If a certain threshold is broken, the exchange must investigate the behavior of those participants involved, identify if breaking the limit is linked to one or more of the four practices such as “colluding” or “the creation of a floor in the price pattern” and report the behavior in the form of a STOR to the supervisor.

Concise definitions of Market Abuse, Inside Information, Insider Dealing, Market Manipulation (source: the Regulation (EU) No 596/2014 on market abuse)

Market abuse is a concept that encompasses unlawful behavior in the financial markets and, for the purposes of this Regulation, it should be understood to consist of insider dealing, unlawful disclosure of inside information and market manipulation.

Inside Information is information of a precise nature, which has not been made public, relating, directly or indirectly, to one or more issuers or to one or more financial instruments, and which, if it were made public, would be likely to have a significant effect on the prices of those financial instruments or on the price of related derivative financial instruments

Insider Dealing arises where a person possesses inside information and uses that information by acquiring or disposing of, for its own account or for the account of a third party, directly or indirectly, financial instruments to which that information relates (incl. cancelling/modifying existing orders).

Market Manipulation shall comprise the following activities: (a) entering into a transaction, placing an order to trade or any other behavior which: (i) gives, or is likely to give, false or misleading signals as to the supply of, demand for or price of a financial instrument (ii) secures, or is likely to secure, the price of one or several financial instruments at an abnormal or artificial level; (b) entering into a transaction, placing an order to trade or any other activity or behavior which affects or is likely to affect the price of one or several financial instruments which employs a fictitious device or any other form of deception or contrivance; (c) disseminating information through the media … which gives, or is likely to give, false or misleading signals as to the supply of, demand for or price of a financial instrument, or is likely to secure the price of one or several financial instruments at an abnormal or artificial level…; (d) transmitting false or misleading information or providing false or misleading inputs in relation to a benchmark where the person who made the transmission or provided the input knew or ought to have known that it was false or misleading, or any other behavior which manipulates the calculation of a benchmark.

(NB For the purpose of brevity the above definitions differ in some respects from the legal definition in the MAR. For example, information related to commodity derivatives and to emission allowances or auctioned products is excluded.)

The original MiFID of 2007 is also being replaced by the Directive 2014/65/EU on markets in financial instruments (MiFID II) and Regulation (EU) No 600/2014 on markets in financial instruments (MiFIR). MiFID II and MiFIR are to be in force by January 2017. Both MiFID II and MiFIR enhance the scope of Market Abuse significantly.

MiFID II extends existing MiFID record keeping requirements for the purpose of market abuse by requiring an investment firm to arrange for records to be kept of all services, activities and transactions undertaken such that the supervisor can fulfill its market abuse supervisory tasks and in particular to ascertain that the investment firm has complied with all obligations including those with respect to the integrity of the market. These additional record keeping requirements include the recording of telephone transactions and other electronic communication concluded related to (a) dealing on own account or (b) services linked to the reception, transmission and execution of client orders. MiFID II extends market abuse by defining requirements for position limits and position management controls in commodity derivatives as well.

Furthermore, MiFIR enhances the reporting of transactions. MiFIR states explicitly that the objective of sharing transactions with the supervisor is to allow the supervisor to enable them:

  • to detect and investigate potential cases of market abuse;
  • to monitor the fair and orderly functioning of markets;
  • to monitor the activities of investment firms.

For the purpose of Transaction Reporting, MiFIR:

  • provides a revised definition of a transaction;
  • enhances the scope of financial instruments;
  • expands the transaction report from 23 to 64 fields including additional fields for increase of in-scope products and more granular data.

The enhanced set of data fields for transaction reporting purposes include additional requirements to capture and report information regarding a “natural person” such as the buyer and seller identification, the decision makers for each trade and the trader identification for both the investment and the execution. In addition, the regulation requires the compulsory use of Legal Entity Identifier (LEI) codes for identification (except when the counterparty/client is an individual).

Both MiFID II as well as MiFIR are supplemented by an implementing directive and regulation and related regulatory technical standards (RTS) and implementing technical standards (ITS). The overall volume of the documentation constituting MiFID II/MiFIR exceeds 5000 pages.

Market Surveillance, the Right Response

The introduction of additional legislation to tackle market abuse and the explicit requirements to make investment firms and trading venues responsible to prevent, monitor, detect and report market abuse, such as insider dealing or market manipulation, have a significant impact on the organizational model of these firms (see Figure 6).

C-2015-4-Voster-06

Figure 6. Operating model implications due to market abuse requirements.

Of those required changes to the operating model, the requirements to implement a market surveillance system to monitor and investigate potentially suspicious orders/trades are technically the most challenging as they impact both data, process and systems such as:

  • Data: Investment firms must arrange for records to be kept of all services, activities and transactions that it undertakes such that the supervisor can investigate suspicious behavior. This effects transactional data, reference data and meta data.
  • Process/System Requirements aimed at:
    • preventing and detecting insider dealing, market manipulation and attempted insider dealing and market manipulation must be established;
    • reporting to the competent authority without delay a reasonable suspicion that clients or staff members are involved in insider dealing, market manipulation or attempted insider dealing or market manipulation, must be reported to the competent authority without delay.
    • providing full assistance to the supervisor in investigating and prosecuting market abuse occurring on or through its systems.

The market surveillance process itself can be divided up into several steps (see Figure 7).

C-2015-4-Voster-07

Figure 7. Market surveillance workflow steps.

The generic workflow consists of 6 steps:

  • Data capture – The “Data capture” step extracts data from multiple sources, normalizes the data for analysis purposes and loads the data in a repository. Typical examples of data are market data, such as the best bid offer (BBO) and the volume at different levels in the limit order book, reference data such as ISINs and the availability of news. Internal data is also required. For example, client identification, order flow per customer, transactions per client and client positions;
  • Data analysis – The “Data analysis” step uses the data captured in the previous step and detects suspicious practices based on risk indicators such as “significant volume” (see Figure 5);
  • Alert management – The “Alert management” step manages and prioritizes subsequent alerts that signal suspicious practices, again based on parameters;
  • Abuse case notification – The “Abuse case notification” assigns the alerts to specific, predefined roles and send the roles a notification. This may include sending a suspicious transaction order report (STOR) to the supervisor;
  • Abuse case management – The “case management” steps allows those responsible to analyze the suspicious orders/transactions in order to determine if the case was a false or true positive. When the case is analyzed to be positive, the case will be escalated.
  • Enforcement – The “enforcement” step is initiated when a suspicious case has been confirmed.

C-2015-4-Voster-08

Figure 8. Market surveillance system.

Market surveillance is frequently automated (see Figure 8). The basic functionality of such a system includes the ability to capture an investment firm’s trading data (order and transactions) against the direct market data, features to capture historic and real-time data from markets and to support analysis at different levels: e.g. client level, firm level, account level, trader level, insider level using a rules engine. The advantage of an automated system is the support for a complete audit trail.

Enhanced market surveillance system functionality may include (a) support for MAD II / MAR indicators and practices, (b) support to capture and analyze investment advice, research, statistics, news, (c) capture and analyze transaction report(s) and (d) integration with Governance Risk Compliance (GRC) systems or direct support for case management. Also essential is the means to handle multi-trading venue, multi-region and cross-asset class analysis. In addition, visualization of the alerts or the status of the suspicious trade reports is a must.

Note that the selection, acquisition, configuration and implementation of a market surveillance system is just one of many implications when tackling market abuse (see Figure 6). To properly approach market abuse a firm needs to start by setting the right tone at the top, translate the tone to clear, transparent policies that leave no room for interpretation, establish the right culture and continue from there on to address the required changes to procedures, systems and data.

Conclusion

“It occurs to me that the best way you hurt rich people is by turning them into poor people,” said Billy Ray Valentine (Eddie Murphy) to Louis Winthorpe II (Dan Aykroyd) in the movie Trading Places. Unfortunately, Market Abuse hurts everything and everybody: market integrity, market confidence, the economy and thus all people, rich and poor. Therefore, market abuse remains one of the main challenges of today’s securities markets, a battle that must be won.

Market surveillance is one of the tools that legislation has given market supervisors and participants alike in order to monitor, prevent, detect, report and eradicate market abuse practices. The manipulation of financial benchmarks such as LIBOR has shown the market and the world that it is not just individuals (rogue traders) that fall for the illegal quick wins but that networks of professionals do as well. The implementation of successful market surveillance is dependent on many factors. However, a rule based legislation that (a) defines detailed risk indicators, (b) requires the handling of large volumes of different data elements and (c) defines the identification of patterns in large sets of data points must be automated and digital. Only in this way is real time, accurate and precise information assured and can market abuse be fought. To finish with the words of Gordon Gekko (Michael Douglas) in Wall Street: “The most valuable commodity I know of is information.”

References

[AFM13] AFM, Jaarverslag 2013 (Annual Report 2013).

[BaFi14] BaFin, 2014 Annual Report, Federal Financial Supervisory Authority, 2014.

[BBC13] BBC News, Timeline: Libor-fixing scandal, 6 February 2013, http://www.bbc.com/news/business-18671255.

[EC01] EC press release, 30 May 2001.

[EU14a] Directive 2014/57/EU on criminal sanctions for market abuse (CSMASD), 16 April 2014.

[EU14b] Regulation (EU) No 596/2014 on market abuse (MAR), 16 April 2014.

[Farr15] S. Farrell, Rogue trader behind Britain’s biggest fraud released early from prison, The Guardian, 24 June 2015.

[FCA14a] Financial Conduct Authority, Annual Report and Accounts 2014/15.

[FCA14b] Financial Conduct Authority, Why has the FCAs market cleanliness statistic for takeover announcements decreased since 2009? Occasional Paper No.4, 2014.

[HMTr14] HM Treasury, Chancellor confirms government will extend legislation put in place to regulate LIBOR to cover seven further financial benchmarks, 22 December 2014.

[Walc08] F. Walch and D. Gow, Société Générale uncovers £3.7bn fraud by rogue trader, The Guardian, 24 January 2008.

Capital Markets: Responsibilities, Challenges and Solutions

Interview: Rob Voster

Albert Menkveld, Professor of Finance at VU Amsterdam, is an international authority on capital markets. Compact has interviewed him to find out more about the capital markets’ current and future opportunities, dangers and possible solutions.

In the early seventeenth century the Amsterdam Bourse enabled the Dutch East India Company to send out its ships for long and treacherous journeys bringing wealth and prosperity to a young, Dutch republic. But gone are the days when a Dutch exchange dominated securities trading in western Europe. Today’s exchanges remain important providers of capital for new businesses. The order books are now filled electronically, the timespan to fill them has been reduced to sub microseconds and the exchanges themselves are interlinked by a vast array of financial instruments.

Historic dangers of navigating the seas to trade and search for fortune have been reduced by access to accurate time devices, compasses, maps, the establishment of international laws and their enforcement by authorities. Capital markets have seen their fair share of storms and abuse as well, especially in the new twenty-first century. What is the key to the continued success of capital markets and to what dangers are its participants exposed?

Albert Menkveld, Professor of Finance at VU Amsterdam, is an international authority in this field. Compact has interviewed him to find out more about the capital markets’ current and future opportunities, dangers and possible solutions.

Mr. Menkveld what was the most significant capital markets’ event in the last five years and why?

In my opinion it is the sovereign debt crisis. This crisis was huge and it is still not completely resolved. Banks were allowed to fill their books with Greek debt which regulators and rating agencies perceived to be safe. However, this opinion was not reflected by the markets. It is an example of a wedge between regulation and markets. The yield was excellent, capital requirements low, the official rating good (AAA) but the real risk high. An explosion that was waiting to happen and did happen. The solution to offload the debt to the ECB may have been good from a national regulators’ perspective or for individual EU member states but not for the EU itself and therefore we are all worse off because of this individual optimal behavior.

Is the current division of responsibilities, “prudential” control by the ECB and “market abuse” control by national competent authorities, the right approach?

Prudential controls, such as solvency and liquidity controls, are ex-ante measures to prevent trouble in the future, if we have enough money in our pockets we can buffer a shock. There is a clear role for the ECB to control these quantitative indicators in collaboration with the national central banks. In a way the collaborative structure between the ECB and the central banks can be seen as a single entity.

Market abuse is something entirely different. Securities markets have a set of rules by which you are allowed to trade on these markets. If you do not obey these rules, if your aim is to manipulate prices, initiating a trade or signaling interest in a trade in some direction for no other reason than to mislead the market, then this is illegal behavior, which somebody needs to monitor. The flash crash and the financial trader accused of contributing to this event are examples of what can go wrong.

The LIBOR and other benchmark manipulations show that market abuse is not just the illegal behavior by individuals but has become more organized and is carried out by communities of people. What could be the cause of this trend and what can be done about it?

My suspicion is that whenever you put a set of humans in the middle of an opaque market, there will be some who will try to get rich quickly in any way they can, including collusion. This seems to be true for any industry, not just securities markets. Collusion is illegal and we must avoid it.

Transparency is forever a struggle between regulators and the industry at large. Intransparency is in the interest of the sector and there are costs to transparency. However, the benefits of transparency are huge. In particular, because transparency allows the end-users, the clients, to check if they did get a reasonable execution or if the benchmark they received was truly a benchmark.

The markets can solve market abuse issues themselves if they let a little bit of light in. Micro-management by the regulator, drawing up larger and larger regulations does not work. This type of regulation costs enormous amounts of money to develop, to communicate and implement . Furthermore, many will look for holes in regulations and it becomes a vicious circle with little real value being produced.

A consolidated trade tape is a good transparency example of what should be but is still not available in Europe. A consolidated trade tape distributes in real time what has been traded in a particular financial instrument, the quantity, the price and the time of trade. This information allows the end-user to judge if his broker-dealer has done a good job. Currently, regulators are discussing a reasonable price to distribute this trade tape information. I would be happy to let the government spend my tax money to allow an independent organisation to distribute a trade tape that allows all end-users to validate the quality of the execution received.

Are there, in addition to transparency, other necessary conditions for well-functioning securities markets?

Another necessary condition is competition in the intermediation sector. There needs to be a number of broker-dealers and competitive pressure to provide and improve the services offered. The same is true for exchanges and I am happy to see that there are multiple exchanges that allow its participants to trade the same securities.

A third element is the ability to monitor the net exposures of all systemically important financial institutions (SIFIs). They don’t need to publicize their position, it is sufficient if the SIFIs report their position to their regulator. This is necessary because a scenario whereby all SIFIs load up on the same bet is potentially very dangerous as the concentration exposure becomes unhealthily large. I call this type of exposure the “crowded trade risk”. It happened for example in US mortgages before and during the financial crisis in 2007. If one can identify this concentration exposure early on, one can start charging for putting an extra euro in that position because of the systematic risk it poses.

The identification of the “crowded trade risk” and the methodology I developed to charge more for putting an extra euro on this bet (the Margin A methodology), arose after I talked to EMCF, a large Dutch clearing house, about all its significant risks in its role of central counterparty (CCP). I also developed a new overall risk indicator for CCPs called CrowdIx. Margin A and CrowdIx allow not only for the quantification of the size of the “crowded trade risk” but also for the identification of those clearing members that contribute most to the risk. As such, low frequency margin adjustments, once every quarter, can be made for these identified clearing members and reflect their contribution to systemic risk without adding fuel to the identified risk itself.

Based on a one year dataset and using the CrowdIx indicator I have identified two time points where excessive “crowded trade risk” occurred. The first event happened when the EU created the European Stability Fund, right after the first bail-out of Greece. The second occurrence could not be identified by macro news but was due to a first quarter announcement by Nokia which was 10 % below expectations. At that time, there was so much money in the Nokia position, that any additional issue at Nokia would have put over half of the clearing community at serious risk, essentially a systemic risk. It shows the power of the CrowdIx indicator.

Are there any measures that can prevent market abuse completely? Have current market abuse initiatives such as the transaction reporting duty been successful?

Stopping trading altogether will prevent market abuse. People have to realize that there is a balance. It is costly to have absolute safety. As an economist, if I want my Dutch institutions to be absolutely safe, I should demand an absurd amount of collateral, but that means that we need to save even more for our pensions as they can only initiate small, low-risk bets, earning almost nothing. So there is a balance.

The “Margin A” methodology doesn’t prevent financial institutions entering into high-risk bets, but allows them to reconsider the risk and, when they decide to go ahead, to pay for it. The risk taker pays, more so for systemically risky bets.

Regarding transaction reporting. It is still early days, regulators are compiling and cleaning up the data so as to assure the quality of the reports. From my own experience I know how much effort goes into this, such that the conclusions are not garbage in, garbage out. There is an active dialog between academia and regulators to address issues such as these. Academia is a profession of collaboration; we let ourselves be inspired by the each other’s thinking and that of the regulators. And, vice versa, regulators are inspired by our feedback. Throughout the year conferences organized by numerous organizations such as BIS and ECB take place, where academia and regulators meet.

During the last couple of years so-called High Frequency Trading and Algorithmic Trading has been in the news. Is it possible to regulate these forms of trading and ensure they do not abuse the market?

I am not in favor of regulators actively validating algorithmic trading strategies. Exchanges do and must play a major role in controlling their own markets. Currently, when an exchange sees that a single point of entry generates an enormous volume of messages, there is an automatic, temporary pause. If the volume continues, the algorithmic trader is disconnected. This is not controversial; exchanges are happy with algorithms, but intervene if extraordinary message traffic is clearly due to a rogue algorithm, and thus protect all the market participants, including the one with the out-of-control algorithm. This is an existing measure. Since there is an economic incentive for the participants to stop bad algorithms, I do not worry and do not think that we need regulatory efforts in this area. We do need regulatory effort to identify the systemic risk associated with the culmination of trading strategies. The regulators should put regulation in place to tackle this type of risk. Overall, I am happy with electronic trading. Computers are cheaper than humans and have led to far lower fees and commissions.

My own research in this area focuses more on the question “do electronic exchanges need more speed or is there an optimal speed threshold for exchanges”. My model recognizes three types of exchange participants: (1) the High Frequency Marketmaker (HFM), providing bid/ask quotes, (2) the High Frequency Bandit (HFB), “hitting” the quotes based on current news and (3) the Liquidity Trader (LT), the regular traders. Intuition tells us that above a certain speed threshold regular traders can’t keep up anymore and trading becomes a duel between the High Frequency participants only. If an exchange is not responsive to all participants, keeps speeding up its matching engine and as a result the bid/ask spread might widen, it will chase away the natural flow. This is not to the benefit of any of the participants. In our research, Marius Zoican and I do not advocate radical change by exchanges but calls for exchanges to recognize that there is a negative effect to metaphorically speaking “changing the processor to an absurdly fast one”.

What is the future of centralized securities exchanges taking new developments such as the distributed ledger / block chain technology into account that allows for decentralized trading and clearing and what is the impact on surveillance / regulation.

If you take a step back, what we have seen is a migration in the other direction. Decentralized trading was very common for many centuries, people traded everywhere in all kinds of products and services. The benefit of technology is that centralization is now much cheaper. An example is eBay, a centralization point where we indicate our interest to buy or sell for everybody else to see. In economics we call this a network externality. Such a network not only benefits ourselves but everybody who is already on the network.

There is still decentralization due to multiple exchanges and multiple central counterparties. Overall, this type of competition is good and is one of my overarching principles for a well-functioning market. However, I am worried if we have a very large number of markets, e.g. the number of equity markets in the US. The US regulators have headaches when compiling the data and have started a new initiative (rule 613 overhaul) where at the level of exchanges every member of the exchange needs to have a single identifier such that data can be consolidated.

My main worry is a scenario where a regulator cannot overview all transactions, make sure existing rules are adhered to or recognize new risks. If we don’t trust the market place we will all put our money in our socks and not expose it to the right risks, in particular new business ventures. The reality is that we operate on multiple exchanges and across different countries. However, we still have national regulators, a situation I am not comfortable with. Consolidation (of regulators) does take place but is very slow and as usual the markets are ahead of the regulators.

Albert Menkveld is Professor of Finance at VU Amsterdam and Fellow at the Tinbergen Institute. In 2002, he received a Tinbergen PhD from Erasmus University Rotterdam. He was on visiting positions at various U.S. schools: Wharton in 2000, Stanford in 2001 and NYU in 2004-2005 and in 2008-2011.

Albert’s research agenda is focused on securities trading, liquidity, asset pricing and financial econometrics. He has published in various journals, for example, the Journal of Finance, the Journal of Financial Economics and the Journal of Business and Economic Statistics.

www.albertjmenkveld.org

Forensic Logging Requirements

Based on experience we know that fraud investigations in the financial industry are often hampered by the poor quality of logging by IT systems. Especially because fraudsters are using new techniques like APT’s (Advance Persistent Threats) and “anti-forensics” tooling. In general a forensic analysis of the logging should provide insight into who did what, where, when, how and with what result. In this article we share the bad as well as best practices we encountered with respect to logging and audit trails. Finally we propose a 6 steps approach on how to realize logging and audit trails that adequately facilitate forensic investigations. It will also help companies to strengthen their internal control environment and be better able to comply with the regulatory reporting requirements.

Introduction

The Association of Certified Fraud Examiners (ACFE) estimates that 14.3 percent of all internal fraud cases occur at financial institutions with an average loss of $258,000 per case ([Feig08]). Many of these frauds are committed via IT systems. For the investigation of these frauds it is important that the investigators can make use of the correct logging and audit trails. However in practice forensic investigators are often hampered by weak application logging and audit trails. Although implementation of an adequate logging solution sounds easy, it proves to be rather complex. Complicating factors are:

  • The complexity of IT. In general, a business process does not make use of just a single IT system. In practice several user applications are part of a process chain. And in addition many IT components and thus system software and hardware are involved. To mention a few: operating systems, databases, network components such as routers and firewalls, user access control systems etc. All of them (should) provide the right audit trail.
  • The sheer amount of data. The amount of data that is transferred and processed is still growing rapidly due to bigger data centers, faster processors, faster networks and new technologies like cloud platforms, Big Data ([Univ]) and Internet of Things ([Höll14]). On top of this, every IT device and application generates log files. However, there really are no standards for how these logs present their data. As a result, an investigator either has to learn what the log files are telling him or develop technologies to normalize these logs into some common and useable format.
  • Latest developments to wipe traces or circumvent logging and detection. Very old techniques used by hackers to frustrate forensic investigations are hard disk scrubbing and file wiping by overwriting areas of disk over and over again. Also the use of encryption (like Pretty Good Privacy) ([Geig06]) and physical destruction of hardware were commonly used. However, nowadays, specialized so called “anti-forensic tooling” is available to try to manipulate logging remotely. The number is steadily growing and the techniques are getting more and more sophisticated. An additional complication factor is the hacker technique of APT’s (Advanced Persistent Threats). In this way hackers spread their activities over a long period of time – a couple of months is not unusual – while making as little “noise” as possible. Aim of this technique is to stay under the radar screen and plan for a huge “hit and run” attack after the system is fully compromised.

In this article we will investigate to which logging requirements the IT systems in the financial industry must comply to produce an audit trail that is adequate to support forensic investigations.

Note: this article is based on a paper for the graduation assignment of the Executive Program “forensic accounting expert” at the Erasmus University of Rotterdam.

Definition of the Problem

Many organizations are confronted with illegitimate actions via IT systems, like data leakage or fraudulent money transfers. According to the ACFE (Association of Certified Fraud Examiners) organizations suffer an average of more than 52 incidents of insider fraud annually. In such cases it is important to have a sound audit trail. However, while many organizations maintain access logs most of these logs are insufficient due to the following 3 limitations ([Geig06]):

  • The logs are missing record and field-level data and focus solely on a given transaction. Most existing logs only contain information at the transaction level, such as: Which users accessed which transaction at what time? In these cases, critical information is still missing. Such as “Which specific records and fields did the user access?’ and “What did the user do with the data?”
  • Main existing systems fail to log read-only actions, leaving gaps in the records. Most existing logs only record update activities. This leaves critical information about what was viewed, queried or simply accessed out of the audit trail entirely. In these cases, there is often no record of the points in time that information was accessed without being changed. This information is extremely important for preventing and investigating information leakage and data theft. Another area where this absence of information reveals significant gaps is in demonstrating access to private or privileged information.
  • Logs represent an incomplete view of activities that is often “hidden” across multiple systems and difficult to correlate. Many logs are maintained in separate systems or applications that don’t “talk” to each other. This makes it difficult to find and correlate relevant information – or respond quickly to an audit request. This reality often aids the malicious insider in obscuring their activity.

Legacy systems that were developed a decade or two ago and even many newer systems were not designed for collecting detailed data access logs. Altering logging capabilities or introducing a logging mechanism to these applications frequently required the addition of a logging component to each online program. In a large enterprise, this can add up to tens of thousands of lines of code.

As a result most forensic investigations are hampered by the poor quality of the logging by IT systems. This is also evidenced by the input we received during our interviews with forensic investigators of three Dutch financial companies. Poor logging makes it very difficult for investigators to determine what actually happened and to trace transactions back to natural persons.

Next to a poor design of the logging, the quality of the log data can also be affected by the use of so-called “anti-forensic” ([Kedz]) tooling. Hackers make use of these tools when attempting to destroy any traces of their malicious actions.

Objective and Scope

The objective of this article is to investigate which logging requirements IT systems in the financial industry must comply with to produce and safeguard an audit trail that is adequate to support forensic investigations. This includes the legal requirements in the Netherlands.

The IT controls to prevent fraud are out of scope for this article.

Approach

For this article we have used the following approach:

  • Interviewing forensic staff of three Dutch financial institutions about the problems they encountered during special investigations with respect to the implemented logging and with respect to the company policies
  • Study of regulatory logging requirements for the financial industry in the Netherlands as prescribed in:
    • Wet Financieel Toezicht
    • Toetsingskader DNB 2014
  • Study of best practices and industry standards regarding logging specifics:
    • ISO 27001 Information security management systems (ISO = International Standardization Organization)
    • COBIT Assurance Guide 4.1 (COBIT=Control Objectives for Information and related Technology)
    • PCI Data Security Standard (PCI = Payment Card Industry)
    • ISF Standard of Good Practices (ISF = International Security Forum)
  • Analysis of logging
  • Drawing a conclusion

Regulations

Financial institutions in the Netherlands have to comply with the Financial Supervision Act (Wet op het Financieel Toezicht) and/or the Pension Act (Pensioenwet). Pursuant to these acts, the Dutch Central Bank (DNB) holds that financial institutions have to implement adequate procedures and measures to control IT risks. These risks relate to, among other things, the continuity of IT and the security of information. In this context, ‘adequate’ means proportionate: the measures and procedures should be in line with the nature of the financial institution and the complexity of its organizational structure. The procedures must be in conformity with generally accepted standards (good practices). Examples of such standards are Cobit ([ITGI07]) and ISO27000. These standards provide for measures which are, in principle, considered adequate by DNB. 

In order to test the security of information within financial institutions, DNB has developed an assessment framework consisting of a selection from Cobit. DNB developed this framework, which comprises 54 COBIT controls, in 2010. The framework was updated in 2014 and split into a “questionnaire” and a “points to consider” document.

The DNB assessment framework expects the financial companies to implement a logging and monitoring function to enable the early prevention and / or detection and subsequent timely reporting of unusual and/or abnormal activities that may need to be addressed. To this aim DNB refers to the following COBIT requirements ([DNB], “Points to Consider”):

  • Enquire whether and confirm that an inventory of all network devices, services and applications exists and that each component has been assigned a security risk rating.
  • Determine if security baselines exist for all IT utilized by the organization.
  • Determine if all organization-critical, higher-risk network assets are routinely monitored for security events.
  • Determine if the IT security management function has been integrated within the organization’s project management initiatives to ensure that security is considered in development, design and testing requirements, to minimize the risk of new or existing systems introducing security vulnerabilities

Some more detailed requirements are included regarding logging. But these requirements are not focused on applications (software) but more on the IT infrastructure level and in particular on components that are aimed at protecting against cybercrime ([Glen11]) (like firewalls ([Ches03])).

Company Policies

From a regulatory perspective it is not obliged to have a specific policy on logging. However the DNB Self-Assessment Framework ([DNB]) expects financial companies to develop a log retention policy. It is considered a best practice to include guidelines on logging in a Security Monitoring Policy. In addition it is advised to establish a Code of Conduct for internal staff and have them sign that they have read this code. The code should specify among others the actions that staff should refrain from like unethical behavior such as browsing non-business related data on the Internet. Staff should be made aware that violations will be logged and the log data can be used during special investigations.

From our interviews with the staff of 3 Dutch financial companies we learned that all companies have a Code of Conduct that is to be signed by the staff. In addition, logging requirements are addressed in internal policies but only at a very high level. In practice logging requirements are specified per application for most of the business critical applications and for internet facing applications. Data integrity protection requirements (like hashing to be able to detect unauthorized changes) are not specifically set for audit trails. In addition the policies do not prescribe that logging should be stored in a centralized location. In practice most logging for laptops and workstations is stored locally and this very much hampers the forensic investigations.

Best Practices and Industry Standards

For this article we have studied the following best practices and industry standards:

  • ISO 27001 Information security management systems (ISO = International Standardization Organization)
  • COBIT Assurance Guide 4.1 (COBIT=Control Objectives for Information and related Technology)
  • PCI Data Security Standard (PCI = Payment Card Industry )
  • ISF Standard of Good Practices (ISF = International Security Forum )

ISO and COBIT are well known industry standards as also evidenced by the fact that DNB is specifically referring to these standards (see previous paragraph). ISO 27001 Information security management system provides some basic input related to logging requirements in section A10.10 Monitoring. Although the standard specifies that audit logs should be produced and kept for an agreed period to assist in future investigations not many details are provided about such requirements.

Several sections in COBIT 4 address logging and audit trail related information and details. Compared to other examined standards, COBIT gives specific focus to audit trails with respect to IT management processes such as configuration management, change management and backup processes. In addition at a general level attention is paid to logging related to hardware and software components.

PCI ([PCI15]) is a standard for credit card transactions. In our view PCI contains a best practice for logging that is to be provided by individual applications because it specifies:

  • That the audit trails should link all access to system components to an individual user.
  • Which events should be logged related to system components.
  • Which details should be included in the event log.
  • Time synchronization requirements be able to compare log files from different systems and establish an exact sequence of events.
  • The need to secure audit trails so they cannot be altered.
  • The need to retain audit trails so that investigators have sufficient log history to better determine the length of time of a potential breach and the potential system(s) impacted.
  • Review requirements, since checking logs daily minimizes the amount of time and exposure of a potential breach.

However, the standard would further improve by explicitly requiring that:

  • the logging specifies which specific records and fields the user accessed and what the user did with the data. For example in the case of adjusting data, both the content before the change and after the change should be recorded.
  • the logging also includes information about read-only actions on highly confidential data.

Along with this, the ISF Standard ([ISF14]) of Good Practices provides a good addition to the PCI since it provides a more holistic view. ISF contains best practices about logging procedures as well as the kind of information systems for which security event logging should be performed. The ISF prescribes that security event logging should be performed on information systems that:

  1. are critical for the organization (e.g. financial databases, servers storing medical records or key network devices)
  2. have experienced a major information security incident
  3. are subject to legislative or regulatory mandates

In our view it would be best to subdivide “ad a)” in:

a1. are critical for the organization (e.g. financial databases or key network devices)

a2. contain privacy related data (e.g. medical records or other confidential customer and personal data)

Bad Practices

During the interviews with financial institutions the following bad practices / common mistakes were identified;

  1. Lack of time synchronization. It is crucial for forensic analysis in the event of a breach that the exact sequence of events can be established. Therefore time synchronization technology should be used to synchronize clocks on multiple systems. When clocks are not properly synchronized, it can be difficult, if not impossible, to compare log files from different systems and to establish the sequence of events. For a forensic investigator the accuracy and consistency of time across all systems and the time of each activity is critical in determining how the systems were compromised.
  2. Logging is not activated. For performance reasons the logging function is mostly deactivated by default. So unless the logging is specifically activated no events are logged. In case of Internet applications it has to be noted that both the web application and the web server logging are needed and have to be activated separately.
  3. Logging is only activated in production systems. For performance and cost cutting reasons logging is often not activated in development, test and acceptance environments. This enables hackers to attack these systems without being noticed. After successfully compromising one of these systems the hacker can launch an attack on the production system via the network. Or simply use retrieved userid/password combinations as they are often the same on production and non-production systems.
  4. Logging is activated but log data gets overwritten. Most of the time a maximum storage space capacity is defined for logging data. When this capacity is reached the system starts to write the next log data from the beginning of the file again. Thus the old log data is overwritten and gets lost if it has not been backed up in the meantime.
  5. Logging is activated but log data is over-detailed. Log data needs to be tuned. If no filtering is applied the log file is overloaded with irrelevant events. This hampers efficient analysis in case of forensic investigations.
  6. Application logging requirements are not defined. During development of applications the asset owner as well as the developers often overlook defining the log requirements.

Logging Requirements

A forensic analysis of the logging should provide insight into who did what, where, when, how and with what result. Therefore the logging should contain complete data and be kept for a sufficient period of time in a secured manner. After studying the logging requirements listed by the regulations and best practices used for this article (see appendices B to F), we have divided the logging requirements into 5 categories that are relevant from a forensic investigations point of view:

  1. Retention requirements
  2. Correlation requirements
  3. Content requirements
  4. Integrity requirements
  5. Review requirements

Ad a) Retention requirements

The logging should be kept for a sufficient period of time. With the latest attack techniques (like APT = advanced persistent threat) hackers stealthily break into systems. As a result organizations are often compromised for several months without detection. The logs must therefore be kept for a longer period of time than it takes an organization to detect an attack so they can accurately determine what occurred. We recommend retaining audit logs for at least one year, with a minimum of three months immediately available online.

Ad b) Correlation requirements

A forensic analysis of the logging of IT systems must result in a chronological sequence of events related to natural persons. It is therefore important that logged activities can be correlated to individual users as well as to activities logged on other systems. These activities include business transactions as well as actions to get read access to sensitive data. As a business process chain contains several applications, the logging needs to be arranged for every application where users can modify transaction data or view sensitive data.

Because different applications running on different platforms each log a part of a transaction process, it is required to have a proper time synchronization between all computers. This is to ensure that timestamps in logs are consistent. To facilitate correlations, logging is best provided in a standardized format (like the Common Event Expression – CEE standard[CEE™ is the Common Event Expression initiative being developed by a community representing the vendors, researchers and end users, and coordinated by MITRE. The primary goal of the effort is to standardize the representation and exchange of logs from electronic systems. See https://cee.mitre.org.]).

Ad c) Content requirements

The main requirement content wise is that the logging provides information for all relevant events on who did what, where, when, how and with what result. Both application as well as infrastructure logging should provide this insight.

The PCI standard gives a good reference for application logging, but the precise log content should be decided on basis of individual applications and follow a risk based approach. In many cases this will result in the requirement to also log read-only actions, something that is now often forgotten.

The DNB assessment framework provides a good reference for infrastructure logging, especially regarding network components that are aimed to protect against cybercrime (such as firewalls).

Ad d) Integrity requirements

An attacker will often attempt to edit the audit logs in order to hide his activity. In the event of a successful compromise the audit logs can be rendered useless as an investigation tool. Therefore logging should be protected to guarantee completeness, accuracy and integrity.

Ad e) Review requirements

Security-related event logs should be analyzed regularly to help identify anomalies. This analysis is best done using automated security information and event management (SIEM) tools or equivalent. The analysis should include:

  • processing of key security-related events (e.g. using techniques such as normalization, aggregation and correlation)
  • interpreting key security-related events (e.g. identification of unusual activity)
  • responding to key security-related events (e.g. passing the relevant event log details to an information security incident management team).

Analysis of Logging

Many breaches occur over days or months before being detected. Regularly checking logs minimizes the amount of time and exposure of potential breaches. If exceptions and anomalies identified during the log-review process are not investigated, the entity may be unaware of unauthorized and potentially malicious activities that are occurring within their own systems.

Therefore a daily review of security events is necessary to identify potential issues. This encompasses, for example, notifications or alerts that identify suspicious or anomalous activities. Especially in logs from critical system components and logs from systems that perform security functions, such as firewalls, Intrusion Detection Systems, Intrusion Prevention Systems, etc.

Logs for all other system components should also be periodically reviewed to identify indications of potential issues or attempts to gain access to sensitive systems via less-sensitive systems. The frequency of the reviews should be determined by an entity’s annual risk assessment.

Note that the determination of “security event” will vary for each organization and may include consideration for the type of technology, location and function of the device. Organizations may also wish to maintain a baseline of “normal” traffic to help identify anomalous behavior.

The log review process does not have to be manual. The use of log harvesting, parsing, and alerting tools can help facilitate the process by identifying log events that need to be reviewed. Many security event manager tools are available that can be used to analyze and correlate every event for the purpose of compliance and risk management. Such a tool sorts through millions of log records and correlates them to find the critical events. This can be used for a posteriori analysis such as forensic investigations. But also for real time analysis to produce dashboards, notifications and reports to a tempo prioritize security risks and compliance violations.

DNB recommends to deploy SIM/SEM (security incident management/security event management) or log analytic tools for log aggregation and consolidation from multiple machines and for log correlation and analysis. SIEM (Security Information and Event Management) is a term for software products and services combining both SIM and SEM.

SIEM software such as Splunk and Arcsight combine traditional security event monitoring with network intelligence, context correlation, anomaly detection, historical analysis tools and automated remediation. Both are a multi-level solution that can be used by network security analysts, system administrators and business users. But also by forensic investigators to effectively reconstruct many system and user activities on a computer system.

Conclusion and Recommendations

At first sight it seems relatively easy to arrange for adequate logging. However, going into more detail there is much more to it. Logging should provide information on who did what, where, when, how and with what result. Both application as well as infrastructure logging should provide this insight. The sheer amount of data, the complex IT systems, the large varieties in hardware, software and also logging formats themselves often hamper forensic investigations within financial institutions. It is therefore very difficult and time consuming to perform a forensic investigation on an IT system and populate a chronological sequence of events related to natural persons. Especially since in practice most logging does not contain all relevant data for forensic investigations.

The root cause for this is in our opinion twofold: lack of specific regulations and company policies and lack of priority for logging requirements during the development of new systems. In our view a best practice for achieving an adequate audit trail during system development would be:

  • Risk assessment. Perform a risk assessment as the first step of the development phase and make an inventory of the key operational risks (including the risk of fraud and data leakage).
  • Key controls. Define the key controls to mitigate the key risks to an acceptable level.
  • Event definition. Related to the key controls, define which events should be logged and which attributes (details) should be logged per event to prove that the controls are working effectively. Have the event definition and previous steps reviewed by staff of Internal Audit and/or Special Investigations.
  • Logging. Design the logging based on the defined events and attributes, taking into account the general logging requirements regarding retention, correlation, content, integrity and review (see “Logging Requirements”).
  • Implementation. Implement the system and perform a User Acceptance Test. This test should include testing the effectiveness of the key controls and the completeness of the logging.
  • Monitoring. Periodically monitor the logging to help identify suspicious or unauthorized activity. Because of the sheer amount of data this is best done with an automated tool (SIEM solution).

Such an approach would not only facilitate forensic investigations. It will also help companies to strengthen their internal control environment and be better able to comply with the regulatory reporting requirements.

References

[Ches03] W.R. Cheswick, S.M. Bellovin and A.D. Rubin, Firewalls and Internet Security: Repelling the Wily Hacker (2nd ed.), 2003.

[DNB] DNB Self Assessment Framework, http://www.toezicht.dnb.nl/binaries/50-230771.XLSX

[Feig08] N. Feig, Internal Fraud Still a Danger as Banks Adjust Strategy, 31 January 2008, http://www.banktech.com/internal-fraud-still-a-danger-as-banks-adjust-strategy/d/d-id/1291705?

[Geig06] M. Geiger, Counter-Forensic Tools: Analysis and Data Recovery, 2006, http://www.first.org/conference/2006/program/counter-forensic_tools__analysis_and_data_recovery.html

[Glen11] M. Glenny, DarkMarket: Cyberthieves, Cybercops and You. New York: Alfred A. Knopf, 2011.

[Höll14] J. Höller, V. Tsiatsis, C. Mulligan, S. Karnouskos, S. Avesand and D. Boyle, From Machine-to-Machine to the Internet of Things: Introduction to a New Age of Intelligence, Elsevier, 2014.

[ISF14] ISF, The Standard of Good Practice for Information Security, https://www.securityforum.org/tools/sogp/

[ITGI07] IT Governance Institute, COBIT 4.1 Excerpt, 2007, https://www.isaca.org/Knowledge-Center/cobit/Documents/COBIT4.pdf

[Kedz] M. Kedziora, Anti-Forensics, http://www.forensics-research.com/index.php/anti-forensics/#index

[PCI15] PCI Security Standards Council, PCI SSC Data Security Standards Overview, https://www.pcisecuritystandards.org/security_standards/documents.php?agreements=pcidss&association=pcidss

[Univ] University Alliance, What is Big Data?, Villanova University, http://www.villanovau.com/resources/bi/what-is-big-data/#.VSAwR_msXuQ

[Wiki15] Wikipedia, Security information and event management, 2015, http://en.wikipedia.org/wiki/Security_information_and_event_management

Inzicht in uw risico’s – any time, any place

Up-to-date managementinformatie blijft voor veel organisaties een uitdaging. Vaak is de informatie te laat beschikbaar of matcht de informatie niet (meer) met de behoeften, terwijl de meeste organisaties systemen tot hun beschikking hebben waarin de basisinformatie is opgeslagen. Dashboards kunnen een belangrijke sprong voorwaarts voor u realiseren. Juist in een dynamische omgeving waarin uw doelstellingen en strategie ook mee veranderen, bieden dashboards een flexibele, effectieve en efficiënte mogelijkheid om uw informatievoorziening up-to-date te houden. Met behulp van dashboards bent u beter in staat de belangrijkste trends en ontwikkelingen en daaruit voortvloeiende risico’s en de effecten binnen uw bedrijf te monitoren en daardoor snel tot gerichte managementacties over te gaan.

Inleiding

Een managementinformatiesysteem van deze tijd maakt direct gebruik van brondata uit de operationele systemen en stelt realtime informatie beschikbaar: ‘any time, any place, any device’. Geen dikke rapporten maar een systeem waarbij de gebruiker zelfstandig kan doorklikken en gedetailleerdere informatie kan ophalen, volledig geautomatiseerd en ook op mobiele devices. U kunt als gebruiker uw informatiebehoefte verkrijgen zonder een IT-afdeling te vragen kostbare en statische rapporten te maken waarvan de doorlooptijd vaak lang is. Wij herkennen deze mogelijkheden in de dashboards die wij voor enkele van onze klanten hebben ontwikkeld en waarbij de mogelijkheden om de informatie te ontsluiten bijna onbegrensd zijn. Centraal in onze ervaringen staat enerzijds de aansluiting tussen de strategie, doelstellingen, kritieke succesfactoren, risico’s en onzekerheden die hiermee verband (kunnen) houden en anderzijds de ontsluiting van de benodigde informatie uit de bronsystemen om te kunnen bepalen waar een organisatie staat. Wij noemen dat ‘closing the loop’. Interessant voor u?

In dit artikel tonen wij u twee voorbeelden van dashboards. Hiermee laten wij zien dat het ontwikkelen van dashboards geen ‘ver-van-uw-bedshow’ hoeft te zijn en dat relatief eenvoudig toegevoegde waarde kan worden gecreëerd met het gebruik van deze dashboards. Hopelijk zetten wij u op deze wijze aan het denken en kunnen wij u behoeden voor een aantal valkuilen.

Case 1: ‘Added Value’ Risk Management Dashboarding bij fast moving consumer goods retailers

Organisaties willen graag wat meer ‘in control’ zijn, maar ze krijgen kippenvel van het idee dat ze compliant moeten zijn. Het voldoen aan geldende wet- en regelgeving en de daaruit voortvloeiende rapportageverplichtingen zou niet moeten leiden tot schade aan de pragmatische en ondernemende cultuur binnen de organisatie en de organisatie zou ook niet moeten worden afgeremd door te veel ingerichte controlemaatregelen. Tegelijkertijd horen we vaak terug dat het de organisatie veel energie en herstelwerk kost om haar organisatie in control te houden en voldoende managementinformatie te verkrijgen.

‘Added Value’ Risk Management Dashboarding zou hierbij kunnen helpen. Hierbij worden gegevens vanuit de bronsystemen (bijvoorbeeld ERP) geladen om vervolgens op verschillende managementniveaus – via dashboards – te worden gepresenteerd.

In deze eerste casus beschrijven we de aanpak en het resultaat van ‘Added Value’ Risk Management Dashboarding zoals we dat recentelijk voor een aantal retailklanten in de fast moving consumer goods hebben uitgewerkt. Deze case beschrijft een situatie waarin wij de betreffende klanten hebben ondersteund om vanuit de belangrijkste risico’s tot een stelsel automatisch gegenereerd dashboards te komen die de bedrijfsrisico’s monitoren. Hiermee wordt inzicht verkregen in de ontwikkelingen van specifieke risicogebieden en de toegevoegde waarde van de daaraan gerelateerde klantactiviteiten.

Uitgangspunten

Gebaseerd op onze ervaringen zijn de volgende uitgangspunten/aannames cruciaal voor een effectief project:

  • Focus op de belangrijkste risicogebieden. Deze risicogebieden kunnen worden geïdentificeerd binnen de directie. Voorbeelden hiervan zijn geld- en goederenbeweging, liquiditeit, inkopen, ICT, controls en HR. Het selecteren van afgebakende risicogebieden zorgt voor de gewenste focus in het project.
  • Probeer een balans te vinden tussen risico’s, de traditionele harde en de ‘nieuwe’ zachte beheersmaatregelen (soft controls).[Soft controls zijn de niet-tastbare gedragsbeïnvloedende factoren in de organisatie, gericht op het beheersen van het gedrag van medewerkers, zowel gewenst gedrag als ongewenst gedrag. Soft controls bieden de leiding van de organisatie handvatten om een cultuur van vertrouwen in te richten tot op het niveau van het interne risicobeheersings- en controlesysteem.]
  • Maak gebruik van uw IT-investeringen. De data worden rechtstreeks uit de belangrijkste (ERP‑)systemen geïntegreerd in de dashboards.

Top-down aanpak

Wij focussen ons bij aanvang van de implementatie van ‘Added Value’ Risk Management Dashboarding allereerst op de belangrijkste strategische risico’s voor de vastgestelde risicogebieden. Hiertoe analyseren wij samen met de organisatie welke gebieden zij initieel als de belangrijkste risicogebieden zien. Vervolgens analyseren wij samen met de organisatie het bestaande beheersingsraamwerk. Ten slotte geven wij op iteratieve wijze de dashboards vorm en inhoud (zie figuur 1).

C-2015-4-Basten-01

Figuur 1. Het driestappenplan van risicoassessment tot dashboarding.

Stap 1: Risicoassessment-workshops uitvoeren

Deze stap heeft tot doelstelling de belangrijkste risico’s per risicogebieden vast te stellen. Dit is een belangrijke fase omdat het aantal risico’s de scoping en de diepgang van de dashboards bepaalt. Deze stap bestaat uit drie activiteiten:

  1. Vaststellen van de belangrijkste risico’s per risicogebied. Onze ervaring leert dat deze activiteit door een zo hoog mogelijk orgaan binnen de organisatie uitgevoerd dient te worden, bij voorkeur de directie. Door een interactieve en goed voorbereide sessie te organiseren kunnen binnen een korte tijd de risico’s per deelgebied worden geïdentificeerd. Deze vormen de basis voor het dashboard en interne controlesysteem.
  2. Vaststellen van de maatregelen die reeds aanwezig zijn en die ontworpen moeten worden. Hiertoe beoordeelt het middelmanagement de risico’s per risicogebied, maakt de risico’s concreet en vult deze aan met de aanwezige en nog gewenste beheersmaatregelen. Op deze wijze is er een duidelijk inzicht in de ‘gap’ tussen de bestaande en de gewenste situatie.
  3. Vaststellen van de informatiebehoefte. Voor elk van de beheersmaatregelen wordt vastgesteld in welke systemen deze maatregelen dienen te worden geconfigureerd. In kleinere groepen wordt bepaald welke controls in welke systemen geborgd moeten worden en of voldoende informatie voorhanden is.
Stap 2: Het Internal Control Framework opstellen

Deze stap heeft tot doel de risico’s, beheersdoelstellingen en controls concreet te maken. Hiervoor wordt een risico- en controlmatrix opgesteld per risicogebied.

  • Per risicogebied wordt een risico- en controlmatrix opgesteld. Voor elk van de risico’s wordt een uitgebalanceerde set van beheersmaatregelen ontworpen. De beheersmaatregelen bestaan uit (efficiënte) preventieve applicatiecontrols en repressieve manuele controls. Deze beheersmaatregelen worden vertaald in key risk indicators (KRI’s): hoe worden deze beheersmaatregelen gemeten?
  • Als de risico- en controlmatrix is opgesteld, dient voor de applicatiecontrols te worden beschreven hoe deze binnen het systeem geconfigureerd worden. Voor de manuele controls dienen de beheersmaatregelen in detail te worden beschreven en te worden geïntegreerd in de bestaande werkinstructies.
  • Beschrijf tot slot hoe de KRI’s concreet in het systeem gemeten kunnen worden. Maak de KRI’s SMART en beschrijf de wijze van meten in functionele en technische documentatie.
Stap 3: De risicodashboards ontwikkelen, testen en implementeren

Deze fase heeft tot doel pragmatisch en iteratief toe te werken naar een prototype dashboard.

  • Als eerste worden er prototypen ontwikkeld. Onze ervaring leert dat het ontwerpen, ontwikkelen en testen van de dashboards veel tijd kan kosten. Hierdoor bestaat het risico dat het proces momentum verliest. Onze tip is om te werken met prototypen in PowerPoint. Deze prototypen geven de ‘look and feel’ weer en helpen de managers en directie meer gevoel te krijgen bij de mogelijke oplossingen voor het beheersen van de risico’s en de daaraan gerelateerde oorzaken en gevolgen. De prototypen stellen het projectteam in staat de informatiebehoefte nader af te stemmen op de specifieke wensen van de gebruikers. Hierdoor wordt er in de ogen van de gebruikers relatief snel resultaat geboekt en zijn ze betrokken bij de ontwikkeling.
  • Prototypen worden vertaald naar concrete dashboards in het Business Intelligence (BI)-landschap. Nu er overeenstemming is over de prototypen, kunnen deze worden vertaald en geïntegreerd in het bestaande BI-landschap worden gerealiseerd om ze vervolgens te laten testen door de business. Aandachtspunten hierbij zijn dat IT-organisaties eisen stellen aan de functionele en technische beschrijving van de dashboards. Daarnaast dient u rekening te houden met eventueel nieuw te ontwikkelen interfaces.
  • Richt randvoorwaardelijke beheerprocedures in. Om de integriteit, consistentie en betrouwbaarheid van de dashboards in lijn te houden met onderliggende documentatie dienen er change-managementprocedures ontwikkeld en geïmplementeerd te worden om te bewerkstelligen dat risico- en controlmatrices worden onderhouden en consistentie wordt gewaarborgd tussen de risico- en controlmatrices met de functionele en technische documentatie en de dashboards in de BI-omgeving.

Concreet voorbeeld (gefingeerd)

In dit voorbeeld wordt de aanpak concreet gemaakt met een casus.

  1. In de boardroom geeft de directie aan dat liquiditeit een risicogebied is. Er worden twee risico’s benoemd in de risicoanalyse.
  2. Met proceseigenaren en -managers wordt een workshop georganiseerd waarbij ze de belangrijkste risico’s gaan concretiseren. Daarnaast zullen er key controls of key risk indicators worden geïdentificeerd ter monitoring van het risico.

C-2015-4-Basten-t01

  1. Vervolgens worden de KRI’s gemonitord via een dashboard waarbij een mix van key risk indicators zichtbaar wordt gemaakt.

C-2015-4-Basten-01b

Het resultaat: lang leve de automatisering!

Het resultaat bestaat uit een up-to-date risicobeheersingsraamwerk met reguliere beheersmaatregelen in combinatie met het monitoren van gerelateerde risico’s via een overzichtelijke set van dashboards.

  • Voor het monitoren van de reguliere beheersmaatregelen wordt een traditionele workflowtool gebruikt met e-mailalerts. Deze workflowtool zorgt periodiek voor opvolging van en rapportage over de status en de effectiviteit van de werking van deze beheersmaatregelen.
  • Voor de KRI’s zijn de dashboards ontwikkeld. Elk onderdeel en niveau in de organisatie (strategisch, tactisch en operationeel) heeft zijn focus gericht op specifieke KRI’s. Per risicogebied is een apart dashboard opgesteld.
  • De dashboards geven uiteindelijk het resultaat weer van de KRI’s en de effectiviteit van de beheersmaatregelen. Periodiek worden data geüpload vanuit de toeleverende systemen om de dashboards te voorzien van actuele data.

C-2015-4-Basten-02a

Figuur 2a. Voorbeeld van een prototype dashboard voor leveranciers.

C-2015-4-Basten-02b

Figuur 2b. Voorbeeld van een prototype dashboard voor ICT.

Case 2: Compliance dashboarding bij een verzekeraar

Hoe beheerst een verzekeringsmaatschappij haar compliance-, operationele en financiële risico’s?

Vervullen van ontbrekende behoefte

Bestuurders van verzekeringsmaatschappijen staan voor de taak de risico’s van de verzekeringsmaatschappij goed te monitoren, evenals de (financiële) performance. Deze uitdagende tijd vraagt om een continu inzicht in en overzicht van de prestaties en risico’s van een verzekeringsmaatschappij. Een verzekeringsdashboard kan hier een goede oplossing voor zijn, omdat een dashboard alle informatie op een gestructureerde wijze toont en tevens de uitzonderingen die aandacht behoeven eruit laat springen. Iedere bestuurder zou direct inzicht moeten hebben in de mate waarin de door de maatschappij gestelde KPI’s (key performance indicators) en KRI’s (key risk indicator) worden gehaald. Dit blijkt vaak niet het geval.

Bestuurders hebben de wens om eenvoudig en direct inzicht in én overzicht van de performance en risico’s van hun verzekeringsmaatschappij te hebben. Dat staat echter in schril contrast met de overdaad aan informatie binnen een bestuur, die vaak niet uitblinkt in overzichtelijkheid en consistentie. De echt relevante signalen, die opvolging behoeven, zijn vaak niet eenvoudig uit de dikke rapportages te halen. Bovendien zijn de rapportages meestal sterk gericht op het verleden terwijl bestuurders toekomstgerichte beslissingen moeten nemen. De vraag is: waarom beschikken verzekeringsmaatschappijen niet over een dashboard met de belangrijkste actuele stuurinformatie? Daarmee zouden ze beter inzicht kunnen krijgen in de performance van de verzekeringsproducten en de gebieden die verbetering behoeven. In zo’n dashboard kun je dan ook nog klikken op of swipen over iets wat je niet kunt plaatsen en vervolgens de onderliggende details krijgen. En als het nodig is nog kun je nog een keer klikken voor nog gedetailleerdere informatie.

Een managementdashboard of kortweg dashboard is een geaggregeerd totaaloverzicht waaruit duidelijk wordt hoe een organisatie scoort op belangrijke KPI’s of KRI’s, inclusief de uitbestede diensten. Hiermee wordt een einde gemaakt aan de overdaad aan papieren rapporten en overzichtslijsten.

Beschrijving van dashboard en hoe het doel wordt gehaald

Het ontwikkelen van een dashboard voor een verzekeringsmaatschappij kan op verschillende manieren en vanuit verschillende perspectieven. Wij hanteren als startpunt vaak een internationaal KPMG-onderzoek onder verzekeringsmaatschappijen genaamd Evolving Insurance Regulation: Time to get ahead ([KPMG12]). In dit onderzoek staan drie gebieden centraal die ieder grote druk leggen op de managementagenda. Deze gebieden zijn regelgevende druk, operationele druk en consumentendruk. Deze driedeling kan een goed startpunt vormen om vast te stellen welke informatie/inzichten nodig zijn om de huidige status per gebied te kunnen weergeven. Eerst wordt dit op het hoogste niveau in kaart gebracht en vervolgens kan ieder gebied in meer detail worden uitgewerkt. Naast de drie gebieden is er in dit dashboard ook voor gekozen om de belangrijkste KPI’s op te nemen.

C-2015-4-Basten-03a

Figuur 3a. Het verzekeraarsdashboard met drie perspectieven.

Het voorbeelddashboard in figuur 3a bevat de drie gebieden die de grootste druk leggen op de managementagenda, inclusief voor ieder gebied de stand van zaken op een visuele manier weergegeven. Bovenin worden de belangrijkste operationele kengetallen getoond, zoals het aantal nieuwe polissen en fraudes.

Het goed presteren van verzekeringsmaatschappijen hangt niet alleen af van het aantal producten dat wordt verkocht en het aantal gemelde schades, maar ook van de beleggingsopbrengsten in relatie tot beheerste financiële risico’s. De operationele kosten spelen echter ook een belangrijke rol, mede omdat deze jaarlijks terugkeren. Ten slotte kan het dashboard ook inzicht geven in fraudes, in de mate waarin controls zijn getest en in hoeverre de organisatie compliant is met de geselecteerde wetgeving. Al deze factoren moeten op enig moment terugkomen in het verzekeringsdashboard. Zo ontstaat één dashboard dat het presteren van een verzekeringsmaatschappij vanuit de verschillende perspectieven weergeeft.

Hierna wordt een aantal voorbeelden van een verzekeringsdashboard aangereikt. Belangrijk om te vermelden is dat het één geïntegreerd dashboard betreft waarop je kunt klikken, waardoor je nieuwe, meer gedetailleerde gegevens/inzichten krijgt.

C-2015-4-Basten-03b

Figuur 3b. Voorbeeld van een operationeel risicodashboard: schadebehandeling.

Het dashboard in figuur 3b geeft de verzekeringsmaatschappij in vier onderdelen weer (productdefinitie, polisacceptatie, prolongatie en schadebehandeling), inclusief de score (groen, oranje en rood) per onderdeel. Als je bijvoorbeeld klikt op ‘Schadebehandeling’, worden twee overzichten getoond. De linkergrafiek geeft de bedragen weer voor de inkomsten (premies) en de uitgaven (schademeldingen) over de laatste twaalf maanden. Voor schademeldingen is ook nog onderscheid gemaakt tussen geaccepteerde schademeldingen en afgekeurde schademeldingen. Als je een bepaalde maand in de grafiek selecteert, worden voor deze maand de aantallen uitgedrukt per product (drill-down).

In de rechtergrafiek worden afgekeurde schademeldingen gepresenteerd. Afgekeurde schademeldingen zijn voor een verzekeringsmaatschappij financieel aantrekkelijk maar zullen bij de consument vaak leiden tot teleurstelling en hem een negatief gevoel kunnen geven (‘Ik heb al die jaren verzekeringspremie betaald; nu heb ik een keer schade en krijg ik niks uitgekeerd!’).

C-2015-4-Basten-03c

Figuur 3c. Voorbeeld van een complianceverzekeringsdashboard gericht op controls.

Het dashboard in figuur 3c geeft het complianceperspectief weer van het verzekeringsdashboard. Op het hoofddashboard is op de button ‘Regelgevende druk’ gedrukt. Vervolgens krijg je de vier belangrijkste regelgevingen voor een verzekeraar gepresenteerd, inclusief de huidige status. Als je dan vervolgens op bijvoorbeeld ‘ICF / FSA’ (Internal Control Framework / Financial Statement Audit) drukt, krijg je inzage in hoe de proces- en IT-controls scoren over het gehele bedrijf. Daarnaast wordt per soort control gepresenteerd hoeveel van dit soort controls relatief binnen een specifiek label/channel/bedrijfsonderdeel aanwezig zijn. Hiermee wordt inzicht verkregen in de mate waarin op bepaalde controls wordt gesteund binnen een label. Applicatieve controls zijn efficiënter en effectiever dan manuele controls, dus zegt de verdeling ook iets over de efficiëntie van het framework.

Niet iedere control is onderdeel van de FSA, vanwege materialiteit. Echter, een FSA-control die ineffectief is, leidt tot tijdsintensieve additionele werkzaamheden. Daarom is het belangrijk om zowel een FSA- als een ICF-perspectief te hebben over de verschillende labels, zodat het juiste beeld wordt verkregen en gepaste vervolgacties kunnen worden ondernomen.

C-2015-4-Basten-03d

Figuur 3d. Voorbeeld van een complianceverzekeringsdashboard gericht op functiescheidingen.

Vanwege het belang van functiescheiding is ook continue monitoring op functiedoorbreking in het dashboard opgenomen (zie figuur 3d). Als je drukt op de application control ‘Functiescheiding’, worden de bijbehorende details getoond. In het midden wordt het aantal functiedoorbrekingen getoond in verhouding tot het aantal functiescheidingen. Onder in het dashboard wordt ingezoomd op de functiedoorbrekingen. Per soort functiedoorbreking worden de personen opgesomd en vervolgens worden ook het aantal keer en het bedrag getoond. Doordat het bedrag wordt getoond wordt meteen duidelijk of er sprake is van een schoonheidsfoutje of een mogelijke fraude. Met deze informatie kan dan ook meteen actie worden ondernomen.

C-2015-4-Basten-03e

Figuur 3e. Voorbeeld van een verzekeringsdashboard over opzeggingen.

Eerder in dit artikel hebben we de bovenkant van het verzekeringsdashboard uitgelegd. Ook hierop kan worden gedrukt zodat meer details worden verkregen. Bijvoorbeeld: als je drukt op het aantal opzeggingen, wordt een figuur getoond die weergeeft om welke redenen klanten een verzekering hebben opgezegd (zie figuur 3e).

C-2015-4-Basten-03f

Figuur 3f. Voorbeeld van een klantenverzekeringsdashboard.

Naast interne informatie is het ook van belang externe informatie in het dashboard op te nemen, oftewel: hoe ervaart de klant de verzekeringsmaatschappij? Op basis van het Keurmerk Klantgericht Verzekeren (KKV) is een aantal criteria opgeteld die ook worden gepresenteerd in het dashboard (zie figuur 3f). Het overzicht van niet-uitgekeerde schades komt terug in dit gedeelte van het dashboard, omdat deze informatie ook relevant is voor het keurmerk. Daarnaast worden ook reactietijden gepresenteerd en is te zien hoe het label scoort ten opzichte van de markt (zie midden rechts in figuur 3f).

Bevestiging dat initiële behoefte is ingevuld

Samenvattend vinden wij dat dit soort dashboards goed invulling geven aan integraal compliance-, operationeel en klantmanagement. Vanzelfsprekend zijn de getoonde dashboards slechts voorbeelden en is een echt dashboard vele malen uitgebreider. Wanneer u dit soort dashboards gaat gebruiken zal er ongetwijfeld behoefte ontstaan aan andere, betere of nieuwe inzichten waarmee het dashboard kan worden verrijkt. Ook het bewustzijn van en het inzicht in de risico’s zal hierdoor verder toenemen, wat uiteindelijk leidt tot een betere besturing van een verzekeringsmaatschappij.

Conclusie

In dit artikel hebben wij twee voorbeelden van dashboarding behandeld. Deze voorbeelden in verschillende typen organisaties laten zien dat de ontwikkeling en implementatie van dashboards in geweldige mogelijkheden voorziet. Dashboards brengen echter ook een aantal praktische ‘uitdagingen’ met zich mee. Ter afsluiting noemen we een aantal van deze aandachtspunten:

  • Commitment in de directie. Stel binnen de directie de vraag waarom zij een project voor het implementeren van dashboards wil starten. Overtuig uzelf van wat de directie via dashboards wil monitoren en hoe dit zich verhoudt tot de strategische doelen en daarmee samenhangende risico’s. Zonder een helder commitment adviseren wij er (voorlopig) niet aan te beginnen. Het is essentieel dat de directie vervolgens actief betrokken is bij de verschillende fasen van het ontwikkel- en implementatietraject voor dynamische monitoring; voor veel organisaties is het loslaten van een centrale leiding een cultuuromslag die duidelijke sponsoring vereist vanuit de directie. In dit artikel is een aantal voorbeelden gegeven in welke fasen de directie betrokken kan worden.
  • ‘Close the loop’-principe. Het model wordt top-down afgeleid vanuit de doelstellingen en strategie via de risico’s en beheersmaatregelen. Vervolgens wordt met de source data vanuit de operationele systemen de informatie opgebouwd en ontsloten via dashboards; voor zowel het hoogste als alle onderliggende managementniveaus is van belang dat de relevante personen en ook de relevante informatie beschikbaar zijn.
  • Drill-down. De gebruiker kan top-down door de informatiestructuur klikken en inzicht verschaffen in de onderliggende details. U hoeft dus niet meer te wachten op een collega-medewerker voor aanvullende detailinformatie. De gewenste informatie kan immers op elk moment van de dag realtime worden verkregen. Uw rapportages komen dus nooit meer te laat en matchen uw persoonlijke behoefte als gebruiker.
  • Integratie met het huidige IT-landschap. De dashboards dienen zo veel mogelijk volledig geïntegreerd te worden in de bestaande IT-oplossingen. Tenzij de bestaande IT-oplossingen niet voldoen, leveren nieuwe oplossingen alleen maar weerstand en hoge kosten op.
  • Rapportage via BI-oplossingen. Onze ervaring is dat het merendeel van de data reeds aanwezig is op de betreffende BI-server; voor de dashboards wordt alleen een andere ‘view’ gebruikt. Belangrijk hierbij is dat de toegeleverde data juist zijn en dat er binnen het landschap uniforme datadefinities worden gebruikt. Het ontsluiten van de informatie kan op verschillende devices worden gerealiseerd. En voor de volledigheid: alleen met behulp van deze automatiseringsslag kunt u efficiënt dashboards introduceren en onderhouden.
  • ‘Think big, act small and move fast.’ Deze aanpak, die voorschrijft om groot te denken maar klein te beginnen en hieruit successen te vieren en daar vervolgens meteen op door te pakken, staat borg voor een succesvolle implementatie. Concreet betekent dit: selecteer de processen of de risicogebieden met het hoogste risico en werk deze uit. Maak prototypen van de dashboards en bespreek die met de eindgebruikers, want pas dan gaat dit leven op elk niveau in de organisatie. Start met het implementeren van één dashboard. Is dit een succes, ga dan door met de andere. Pak niet te veel dashboards parallel op en vermijd ‘ivoren toren development’, maar ga voor kleine successen en gebruik deze om het succes uit te bereiden.
  • Focus op de belangrijkste risicoperformancegebieden. Begin met redeneren vanuit de relevante aandachtsgebieden aan de directietafel. Dit kunnen performance-indicatoren of risicogebieden zijn. Voorbeelden hiervan zijn geld- en goederenbeweging, liquiditeit, inkopen, ICT en HR. Het selecteren van geprioriteerde en afgebakende performancegebieden zorgt voor de gewenste focus in het project.
  • Balans in uw activiteiten. Vind bij het gebruik van dashboards een balans tussen de informatiebehoeften, de belangrijkste risico’s, de traditionele harde en de ‘nieuwe’ zachte beheersmaatregelen (soft controls), de monitoring- en rapportageactiviteiten.
  • Commitment van de stakeholders. Verzeker u tijdig van commitment van relevante stakeholders. Denk hierbij niet alleen aan het management, maar ook aan de afdelingen die verantwoordelijk zijn voor het leveren van inputdata, de afdeling informatiebeveiliging en de softwareontwikkelingsafdelingen. Betrek alle lagen van de organisatie bij ontwerp, implementatie en testen.

Literatuur

[KPMG12] KPMG International, Evolving Insurance Regulation: Time to get ahead…, 2012.

How Big Data Can Strengthen Banking Risk Surveillance

In recent years, new legislation has raised the bar for banks in domains such as credit risk and integrity risk (anti-money laundering, fraud, etc.). Banks have made considerable investments in upgrading their efforts to comply with these regulatory standards. Big Data techniques now offer new potential to increase both the efficiency and effectiveness of these tasks by up to 50%. Algorithms can plough through data, stored in data lakes collected from various data sources and thereby bring surveillance to the next level. Banks that successfully apply these techniques also have an excellent starting point to create value from Big Data in other domains. Value for the customer and value for the bank. In this article we will show the possibilities and impossibilities of Big Data techniques in relation to risk surveillance.

Impossible Is Nothing?

The promise of Big Data is impressive. It can help us better understand individual customer needs, increase sales, find better ways to organize processes, predict criminal behavior, reduce traffic congestions or even lead to better focused cancer treatments. We are at the start of a great journey towards a new paradigm: the data driven society. Many business sectors are being reshaped at an astounding pace, fueled predominantly by new digital innovations based on data analysis. We live in a world where everything is measurable and in which people, and almost every device you can think of, are connected 24/7 through the internet. This network of connections and sensors provides a phenomenal amount of data and offers fascinating new possibilities which, together, are often called Big Data.

Chances are that you’ve read articles or books about the impact of Big Data. We can quote boxing legend Muhammad Ali, stating “Impossible is nothing”, to summarize many of these. But we also need to be realistic. As of now, a large part of the potential of Big Data is still nothing more than a promise. In this respect, the term vaporware springs to mind. In the early days of the computer industry, this word was introduced to describe a product, typically computer hardware or software, that was announced in the media but was never actually introduced on the market nor officially cancelled. Use of the word later broadened to include products such as automobiles.

Big Data and Surveillance

There is no doubt that Big Data can be very helpful for banks to comply with legal and regulatory requirements in the integrity risk and credit risk domains. Automated analysis of data from various sources is an effective approach to trigger red flags for high-risk transactions or clients and to reduce the false positives. Especially the combination of data from multiple sources – internally and externally – is what turns data analysis into a powerful tool. Applying these techniques is not only a more cost effective way to deal with compliance requirements – e.g. reducing the number of staff involved – it is also more effective.

A clear indicator is the application of Big Data analytics in the credit risk management domain of a retail bank. Using credit risk indicators based on behavioral patterns in payment transactions, has proven to lead to significant earlier detection of credit events than conventional indicators based on overdue payments and overdrawn accounts. In fact, it enables banks to predict which clients will run into financial difficulties up to a year in advance. The social physics – meaning, the behavior of people – seems even more valuable for a bank than conventional data such as age, income or repayment history. The same approach can radically enhance surveillance techniques to identify violation of anti-money laundering regulation or customer due diligence policy.

An important question is: are people able to lift their current reservations to rely on algorithms and machine learning techniques. A basic prerequisite for the success of Big Data analytics is a change in attitude towards the insights that data analysis can provide, since these insights are often better than human experience or intuition. Andrew McAfee – one of the authors of The Second Machine Age – points at this in an article with the headline: Big Data’s Biggest Challenge? Convincing People NOT to Trust Their Judgment. He stresses that human expertise has its limitations. “Most of the people making decisions today believe they’re pretty good at it, certainly better than a soulless and stripped-down algorithm, and they also believe that taking away much of their decision-making authority will reduce their power and their value. The first of these two perceptions is clearly wrong; the second one a lot less so.” We must reinvent the way we look at data and take decisions. In the words of Ian Ayres, from his book Supercrunchers: “Instead of having the statistics as a servant to expert choice, the expert becomes a servant of the statistical machine.”

Improving Credit Risk Indicators

Traditionally, credit risk indicators used by banks signal changes in the creditworthiness of a customer whenever a “credit event” occurs. For example, when a payment is missed or a household is left with a residual debt after selling a house. The ambition of many banks is to signal such possible payment issues months or even a year in advance. These signals would enable a bank to help a customer by offering a payment plan before payment problems actually occur. It allows customers to be helped better and engaged with more closely. Credit losses can be reduced and experts can be deployed more efficiently.

One way to improve the predictability of credit risk indicators is to monitor transactions: payments, investments, savings. Based on these (payment) transactions common behavioral patterns of individual customers, industries and customer segments can be identified. When historical data is available (e.g. up to three years of transaction data) group-specific “healthy” behavior can be identified. Behavior that deviates from the healthy norm can be a potential credit risk indicator. Data analytics has shown that a shift in payment behavior is visible up to 12 months before a consumer or small enterprise defaults on its payments.

How Is It Done?

To develop predictive analytics models for signaling credit risks the following steps need to be taken:

  1. Select data sources, such as payment transactions, and install this data on a big data analytics platform.
  2. Explore the data and find characteristics. Solve data quality issues and anomalies.
  3. Classify all transactions: label transactions based on type and periodicity.
  4. Cluster customers based on corresponding behavior.
  5. Identify “normal” behavior of these clusters and of individual customers.
  6. Identify behavior that deviates from normal behavior.
  7. Find deviant behavior that correlates with defaults.
  8. Build these findings into a prototype predictive model.
  9. Validate the correctness of the model.
  10. Iterate steps 1 to 9, with the aim of creating a self-learning algorithm that is integrated in the architecture. For example one that minimizes false positive indicators over time.

So is the potential of Big Data in relation to surveillance within reach for banks, or do we risk another case of vaporware? Based on our experiences with Big Data analytics, we are convinced that the surveillance potential of Big Data is far more than vaporware. We present our case for this in the remainder of this article.

Technical Advances in Computing

To this end, we first touch upon some technical developments that underpin the rise of Big Data. One obvious reason is the digitization of society: nearly all information is digitized or can be digitized. Another is the fact that the cost of computing power, bandwidth and computer memory continues to fall dramatically, while capacity increases exponentially over time (Moore’s law). Furthermore, there is a shift in the technical approach of handling data. Traditional data management and analysis is based on relational database management systems (RDBMS). These systems typically require data to be entered in a structured and inflexible way, i.e. filling relational tables with structured, specific information. On top of that, the architecture of an RDBMS is not well suited for distribution over multiple machines, leading to increasingly expensive hardware when the amount of data is growing or when more or increasingly complex analytics are required.

Big Data storage systems aim to reduce complexity to store cost-effectively and manage large datasets and to make the data available for analysis. This is achieved by adopting a distributed system architecture of nodes which specializes in the parallelization of tasks. Well known examples are the Google File System and the Hadoop Distributed File System. In practice, these systems form the basis of many Big Data applications.

With trends like agile development, an approach complimentary to the traditional master data management MDM is gaining popularity in the world of Big Data. Rather than an upfront definition of standards, data from various sources (sometimes from outside the organization) are brought together in a “data lake” with minimal changes to their original structure. As the standards and data quality requirements can differ from one analysis to the other, data quality measures are postponed (or at least partially) to the analysis stage. The benefits of a data lake approach for data analysis are plentiful: the ease of implementation, the speed of combining data sets and “fishing” for new insights, and the flexibility of performing data analyses.

Running on top of this, the analysis software used for extracting value from data is growing ever more mature. Analysis routines range in use from the exploration and visualization of data, the combination and molding of datasets, the selection and trimming of data, multivariate analysis techniques, model building and validation, etc. These techniques, such as machine learning tools, grow ever more advanced and more and more often these get collected into standardized analysis libraries. Examples are: ipython, pandas, numpy, scipy, sklearn, R, ROOT, etc. And here’s the great news: these programs are open source and are available to everyone to contribute to and to experiment with. Altogether these create the toolbox of any data scientist.

First Steps to a Data Driven Organization

These developments indicate that the technological barriers for turning Big Data promises into tangible results are getting low and surmountable. The question that is perhaps even more important: is the organization ready for it? We can distinguish a complex of seven domains that deserve attention.

C-2015-4-Baak-01

Figure 1. Seven key components of a data driven organization.

First of all, Big Data analytics must become an integral part of the overall strategy of the company, supporting the short and medium term ambitions of the businesses. The idea to improve products and services of the bank with data analytics must be adopted throughout the entire organization.

On the left side of Figure 1, you see the three “hard” requirements regarding expertise, technology and data:

  1. The combination of technical and subject matter (or business) expertise is critical in order to identify and develop analyses that impact bottom line results. Big Data expertise must be available within the organization: Big Data scientists, technical skills (data analytics, platform) and related business skills.
  2. Organizations must have a flexible and scalable platform and the accompanying tools and techniques to deploy big data analysis. The technology should facilitate experimental freedom, fuel creativity and stimulate cooperation.
  3. Organizations must have the required data available and easily accessible (both internally and externally, structured and unstructured, real-time and historical).

On the right side of Figure 1, you see the three “soft” requirements that are just as relevant:

  1. Organizations must be able to deal with legal requirements and privacy guidelines that come with the handling of sensitive data.
  2. Big data teams must seamlessly align with business experts. Therefore Big Data efforts and processes must be organized throughout the organization.
  3. Organizations must have a generic approach to Big Data analysis, aimed at generating additional value and reducing costs. The organization has an adaptive, agile approach that supports business and correlation driven developments.

In the following, we address a number of important preconditions.

Big Data Governance

Implementing a Big Data strategy implies totally new ways of working and room for experimentation. Often, a supportive environment for innovation leads to novel products, creates new markets and leads to more efficient and effective processes. However, this does not mean that business leaders should grant their people an unlimited license to experiment. Rather, they should facilitate experiments under active governance. This implies room for creativity and experiments on the one hand, and a highly professional Data Analytics organization and processes on the other. One can make the comparison with the technique used by professional racing drivers that involves operating the brake and gas pedals simultaneously with the right foot: the heel and toe racing.

Good governance is quintessential to ensure that Big Data projects live up to expectations and that their potential is more than “vaporware”. Executives are in the position to make sure that Big Data projects and/or departments get the power and the resources that are needed to succeed. It deserves to be in the driver’s seat to transform the business in three domains: realizing growth, controlling risk and optimizing performance. Strong sponsorship from the top is an important prerequisite for this. Board members who “walk the walk and talk the talk” and explicitly communicate that Big Data will be decisive for the future of the organization, have proven to be an essential success factor for big data initiatives.

More Than Number Crunching

The success of a Big Data initiative depends on the quality of the data scientists. Big Data analytics requires data scientists who have a PhD or Master’s degree in exact sciences (computer science, mathematics, physics, econometrics), are experienced in pruning, trimming, and slimming large volumes of (low quality) data, have knowledge and experience in numerical and statistical methods (such as Monte Carlo simulation), are experienced in using standard (proprietary) software for analysis (such as Excel, SAS, SPSS) and in applying machine learning and multivariate analysis tools (such as decision trees, neural networks, etc.)

Yet executives need to be aware that Big Data analytics is much more than number crunching. It is about using data analysis in the proper context. We quote Sherlock Holmes, saying “It’s human nature to see only what we expect to see,” as an important warning.

Skilled data scientists are fully aware of the risks of misinterpreting data – for instance by confusing correlation and causality. Central in their work is to deal with the so called Simpson’s paradox. This paradox can be explained by statistics about the use of life jackets. At first glance, these statistics show that people not wearing life jackets more often survive in case of an emergency. This is of course counterintuitive, but does make sense on closer examination of the numbers: sailors wearing life jackets were more often experiencing bad weather conditions, which is a dominant factor in survival. Sherlock Holmes would have thought this through, being able to look beyond the obvious. This is exactly what we need from data scientists and is also the main argument why Data & Analysis is much more than number crunching by fast computers. Data scientists must be able to put their analysis in the context of what’s truly happening “underneath”, while working closely with highly involved business experts to ensure correct business conclusions are drawn.

Scoping the Value for Banks and Its Customers

With proper attention to the aforementioned conditions, banks should be able to successfully apply Big Data in the surveillance of risks to comply with legal and regulatory requirements. Perhaps more important is that Big Data analytics will open up new opportunities in other areas. In fact, interpreting behavioral patterns will be a key differentiator for banks in the near future. A bit of imagination leads to numerous new possibilities, like real-time lending based on behavioral analytics or reducing credit losses significantly by offering a customer a payment plan even before a credit event occurs.

Technologically, the possibilities have become both immense and affordable. We are now actively exploring this potential step by step. One key precondition is to be fully aware of the sensitive nature of personal data: banks should restrict themselves to using data in a way that customers are comfortable with. The first priority is to bring value to the customer in terms of quality, service and speed, without compromising privacy. It’s all about using data in the best interest of the customer. Doing so will safeguard the trust and integrity that are essential to every financial institution.

COBIT 5: a bridge too far or a giant leap forward?

With COBIT 5 out in the open for over three years now, the time has come to step back and review its accomplishments and acceptation so far. Does ISACA’s latest achievement in the art of COBIT live up to the expectations it created? And does it fulfill its ambitions? How does it differ from its predecessor? Are there now two camps – advocates and opponents – who have retreated into their trenches, harassing one another with arguments? Is the framework slowly but firmly gaining ground? Can we conclude that COBIT 5 is indeed a giant leap forward in the art of IT Governance and IT Management, or can we deduce that COBIT 5 has overplayed its hand and is just a bridge too far?

This is an article with a critical tone, combined with the opinion of three subject-matter experts closely related to COBIT.

This article has been written in a personal capacity.

Introduction

COBIT 5 was released about three years ago. We observed initial enthusiasm at several organizations but this was also followed by hesitance about moving from COBIT 4.1 to COBIT 5. The focus remains basically on IT processes, and much less on the newer ‘features’ such as the principles, enablers and others. Furthermore, despite the fact that several COBIT 5 and related publications are already available and more continue to be published, the existing adoption rate in organizations seems to moving very slowly, at least in the Netherlands and Belgium. With the addition of enthusiastic online discussions on different platforms, between die-hard believers and critical and wandering spirits, this has brought us to explore COBIT 5 further and to offer some comments on the evolution and changes made by ISACA. The purpose of this article is not to provide an in-depth overview or insight of all elements of COBIT 5, nor to provide a guide on how to use COBIT, but to list and explain some observations and thoughts based upon our professional experience.

A brief history of COBIT

Before we dive in the details of COBIT 5 and discuss its implementation, it is good to look back and see where COBIT has come from. The description below is largely based on [Bart15].

The latest version of COBIT is now presented as the framework for the Enterprise Governance of IT, but this has not always been the case or the focus. COBIT was developed by ISACA (Information Systems Audit and Control Association) in the mid-nineties, in the (financial) audit community, and its name originates from the abbreviation for ‘Control Objectives for Information and related Technologies’. As is currently still the case, the financial and internal auditors noted an increase in the level of automation at the organizations where they performed audits, creating the need for a framework to support the execution of IT audits. In fact, the first versions of the COBIT framework could be seen as the ‘COSO equivalent model for IT Auditors’. And COSO is still one of the main reference models for COBIT when it comes to internal control. Since the release of COBIT 5, this strongly branded acronym within the (IT) audit world has become consistently less relatable to its original meaning, as subsequently IT Management concepts, IT Governance concepts and now Enterprise Governance of IT concepts gradually found their way into the framework.

With the development of COBIT 3, which was released in 2000, an important element was added to the framework: management of IT. Through the addition of management guidelines, including critical success factors and other metrics, COBIT aimed at becoming a broader IT Management framework, rather than restricting itself to a future as merely an IT auditing and control tool. Another new and important extension of the framework in that version was the IT process maturity model. This model helped IT Management to use the COBIT framework as a method to increase professionalism within its own IT department and even to perform some initial benchmarking. COBIT experienced a real boost from the (internal) audit side when the SOx regulation came into force, putting emphasis on internal controls over IT.

Management, however, is not similar to governance. ISACA defines governance in their COBIT framework as:

Governance ensures that stakeholder needs, conditions and options are evaluated to determine balanced, agreed-on enterprise objectives to be achieved; setting direction through prioritization and decision making; and monitoring performance and compliance against agreed-on direction and objectives ([ISAC12])

The board of directors is responsible for the overall governance, but specific governance responsibilities can be delegated to special organizational structures at another level ([ISAC12]).

Corporate Governance became more and more important throughout the years and ISACA felt the need to further improve the COBIT framework by moving upwards in the organizational hierarchy from IT Management to IT Governance. The release of COBIT 4 in 2005, later followed by COBIT 4.1, supported this. In COBIT 4 a number of new concepts were added, amongst others:

  • Roles and Responsibilities per IT Process
  • Alignment between Business Goals and IT Goals
  • The relationship and dependencies between IT Processes
  • Additional COBIT publications such as the Control Practices and the Assurance Guide. Also a number of publications related specifically to IT Governance were released.

In addition to COBIT 4.1, two separate frameworks were introduced: Val IT and Risk IT. It was felt that the management of IT Risk and the management of IT Value were needed in addition to COBIT 4.1 in order to realize the full extent of IT Governance. In essence, the Risk IT framework was nothing new, as it included a large number of basic risk concepts which could be found in other risk methodologies as well, only now they were more adapted to IT. And although there was some very relevant and practical information to be found in the Risk IT framework and publications, this is – as far as we know – perhaps part of the reason why the acceptance and use of the Risk IT framework has been limited, at least in the Netherlands and Belgium. Another reason might well be that risk in itself is often a neglected and/or underestimated factor, and that risk management processes are not always easy to implement. In addition, the processes of Val IT were not part of the basic COBIT framework and therefore Val IT could be seen as a separate – much more business-oriented – model providing additional value and using a more understandable vocabulary and language for the business. However, to our knowledge, the use and implementation of the Val IT processes were also limited, although we have come across a number of usages in Belgium and the Netherlands. It is noteworthy that Val IT concepts are much closer to the business by definition, and could possibly already exist in a similar form but at another place in organizations without the explicit link to IT, and not identified as part of Val IT.

C-2015-1-Meijer-01

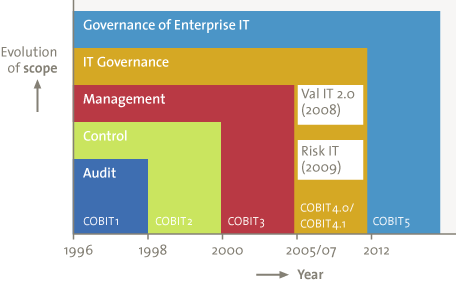
Figure 1. History of COBIT (ISACA).

The advance of COBIT 5 – where did it come from and what are the changes in relation to COBIT 4.1?

After several years of relative silence around COBIT, COBIT 5 saw the light in early 2012, with a publication subtitled ‘A Business Framework for the Governance and Management of Enterprise IT’. This already hints at an important – and, to some, absolutely necessary – scope extension: from IT Management (v3) via IT Governance (v4/4.1) to a business framework for Enterprise IT. ISACA claims that COBIT 5 is a holistic framework for the entire organization, and has therefore also consolidated and integrated Val IT and Risk IT into COBIT 5.

According to De Haes and Van Grembergen, Enterprise Governance of IT is defined as: “an integral part of Corporate Governance and addresses the definition and implementation of processes, structures and relational mechanisms in the organization that enable both business and IT people to execute their responsibilities in support of business/IT alignment and the creation of business value from IT-enabled business investments” ([Haes09]).

Interestingly enough, ISACA has not only changed its communication form by using the only acronym of COBIT nowadays, but the well-known element of ‘Control Objectives’ has also disappeared, at least in name and traditional form. Instead, COBIT 5 uses the term ‘Management Practice’. This is almost a signal to the outside world that a new era has come, and the past has been left behind!

Although in COBIT 5 the processes are described in detail in a separate publication rather than as part of the overall framework as was the case with COBIT 4.1, the content of the IT processes has been kept intact. The combination of Management Practices with related Activities can easily be used to distill the Control Objectives and related controls to satisfy the needs of the IT auditor. The naming no longer matches, but the description in COBIT 5 still helps the use from an operational perspective. COBIT 5 has increased the number of processes from 34 to 37 in total, and has made a distinction between 5 Governance processes and 32 Management processes. The processes have been revised and restructured, while new processes have been introduced as well. The operational processes (APO, BAI and DSS) are linked to the governance processes (EDM), underlining the alignment between governance and management here too (see Figure 2). Furthermore, the framework provides suggested metrics per process in order to be able to measure the performance of a process.

C-2015-1-Meijer-00

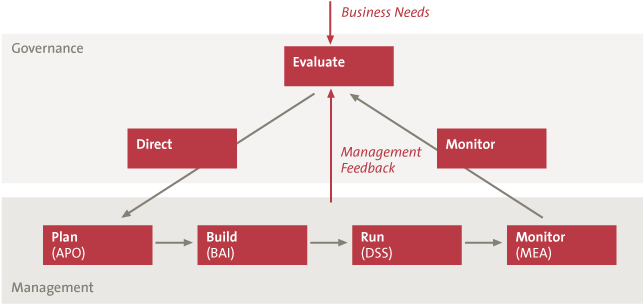
Figure 2. COBIT IT Processes.

A very important change in the framework can be found in the approach for assessing the IT processes. COBIT 4.1 defined a process maturity model that was initially based on the maturity part of the CMM model of the Software Engineering Institute. This model uses a maturity scale from 0 (non-existent) to 5 (optimized). The maturity framework also provides six generic maturity attributes (such as Awareness and Communication, Skills and Expertise) that should be taken into account when scoring the maturity of any given process. Furthermore, a generic description per maturity level is provided as well as a process-specific description per maturity level. In COBIT 5, ISACA has chosen to move away definitively from the maturity approach in favor of a capability model called PAM (Process Assessment Model) which is based on the ISO 15504 standard that was already available as a separate ‘product’ for COBIT 4.1. PAM also uses a scale from 0 (incomplete) to 5 (optimizing), but the assessment method is much more objective (and complex), as COBIT 5 provides clear descriptions of what needs to be in place per process in order to reach a specific level. The scale might look the same, but the change of assessment method is much more than just a matter of ‘wording’. Organizations will see the bar raised very substantially, even if they only aim to reach a process capability level 1 for any given process, whereas they could have scored a process maturity level 2, for example, in COBIT 4.1. This change has not been well received and many organizations still use the principles of the COBIT 4.1 maturity assessment to determine the maturity level of their COBIT 5 processes, rather than getting involved in much more complex capability assessments. An example we have experienced in the Netherlands, concerns a case where a financial institution requested a maturity assessment based on COBIT 5 (although this is not possible according to the framework) from its IT infrastructure service provider. The only rationale for COBIT 5 was the fact that this was ‘the latest version in the market’. The regulator in this case (De Nederlandsche Bank) does not require any assessment of COBIT 5 as yet. In Belgium we had a similar case for a federal government body, where we used the maturity approach of COBIT 4.1 in support of an IT audit based on COBIT 5.

A minor change to COBIT 4.1 is the phenomenon called ‘information criteria’. In COBIT 4.1 seven information criteria were used to provide guidance to an IT auditor performing an audit: effectiveness, efficiency, integrity, reliability, availability, confidentiality and compliance. COBIT 5 replaces this with no less than 15 ‘goals’, divided into three subdimensions (Intrinsic quality, Contextual and representational quality, and Security/accessibility quality). One of these goals is ‘Appropriate amount of information’. The question raised here is: what is an appropriate amount? Just enough? How realistic is it to imagine that these goals will indeed be used in daily practice? And how and to what extent do they contribute? At what price?

A good addition in COBIT 5, in our view, is that activities are now linked to management practice, rather than to a process. This enables a better understanding of which activities (or ‘controls’) would be expected to be part of the management practice (or satisfy the ‘control objective’). In addition, COBIT 5 now describes the inputs (where does it come from) and outputs (where does it go to) per management practice, which we also see as added value. This provides insight into the requirements for establishing and assessing a management practice, and illustrates the connections between management activities and practices.

The COBIT 5 product family is also much more extensive than we have seen around COBIT 4.1. Additional publications – so far – include the professional guides ‘COBIT 5 for Information Security’, for ‘Assurance’ and for ‘Risk’. Moreover, approximately ten practical guides on specific topics are currently available. Amongst others, these cover topics such as Vendor Management, Cybersecurity and Configuration Management. Furthermore, specific audit programs have been developed for the processes in the domains of EDM, APO, BAI and DSS (the MEA domain is yet to come). In our view, it is a positive development that additional publications are being released, as these focus on different audiences and usages. They have been in the pipeline for several years however, and similar information has been explained and referred to in different publications, which could lead to confusion if this is not done consistently. However, it is not always easy to keep track of all the publications that are released or of all the links between the contents of all these documents. There is a real risk that all of this will create confusion and people will lose track of developments.

COBIT 5 has also been mapped to other relevant standards and frameworks, which was also the case with the former versions. This mapping has always been and continues to be one of COBIT’s strong points. In COBIT 5, the adoption of the principles and implementation approach of the ISO 38500 standard on Corporate Governance of IT is equally supported. It would be very nice to see the re-appearance of the Mapping Series in one way or another, now with COBIT 5 as the basis, of course.

Rules of Engagement – the fundaments of COBIT 5

In this chapter, we explain a limited number of key elements of COBIT 5: the principles, the goals cascade, and the enablers.

COBIT 5 has been built around five major principles for Governance and Management of Enterprise IT. In conjunction, they should enable an enterprise to build an effective governance and management framework that optimizes information and technology investment and use for the benefit of stakeholders ([ISAC12]).

C-2015-1-Meijer-02

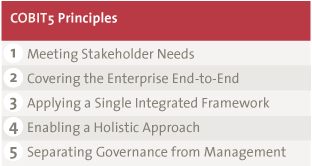
Figure 3. COBIT 5 principles ([ISAC12]).

  1. Meeting Stakeholder Needs: organizations exist to add value for their stakeholders. COBIT 5 addresses the needs of stakeholders particularly through the goals cascade, which will be further explained below. The stakeholder needs balance between the realization of most of the benefits, the optimization of risk taking, and the optimization of the use of resources.
  2. Covering the Enterprise End-to-End: as described earlier, COBIT 5 now aims at bringing together the governance of the enterprise with IT Governance, covering not only the IT department but the entire organization. Information is the key resource that requires governing here.
  3. Applying a Single Integrated Framework: COBIT 5 aims at being the overarching framework for Enterprise Governance for IT that is linked and based on best practices and other frameworks.
  4. Enabling a Holistic Approach: COBIT 5 provides a set of enablers that jointly support the implementation of governance and management of Enterprise IT. The enablers are further explained in this chapter.
  5. Separating Governance from Management: as described in the previous section, COBIT 5 has introduced two levels of processes, for governance and for management. Furthermore, the distinction between the role of both disciplines is made explicit by defining their role and responsibility.

COBIT 5 has defined – based on the existing set of business goals of COBIT 4.1 – 17 enterprise goals and 17 IT-related goals which are structured according to the Balanced Score Card dimensions (Financial, Customer, Internal, Learning & Growth). All enterprise goals are linked to one or more IT-related goals through two types of relationships: Primary (direct contribution to the goal) and Secondary (indirect contribution to the goal). In a next step, the IT-related goals are also linked to one or more of the 37 IT processes with similar relationships. This means that if you know which strategic direction an organization is taking, you can determine the most relevant IT processes or – coming from the other direction – one can easily determine whether a specific process supports one or the other IT goal, and subsequently also the enterprise goal.

C-2015-1-Meijer-03

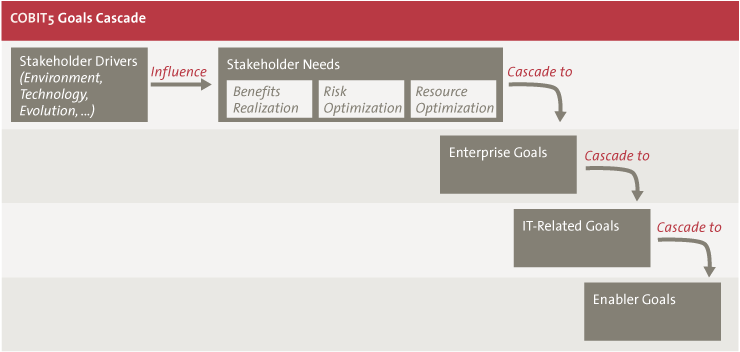
Figure 4. Goals Cascade ([ISAC12]).

To explain the Goals Cascade in more detail, a relatively straightforward example is presented below.

A company had difficulties in its financial reporting in the past, and its main objective for the next few years was to be financially transparent. This corresponds with the Enterprise Goal number 5 in the framework. Based on the mapping provided, we know that IT-related goal number 6, ‘Transparency of IT costs, benefits and risk’ is linked to the enterprise goal. Following the logic, this results in a set of IT processes most relevant for the organization:

  • EDM02 Ensure Benefits Delivery
  • EDM03 Ensure Risk Optimization
  • EDM05 Ensure Stakeholder Transparency
  • APO06 Manage Budget and Costs
  • APO12 Manage Risk
  • APO13 Manage Security

The above-mentioned processes are described in detail in the COBIT 5 publication ‘Enabling Processes’.

C-2015-1-Meijer-04

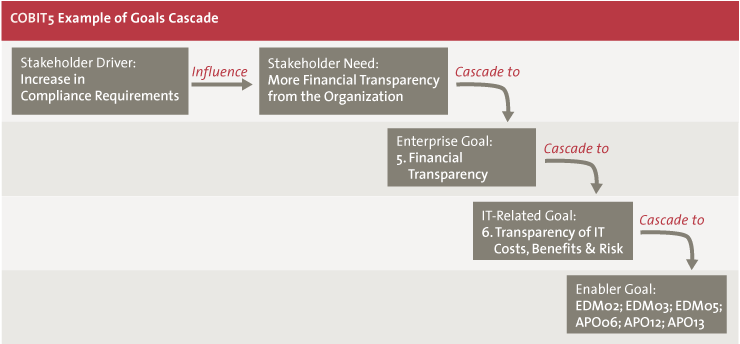
Figure 5. Example Goals Cascade.

The benefit of this structured approach provided by COBIT 5 is that it is relatively easy for any organization to determine the IT strategy and the related IT processes that need to be well in place if the enterprise strategy and goals are clearly defined. Furthermore, this provides direction for the scope of measuring or assessing the quality of the IT processes in place, as this gives insight into how well the enterprise goals are supported by IT. It should be noted that the knowledge of the scope of the processes does not say anything about the capability or maturity of the processes. These have to be assessed before a conclusion can be drawn about how well the IT processes support the respective IT goals and subsequently the enterprise goals.

A potential pitfall could be the explosion of the number of relevant IT processes if multiple enterprise goals are equally important (which is often the case in daily practice). This could quickly lead to the situation where all or almost all IT processes appear to be important. Conscious selection and prioritization are a necessity here.

COBIT 5 has defined seven enablers. Enablers are defined as “factors that, individually and collectively, influence whether something will work – in this case, governance and management over enterprise IT” [ISAC12]). The enablers form the key implementation of the principle ‘enabling a holistic approach’. This is translated into the fact that the seven enablers jointly provide more or less all elements relevant to an organization. COBIT 5 recognizes the importance of the interrelation between the enablers: e.g., processes are performed by people, using information and other resources. In its appendix, the COBIT 5 framework provides a high-level overview of the attributes of the seven enablers. However, the only enabler that is truly elaborated in the framework at the moment is the ‘processes’, which has its own dedicated publication.

C-2015-1-Meijer-05

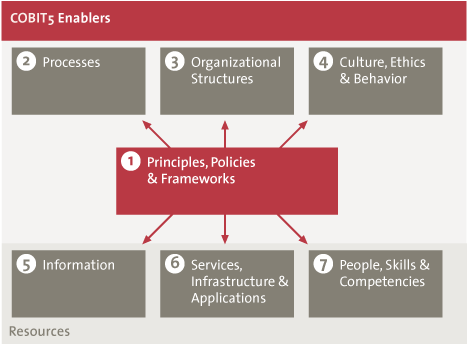
Figure 5. COBIT 5 Enablers ([ISAC12]).

Has COBIT 5 conquered the world?

In our experience, we have as yet seen little eagerness in organizations to move towards COBIT 5 and adopt the framework. We have come across organizations that have decided not to adopt COBIT 5 in the near future. Several organizations are tending to hold on to COBIT 4.1 and do not see the added value of changing their approach: with regard to their assurance approach or related to maturity assessments of IT processes. We see in particular that organizations have difficulty with the newly added concepts in COBIT 5. Existing COBIT 4.1 processes that have been further detailed out and have changed slightly are not the biggest issue here. Some of the new processes in COBIT 5 are very welcome and we have also seen organizations that are indeed undertaking efforts to establish the new governance processes. However, the capability model and the enablers seem to be too complex to implement directly. ‘Hybrid’ implementation is becoming more and more common: organizations want to use the COBIT 5 processes, but assess them according to the COBIT 4.1 maturity model. In all, the focus seems to remain on processes and their COBIT 4.1 maturity equivalent rather than on any of the new concepts introduced with COBIT 5.

Bartens, De Haes et al. ([Bart14]) also acknowledge the ‘challenging adoption of the framework’ and relate this to its perceived complexity. In their paper, they aim to facilitate its usage and adoption by means of information visualization. This is supported by a developed prototype such as the visualization tool. One can question, however, if a framework for IT and Business specialists that requires a piece of software based on scientific research will actually succeed with regard to adoption and implementation. COBIT 5 was very recently made available in an online version, but it is still too early to draw any conclusions on its acceptance and usage.

Perhaps it is also worth keeping in mind the fact that COBIT was originally developed by a large group of volunteers with a passion for IT and the governance of IT.

COBIT 5 has definitely brought us some additions and advances:

  • The capability model for a more objective assessment method.
  • Bringing together Enterprise Governance and IT Management could help bridge the gap between governance and IT, to further improve business and IT alignment. Senior Management of an organization could gain further insight in how IT needs to be directed and how it can add value to the business strategy.
  • Specific publications such as audit programs and guides for target groups.
  • Aligning and linking to different standards, frameworks and legislation improves the ‘one framework for all’ mindset.
  • The integration and alignment of COBIT, ValIT, and RiskIT.
  • A number of new concepts have been added, but have not yet been worked out in more detail (e.g., the stakeholder needs, the enablers such as organizational structures and culture). Its value is yet to be proven.

But we also see a number of downsides:

  • The former maturity model was easy to explain, understand and utilize, although the results of an assessment could contain some subjectivity. The current capability model might be academically more accurate, but it certainly lost some points in practical adoption.
  • With the step up to Enterprise Governance, the focus on IT Governance has decreased. The distance between Enterprise Governance of IT and IT Management might be too big to bridge without (aspects of) this layer in-between.
  • The additional publications were introduced a long time (up to a few years) after the initial release of COBIT 5, and momentum might have been lost as some have long been eagerly awaited and some still need to be issued.
  • The ‘enterprise-wide’ mindset has led to a theoretical and academic approach. The essential question here is: how practical (efficient and effective) is this option for ‘regular’ organizations? Of course, any user still should apply what is useful to a specific situation, but might need some guidance in how to select the COBIT elements.

When we consider the fast-moving IT world, we also wonder how practical the framework will be in newer environments and ways of working. IT is ever-changing and so are the requirements to govern and manage it. How valuable and flexible is COBIT – with all its metrics defined in the processes – for organizations fully committed to traveling the Agile road? How does DevOps fit into COBIT? Can COBIT in its current form be used in such environments as well? This sounds like an interesting challenge, which might very well not be a specific issue for COBIT itself, but a more fundamental aspect regarding the governance model required for these types of organizations. All IT departments and teams need governing and management, and it would be interesting to further investigate how new business and IT models and methodologies fit within the concepts of COBIT. The challenge for ISACA will be to see how its COBIT 5 framework can cooperate with other methodologies and existing frameworks, such as Lean, DevOps and Agile, and the extent to which COBIT 5 can assist in introducing governance, management and control into these situations.

COBIT 5: conclusions

In our view, ISACA might face some tough challenges in the (near) future. One aspect is the branding and marketing of COBIT 5, as the current framework no longer fits its name although this name is widely known and recognized. Another aspect might be that the framework has grown too complex, and ISACA may have overreached itself in its aim to cover all relevant elements. Bringing it back in line with its essentials and focusing on providing guidance to organizations to establish and improve their governance and management of IT by using COBIT and by using ‘business language’ would no doubt be a useful step forward. A third aspect might be to reinstate the maturity model. And a fourth might be to bring order and consistency to the flood of COBIT 5 documents. Our wish list also displays updated versions of the well-received Mapping Series, which were a great help in bridging the gap between COBIT and other more specific frameworks.

In our opinion, it is too early to conclude that COBIT 5 is a bridge too far. There is still hope of success because of all the good and useful things it can offer. COBIT is and remains a very valuable aid in the management and governance of IT. It is important not to merely follow and ‘implement’ the framework blindly, but to use common sense and experience to select those elements that are applicable to an organization or a specific situation, depending on the circumstances.

Although the bridge is far (but not too far), those that follow the right track and stay focused will cross that bridge one day and reach their objective(s), even if they encounter obstacles on their journey. It is important to realize that COBIT 5 is not a goal in itself but a means, and it will certainly provide a very substantial amount of help and assistance. It is also a very comfortable feeling to know that COBIT 5 is a stable and robust bridge and not just some light suspension bridge somewhere in a jungle. It is not a giant leap forward – it is more of an evolution than a revolution – but it allows organizations to take substantial steps towards better governance and management of IT.

As this article represents our view on COBIT 5, we thought it would be interesting to include the perspectives and insights of three subject-matter experts closely related to COBIT and ISACA. We have interviewed Marc Vael, Erik van Eeden and Steven De Haes.

KPMG has developed the IT Assessment Tool providing a structured approach that supports the maturity assessment of IT processes based on COBIT 4.1. It is fully aligned with the goals cascade through the Enterprise and IT Goals. By scoring 6 generic attributes per process, one can determine to what extent the enterprise goals are being met. Organizations are categorized by industry sector (43 in total) and country (64 in total), but also by annual turnover and IT budget. The tool consists of more than 1300 assessments. The COBIT maturity model together with the assessment database allows for interesting benchmarking possibilities. The maturity of the IT processes of organizations can be compared with that of their peers. This is something that adds value for and can be understood by (IT) Management.

C-2015-1-Meijer-06

Because of the challenges described in this article on the adoption of COBIT 5, the capability model of COBIT 5 and the trend of ‘hybrid’ use of COBIT (using the COBIT 4.1 maturity model of to assess the COBIT 5 processes), the tool is still based on the COBIT 4.1 framework.

References

[Bart14] Yannick Bartens, Steven de Haes, Linda Eggert, Leonard Heilig, Kim Maes, Frederik Schulte and Stefan Voß, A Visualization Approach for Reducing the Perceived Complexity of COBIT 5, in: Advancing the Impact of Design Science: Moving from Theory to Practice, M.C. Tremblay, D. VanderMeer, M. Rothenberger, A. Gupta, and V. Yoon, (eds.), Springer International Publishing, 2014, pp. 403-7.

[Bart15] Yannick Bartens, Steven de Haes, Yannick Lamoen, Frederik Schulte and Stefan Voß, On the Way to a Minimum Baseline in IT Governance: Using Expert Views for Selective Implementation of COBIT 5, proceedings of 48th Hawaii International Conference on System Sciences, 2015.

[Haes09] S. De Haes and W. Van Grembergen, Moving From IT Governance to Enterprise Governance of IT, ISACA Journal, Vol. 2009, No. 3, p. 21, 2009.

[ISAC12] ISACA, COBIT 5 – A Business Framework for the Governance and Management of Enterprise IT, 2012.

Interview with Marc Vael CISSP CISA CGEIT CRISC CISM

Interviewers: Dirk Bruyndonckx and Salvi Jansen

C-2015-1-Meijer-Vaes

Marc Vael is Chief Audit Executive at Smals, a Belgian not-for-profit IT company with 1,800 employees that implements IT solutions for Belgian Federal Social Security Institutions. He is responsible for all internal auditing activities reporting to the Audit committee. Marc has three Master’s Degrees (Applied Economics, Information Management and IT Management) and certifications in IT audit (CISA), information security (CISM, CISSP), IT risk management (CRISC), IT governance (CGEIT, ITIL service manager) and project management (Prince2). He achieved his official certification as Board Director at GUBERNA in 2012.

Marc has 22 years’ active experience and is passionate about evaluating, designing, implementing and monitoring solutions with regard to risk and information security management, continuity/disaster recovery, data protection/privacy, and IT Audit. He is a frequent speaker at international conferences and at meetings with boards of directors. Currently, Marc is also president of the ISACA Belgium chapter, associate professor at Antwerp Management School, Solvay Brussels School and TIAS, deputy member of the Flemish Privacy Commission, member of the Permanent Stakeholder Group of ENISA, and he is active as director on several boards.

Moving from COBIT 4.1 to COBIT 5, how has the framework evolved?

A first major novelty and strong point of the COBIT 5 framework is the focus on the strategic layer of the company, both at board level and executive committee level. By defining these different layers, the process of establishing who needs to take up which role on process controls in an organization becomes more transparent. The RACI matrices have improved, and are a transparent visual way of setting responsibilities.

Second, the seven enablers are an important point of reference, certainly for auditors: are these domains under control or not? But also for all managers: have we covered the basic components and/or have we viewed the topic from all seven angles before taking a decision? Two of the seven enablers are specifically hard to capture/audit: Culture, Ethics and Behavior and Competences & Skills. However, in reality, these are just as important as the other five, and this is correctly reflected in the framework.

How do you use COBIT 5?

COBIT 5 is a source of inspiration. As it comprises all relevant themes, it can be used as a checklist to see if all required elements are part of your audit. Some themes are addressed very clearly, such as innovation, whereas others are much more subtle, such as privacy, and are spread across the different elements of the framework.

When setting and maintaining the scope of an initiative based on COBIT, it is also very important to define which themes are explicitly out of scope. Otherwise, you run the risk of scope creep, and the audit program can become too extensive. Implementing COBIT as a whole is a frequently made mistake, it is unrealistic.

Work programs are meant as guidance, and I never copy them directly into an audit initiative. COBIT is an international framework and therefore a compromise, one should only take from it what is strictly needed. It should not be the only source of inspiration of the audit: other frameworks can provide additional insights.

A recommendation I always give is to select at least one process from the governance layer (EDM), one from the monitoring process (MEA), and one from each management process (APO, BAI, DSS). This forms an essential baseline for the audit.

Can COBIT 5 be used for new trends?

COBIT 5 can be introduced to make people reflect on certain topics, such as cloud computing, Bring Your Own Device or Internet of Things. It also helps users to remain in control when evaluating and implementing these initiatives. Difficulties arise when talking to people who are heavily involved in technical implementation. They find the wordings used in the framework too holistic, whereas management is able to connect instantly to the terminology.

I try to avoid introducing COBIT 5 as yet another framework on top of other frameworks such as ITIL, ISO, TOGAF and other methodologies. The content supersedes these specific methods: use it as a point of reference, white-label if necessary. Where ITIL, ISO and TOGAF might have taken too many topics in scope of their framework, COBIT 5 will refer explicitly to these more specific frameworks to avoid becoming too heavy. This is quite unique.

About which COBIT 5 concepts would you caution people?

The Capability Model to score the different enablers is downright depressing. Especially when coming from a Maturity Model, this method of evaluation can bring a score of 3 or 4 out of 5 down to just 1 out of 5. Even though the new scoring model is meant to improve the objectivity of the rating, it can be really hard to defend in front of anyone. There is no problem in using COBIT 5 with the scoring model of COBIT 4.1, certainly when a link with risk management has been established, and the maturity levels are coupled to risk scales within the company.

Second, the way each enabler of the framework is implemented tends to vary. For Services, Infrastructure & Applications, the work programs are about specific topics such as SharePoint and DB2, but for Culture, Ethics and Behavior the existing documentation is very limited. When addressing People, Skills and Competencies, the US model and EU model for competence rating differ, so people will have to choose when setting up their audit initiative.

Third, when your focus is on governing the IT function itself, instead of providing assurance over the Governance of Enterprise IT, you might still be better off using the COBIT 4.1 Assurance Guide instead of the COBIT 5 version. The focus has indeed shifted to the corporate governance aspects of IT.

Has COBIT 5 been able to make the link with general corporate governance considerations?

The corporate governance bodies in many organizations are still giving much attention to their usual topics of strategy, finance, marketing, HR, etc., where IT is still not on their agenda despite the innovative angle and added value, except in case of major IT investments or major IT issues. IT and therefore also COBIT are still at risk of remaining an immaterial topic for the board, even when their responsibilities are clearly set out within the framework.

There is an important link with the monitoring processes (EDM and MEA). Apart from the operational monitoring and reporting, there is a second line of reporting that should enable progressive insight in how the organization is doing, and of course improvement in the long term. The board could use this reporting to identify trends and define actions in its annual report.

COBIT can function as the bridge between the business and the IT environment in any organization, multinational or small.

Could adoption be increased by providing a ‘light’ version as was done for COBIT 4.1?

COBIT 4.1 indeed featured a COBIT Quick Start Guide. However, the requirements in each industry make it hard to scope down. Financial sector requirements are highly focused on compliance, requiring a large scope, whereas a governmental context today requires a focus on a ‘Lean’ approach.

COBIT 5 is no longer one publication, but multiple volumes addressing different themes and functions. It is ISACA’s duty to keep an overview and internal coherence of the publications, whereas the reader is encouraged to take from it what is essential to him. There is not one company that has fully implemented ITIL, ISO27001 or TOGAF, and this should not be an ambition for COBIT.

The complete COBIT offering is mostly known to auditors and trainers, whereas other professionals will select specific topics and use it as a checklist or benchmark. As the governance processes (EDM) gain traction, executive support will increase, we hope. Work programs have been published for these new processes, but we still need to work on bringing them to the market through hands-on cases.

How does the target audience evolve?

Whereas previous COBIT versions were targeted mainly at the audit function (the third line of defense), the COBIT 5 series also targets the second line of defense: the quality, risk, security and compliance functions. This is done either through specialized editions of COBIT, i.e., COBIT 5 for Assurance, COBIT 5 for Security, or by specific work programs around topics such as DevOps, Lean, privacy, etc.

For these functions, COBIT 5 might be a viable alternative to operational frameworks such as ITIL and ISO27001, which might become too technical for these profiles. At the same time, these oversight functions need a lot of operational information, in which COBIT 5 could help.

Pressure is building on auditors to give advice too, and experience teaches us that people from the field are in fact most suited to become an auditor on the same matter. I would advise firms to give operational people the possibility to take up an auditing role, while maintaining independence of course. Rotations could be performed at each strategic cycle, which is about 4 to 5 years. When returning to the business, these profiles are then able to reason with a controls perspective and provide deep insight into the subject matter. This practice is known to be performed even at executive committee level.

Finally, COBIT 5 truly attempts to provide useful information for executives and board members.

Any final considerations?

The IT environment has grown too big and is evolving too fast for any auditor to remain an expert in all IT elements. It pushes auditors and all other oversight functions to specialize in specific topics and collaborate with others in order to get a complete view of IT controls in an organization. COBIT 5 helps maintain an overview, add value, and reduce risk.

I would strongly advise people to use the COBIT 5 publications to inspire people within the organization on all sorts of IT-related topics during decision-making or assessment phases, without mentioning that you are using COBIT 5: focus on applying the COBIT 5 content.

Interview with Erik van Eeden MIM MBA RI

Interviewer: Pieter de Meijer

C-2015-1-Meijer-Eeden

Erik van Eeden joined the board of the ISACA Netherlands chapter in mid-2014. In his role as board member, he is responsible for the ISACA training program provided in the Netherlands. A large step has been taken in this area by the addition of the CRISC and CGEIT courses to the program. Other training courses currently on his wish list include the COBIT Implementation and COBIT Assessor program. Erik has been active in the IT sector, where he started his career at AkzoNobel among others, since 1982. After a number of years at Getronics he made a career switch in the year 2000, and has been active as an independent advisor and trainer ever since, with several non-profit roles added. Erik is above all an accredited COBIT 5 trainer. In addition, he lectures in the field of IT Management (ITIL v3, BiSL, ASL2), system development, testing, and the Scrum methodology.

What do you think of the COBIT 5 Framework?

An important development with COBIT 5 is that the framework and the assessment model have become more mature. There are now official COBIT 5 training courses available through APMG, where both the trainers and the institute providing the courses are required to be accredited. Everything is organized more strictly nowadays. You could say that it is remarkable that ISACA has not gone one step further as yet: why can’t you obtain a COBIT-certified title that can be compared with CISA and CISM? Currently, I would not be able to provide any numbers of COBIT professionals in the Netherlands.

In my opinion, the naming and the structure of the capability model for processes in COBIT 5 have become much stronger than they used to be. The capability model is definitely more objective and provides both the assessors and the organization with something to hold on to. The current model is also somewhat more rigid than the maturity model from COBIT 4.1, as one now needs to do a solid job even to get to level 1. In my experience, getting to a higher maturity level is sometimes challenging for Dutch organizations, as they seem to struggle with implementing roles, such as the ‘governing body’. They prefer to put an organization in place instead. However, this is an essential part of COBIT.

I can imagine that people who examine COBIT 5 for the first time find it overwhelming. I see a similarity with ITIL v3 here. The trick is to break things up into smaller pieces so that you can see how they fit in the bigger picture. Actually, this means that, without a training or special course, you will have difficulty with applying this. I see an increase in interest in COBIT 5 training from ITIL professionals, who regard this as a useful addition to their skill set. Besides these, the training group normally consists of both internal staff as well as external advisors and professionals. And, of course, there are several IT managers.

How do you value the adoption of COBIT in the Netherlands so far?

We have noted that, in the Netherlands, the adoption of COBIT 5 has lagged behind our expectations somewhat. A part of this can be explained by the fact that, with COBIT 5, we have headed in the direction of Governance of Enterprise IT, whereas the naming of the framework does not fit this focus. On the other hand, the name ‘COBIT’ is recognized by many a people from the past as the framework for control objectives, while that is no longer quite so clearly addressed. Actually, I think COBIT is in some sort of identity crisis.

At ISACA, we want to use the coming period to organize roundtables to further discuss and explain COBIT 5. Furthermore, I think it is ridiculous that our own ‘C-professionals’ [meaning the ISACA members holding a certification – ed.], have so little knowledge of COBIT 5 at present. I don’t think this is a typical Dutch problem, as we see that adoption is also slow outside our country.

Another cause is that the term ‘Governance’ is a vague concept for many aspects. That also contributed to the fact that the development of COBIT 5 took much time and effort. I always stress the fact that IT Governance cannot exist without the business. Furthermore: Governance can never be a goal in itself, but is always a means to lead the company better.

Fortunately, I also see examples of organizations that have properly embedded IT Governance in real-life practice. Achmea is a good example of this, with a well-organized governing body that steers and directs the IT department. I once raised the question: “Don’t you feel uncomfortable with someone looking over your shoulder?” The simple answer was: “I’ve been accustomed to this from the start.” This means that the culture of the organization plays an important role here as well.

Hasn’t COBIT 5 grown too big?

I would like to make the comparison with ITIL version 3. After its release, there was a similar response. What you then saw was that the ISM method was developed under the leadership of Jan van Bon. In fact, this is an ‘ITIL Light’ and was based on version 2 of ITIL in a more practical manner. Maybe COBIT 5 requires something similar? ISACA has an article describing a minimum of processes, a sort of COBIT 5 Light.

And a next step? In my view, COBIT 6 will only surface when more organizations actually improve their governance. Then the other ‘enablers’, such as culture, will receive more attention, rather than IT processes exclusively.

I think that ISACA must keep on exploring its own limitations, with a special emphasis on collecting existing best practices and incorporating them in the approach. COBIT 5 has already built upon various frameworks and all these models help the user achieve a higher level with his organization. For example, the ISO standard helps assessment in an objective way.

What I personally would like to see added to COBIT is the topic of ‘testing’. It would be interesting to link the level and extent of the test approach of IT Products to its added value to the enterprise goals.

All in all, I think COBIT is a very powerful tool. Our challenge lies especially in communicating it to a wider audience!

About ISACA

ISACA was founded in 1967 by professionals described as those “auditing controls in the computer systems that were becoming increasingly critical to the operations of their organizations”, and later transformed into the Information Systems Audit and Control Association. Nowadays simply known as ISACA, it has over 115,000 members in the broad range of IT, spread over 180 countries.

Next to the development, improvement and maintenance of COBIT, the organization provides a number of valued certifications, including CISA, CISM, CRISC and CGEIT.

Events, research and education are organized through local chapters, among other means, ensuring an annual revenue of well over 40 million dollars in conjunction with membership fees.

http://www.isaca.org/

Interview with Steven De Haes PhD

Interviewer: Dirk Bruyndonckx

C-2015-1-Meijer-Haes

Steven De Haes PhD is Associate Professor Information Systems Management at the University of Antwerp – Faculty of Applied Economics and at the Antwerp Management School. He is actively engaged in teaching and applied research in the domains of Digital Strategies, IT Governance & Management, IT Strategy & Alignment, IT Value & Performance Management, IT Assurance & Audit and Information Risk & Security. He is alumnus of the International Teacher’s Program (Kellogg School of Management) and teaches at bachelor, master and executive level. He also acts as Academic Director for the Executive Master of IT Governance & Assurance, the Executive Master of Enterprise IT Architecture, the Executive Master of IT Management and the (full-time pre-experience) Master in Management.  

He held positions of Director of Research and Associate Dean Master Programs for the Antwerp Management School. He also acts as speaker and facilitator in academic and professional conferences and coaches organizations in their digital strategies, IT governance, alignment, value and audit/assurance efforts. He is involved in the development of the international IT governance framework COBIT as researcher and co-author.

How do you look back on COBIT 5, three years after its release? And how do you look forward?

When we talk about COBIT, we are talking about the professional field of IT Governance, i.e., the control and management of technology. If you look at the past 10 years, and certainly before the release COBIT 5, the IT governance discussion was all too often a debate for and by IT professionals. This was the case in the academic world as well as in the business world. If you entered into a discussion about IT Governance, you were quickly sent to the IT department and the CIO, especially if you spoke with business people. IT Governance was regarded as a matter far removed from their activities. In the world of science there was a strong conviction that the concept of IT Governance needed to be taken out of IT’s own little corner. Today we speak of the Enterprise Governance of IT in both the scientific world and common business practice. Now the business has pride of place. This has resulted from the changed point-of-view that, within a highly digitized enterprise, the responsibility over IT has become an integral part of the responsibility of the business. This is no more than logical, in view of the fact that the business itself has been digitized and automated to a large extent. The processes are digitized, the company has been digitized, the revenue model is based on technology etc., so the business must assume its responsibilities and can no longer just delegate that responsibility to IT. This evolution has been very strongly extended and stretched in COBIT 5.

What about IT Governance itself, because that seems to have disappeared from the map, although many people are still using the term? The current distance between Enterprise Governance of IT and IT itself is too big. Does IT need ‘something’ to govern itself and to bridge the distance between the two?

COBIT 5 has built a complex layer placed on top of the IT Management processes, and this complex layer – the Enterprise Governance of IT layer – is about involvement in and steering of the IT function by the business. But if we look at many organizations, the entire structure starts with a minimum maturity of the IT organization itself. If we do not have that minimum maturity, it is an illusion to think that IT will be capable of talking to the business. Business people complain all too often that even that minimum maturity is not present: IT is too slow, there are complaints about helpfulness, the IT Helpdesk is not working properly etc. These complaints are very operational because that is what people experience every day, and they actually have very little to do with the discussion on Enterprise Governance of IT. But it is essential for the broader discussion that these kinds of basic processes are working at a reasonably mature level. It is important to note that these basic processes are still provided by COBIT, but it does have that extra layer placed on top.

In its early days and until recently COBIT was – and probably still is – mainly seen as something that could be used by IT. In COBIT 5, however, the link with the business and business management is very prominent in certain processes. It is often very difficult for the CIO to enter into discussions with the business. He gets a framework that says he has to talk to the business on areas such as portfolio management, investment analysis, business impact analysis, etc., but the party is often deaf to what he says or does not understand him as he seems to use a different language.

COBIT 5, however, phrases this completely correctly. If we want to construct the bridge from IT to the business and if we want to create value from IT, the business people should occupy the IT driving seat, setting out the direction for the CIO. But this is not a situation we come across very often. In practice, there is still a big barrier to overcome: how do we get the business people around the table to take up this debate in a constructive way. Most of all, this requires IT to be properly organized and to be doing a good job. And by extension on the other side: the Board of Directors must be part of this story as well. This top-down commitment is very important – but often lacking.

Structural improvements in the governance and management of IT are seen especially in those companies where the CEO believes very strongly in this story and imposes this belief from the top: the business gives direction to IT. This cannot happen in only a few months and may even take several years, but the tone at the top of the business is very important in this matter. Of course, if the incident-management process and the functioning of the Help Desk are not working well, then obviously you can hardly expect from the business that it will steer what is regarded as IT commodity.

Governance responsibilities are matters that need to originate from the Board of Directors and Executive Committee – top down – and COBIT also defines it this way: “Enterprise Governance of IT is the responsibility of the highest governing bodies.” This raises the big problem that only too often there is inadequate and/or insufficient awareness to take up this role appropriately. Despite the fact that companies have been digitized and automated to a large extent (and this ranges from banks to hospitals), we see that the appropriate knowledge of digitization and automation is often insufficient at top level.

We have obviously encountered all kinds of IT Management processes in our various duties in the past, but the surrounding framework – the former IT Governance – is still required before you can rise to the Enterprise Governance of IT level. You can hardly expect from the Board of Directors or from the Executive Committee that they will assist in setting up processes, but they should be aware of the contribution of IT to the creation of business value.

Let us take portfolio management as an example. Portfolio management is about prioritizing business investments, usually with an IT component. In essence this deals with transformations: the improvement of business processes that ultimately also make use of technology. But it is up to the business to prioritize the investment portfolio, based on its financial value drivers such as ROI, IRR, etc. IT is essentially not involved in this. IT is not the owner of these budgets, these budgets are the property of the business. It can even be called an aberration that the portfolio management process is organized by IT, because this is fundamentally a completely wrong setup.

In practice, however, it almost always happens this way and, in large and important improvement and transformation projects, it will very often be senior IT staff that need to pull the business people onboard. The business will almost never do this spontaneously by itself. And if it does, it often occurs in companies where the current CEO previously performed a CIO role, and thus has an affinity with IT and is ‘IT-savvy’. But if that is not the case, then the CIO and senior IT people should use proper, comprehensible language to try to haul the business people onboard in the hope that they will gradually become the owner of the portfolio management process, as it also ultimately concerns their own budgets. IT should actually have no budget of its own for projects, but solely for IT commodity affairs.

COBIT 5 is also trying to appeal to different target groups, especially the business world. This is a big change compared to the past.

COBIT has extended its target audience to include business people, because these should take control of IT. This is a big challenge for ISACA, because this new target is not the natural target of ISACA and COBIT, as established over the past 20years. ISACA must also learn to speak the language of this new audience in its framework.

Perhaps this exercise should start from listening to the business and its problems and challenges with IT rather than from starting with COBIT as such. If the business wants to realize and achieve all this in order to assume its new role, it will need to organize itself. Fortunately there is something that can help it do this: COBIT. The point is to present the issues in an easily understandable language and transparent manner for the business. Speaking the same language is imperative if one wants to get this new audience onboard and to realize alignment between business and IT. Throwing the COBIT books onto the CEO’s table is most likely not the correct method.

Mature IT organizations are important, but COBIT 5 no longer uses maturity, now preferring capability. This has already provoked quite a few discussions. In practice, there is little understanding of why ISACA took this decision. Everyone reaches back to COBIT 4.1 maturity, with its comprehensible scale of 1 to 5, where most companies would not even reach a capability level of one in COBIT 5.

Much ink has indeed already been spilled on this topic. It is very unfortunate that maturity, as such, has disappeared because maturity is a perfect management tool for internal improvement. It is easy to use, reproducible, etc. Maturity was easy to understand and to comprehend, but the concept was perhaps not always robust enough. For improvement projects, it was a perfect tool, especially for IT Management.

A strong feature of the Process Assessment Model (PAM) is that it is a much more robust model to assess processes. It also uses a scale from 0 to 5, but under much stricter ‘rules’ than the maturity assessment. This makes PAM extremely suitable for conducting very thorough and detailed process audits. It does contain the risk, however, that most processes would not even reach a capability level of 1. Capability improvement projects are much harder to realize, and generally consume a lot more resources and time.

There is a strong yearning to return to the maturity model, especially in the management world. This should indeed be reinstated, and a way must be found to enable both to exist side by side. The capability model clearly has its benefits for the world of audit, external assurance and other accreditations because it is a reasonably robust method. But for management, maturity measurements are essential. ISACA should therefore again include the maturity model in the COBIT framework. Actually, the 4.1 model – including Val IT – is still widely used (the generic attributes, process attributes. etc.) and it is mainly for the new COBIT 5 processes that extensions should be drafted at the process level. Actually PAM and capability are not new concepts to COBIT 5, as they already existed in COBIT 4.1, besides the inherent maturity scale. We must definitely abandon the idea that maturity is not good, while the market is not even asking for capability. You may not end up comparing the two, because it would be comparing apples and oranges. Of course they both have a scale of 0 to 5, which could easily lead to confusion.

In the better known Capability Maturity Model (CMM-I) of the SEI (Software Engineering Institute) both scales – capability and maturity – co-exist but here, too, the concept of capability is totally different from the one in COBIT 5. With CMM-I there is an official process to get certified – which in itself is not an easy task – and there is a great distinction with COBIT 5 and PAM whereby levels are not attributed at the level of individual processes as discussed here, but to coherent sets of processes. Same story, totally different thing.

I think that ISACA nurtured a plan to certify organizations in a way similar to the issue of an ISO 15504 certificate, and that this necessitated a robust assessment method such as PAM. Maturity, AS IS and TO BE have much value for the internal organization, but are less suited to the outside world as the level of interpretation is greater than those with the more objective capability, making the latter a better tool for external reporting. However, COBIT is mainly used and designated for internal use and the improvement of the IT organization. During recent discussions within the COBIT Growth Task Force, one of the recommendations was indeed to integrate the maturity model within COBIT once again.

Is COBIT, as an acronym, the correct name if you want to involve and reach a different kind of audience?

Here you have to give a nuanced answer. The name of COBIT is strong, especially in the world of IT Audit, Assurance, IT professionals, etc. But it remains new to many people, even within IT. ISACA thinks COBIT is better known than reality actually shows. As long as business people think that it is something to do with IT, it will not gain ground with them. The term ‘digital’, however, does work. In short, a different language is required for COBIT to enter the world of business people.

ISACA should also change the name COBIT?

The name has its advantages and disadvantages. The term ‘COBIT implementation’ does not sound good to me. I think that one cannot implement COBIT as such. COBIT is a very good book with many suggestions, but is generic by definition. You have to take out the things that are interesting and useful for your organization, and you should then also translate these into the organization’s specific context. You can implement and improve governance and management processes, but you cannot implement COBIT. You can think long and hard about how you are going to tackle this, or you can be inspired by a book that has been there for 20 years covering this issue. It contains some very useful suggestions. COBIT is just a tool, and is not perfect, but very usable. Ultimately it is not about COBIT, but about better processes and structures.

If you look at the current and new slogans and hypes like Scrum, Lean, social media, DevOps, Big Data etc., to what extent is COBIT 5 more or less suited to accommodate these?

Management of technology is about the management of processes and structures. Whether you look at social media or the Cloud or Big Data, it should actually make no difference. COBIT is about management content that should be applied in a permanent and sustainable way.

And whether we have another technology next year and the following year another hype, that is of lesser importance. But you do have to have structures and processes in the organizational management that look at that technology and also ask what that technology can do for the company. Only then should you decide whether or not to jump on the wagon. To COBIT, it should make no difference. Scrum is a type of example different from the social media because Scrum is more of a development method that is close to the business. It works in an iterative way, which could prove valuable in today’s Agile and proactive business environments. Scrum fits well within COBIT because Scrum is actually full of management controls and management structures. You can also look at it with other methodologies and frameworks, but I think the COBIT model covers best the responsibilities of the IT, and also provides the most widespread coverage. I still have to come across another model that is so broad. There is simply nothing else on that level.

Then we come to the next question, COBIT 5 enablers and drivers …?

That’s where I think the evolution of COBIT 6 lies. The enablers model in itself is very good, but they have made it a little too complex. The process enabler is the most important one. You have 37 processes in COBIT 5, and also my own research shows that the processes are not only the most difficult but also the most important in the design of the organization. If we look at successful cases, these are typically cases where they have a good process-based approach to portfolio management, strategy etc. The structures are a second key enabler. But we do not have much on structures in COBIT 5. To me, COBIT should be able to provide generic advice on, for example, an IT Steering Committee or the job description of a CIO, and so on. If we managed to put in COBIT 5 generic enterprise goals and IT goals that are very intuitive for many companies, we could also make a generic CIO job description. There is both a big need for, and a big interest in, things like this. We have also a major need for guidance on the soft side of IT Governance (skills, expertise, awareness) and how to deal with it.

In any case, the process enabler is well developed. There is also something about the information enabler but, to my knowledge, that is little used, and the others have not yet been developed. What I think COBIT 6 should be – and that will not be tomorrow – is that it should not evolve into 37 processes, but into 37 areas of responsibility. Much of the information required for this (e.g., process, practices, activities, etc.) already exists, but should be developed in such a way that it can be used in a very practical way (e.g., the use of the enablers). In short, COBIT 6 should be a simplification around 37 areas of process description, structural description and a description of other relevant elements.

I believe very strongly that there will be a COBIT 6 within a few years. Now the processes are already well developed, and I think that the practice also calls for a concrete manifestation of the other enablers. There is already a lot of material: the 7 enablers have been developed for Assurance, Information Security and Risk but, at some point, you are going to have to aggregate all of this in a generic knowledge base. Then it should be possible to filter all of that information, depending upon your needs. This has actually been done in specific publications, but you really have to go searching and puzzling to muster all the relevant information. So it is not really user-friendly, hence the need for simplification. Now, if you want to prepare yourself, you must look into the generic process guide and you should also consult other books and publications. Sometimes these even contradict each other to a certain extent. There should be a simple model of 37 areas of responsibility and, for each of those areas, you require a structure and processes. In my opinion, that’s the way to go.

How do you see the acceptance and use of COBIT in Belgium? And subsequently: are the IT auditors following the path of COBIT 5 or do they keep hanging on to COBIT 4.1 for good reasons?

I think it depends on the audience. When I look at the audit, risk and compliance assurance audience, it is actually very widespread. If I look at the business community, which I think is a very important community for the further development around alignment and value creation in IT, the spread is extremely low. When I teach business people, such as financial managers, operations managers, marketing managers, it is very much unknown. A third audience is IT management; there it is still not as widespread as I would expect. In the Belgian market, things such as ITIL and Prince2 are very well known and used, and often one has notions of COBIT, but the actual use of COBIT in their organization is not so ubiquitous. There is much potential for growth because simply no other framework offers such a wide coverage at that level. And that is not a value judgment of the other frameworks, on the contrary. COBIT is not too selfish to refer to other methodologies and that’s just one of its particular merits.

A final word to conclude our conversation?

COBIT has some limitations, you should use it with a critical mind, it is not perfect but it is very useful. I try, from my academic basis, to introduce COBIT more and more into the academic world, which is good for the acceptance of the framework. Do not misunderstand me, I do not organize COBIT courses. I use COBIT very often, but I start from concepts around business strategies, IT strategies and others from within the academic world, and only then do I refer to COBIT as a tool and I explain how it works. It makes no sense to give a purely theoretical presentation of COBIT, the most important aspect is the idea itself and the concept behind it.

Data analytics applied in the tax practice

The world of indirect taxes is rapidly changing. Advancing technology and increasing dependence on ERP systems for indirect tax processes require new skills from indirect tax professionals in order to meet the increasing focus of external stakeholders on taxation and tax risks. With help of data analytics, complex ERP landscape and indirect tax processes can be unraveled. Anomalies in data can be signaled in good time and efficiently followed up, resulting in increased control of the end-to-end indirect tax process. Moreover, increased control data analysis can unlock additional tax value within the data that can serve as a basis for business improvements in indirect tax processes and tax supply chains.

Introduction

Data analytics is not new. Data analytics methodologies have been evolving since the first type of data analytics activities – known as “Analytics 1.0” – appeared in the mid-1950s ([Dave13]). Since then, the application of data analytics has expanded considerably, and supporting tools have become more and more sophisticated. Particularly in the finance, logistics and scientific area, data analytics has grown rapidly since the typical skillset of people working in those areas (e.g., an analytical mindset) has incorporated the required capability to work with large volumes of different sets of data. In the world of tax, however, the application of data analytics as part of day-to-day tax advisory work is relatively new. It only started approximately 5 years ago with straightforward analysis to check VAT return filings with regard to completeness. MS Excel is still the most commonly used technology with an analytical character that tax people apply in their regular work. One of the reasons why the application of data analytics in the area of tax has grown rapidly the last 2 years is the tighter collaboration between tax people and people with an analytical background. The combination of both worlds (tax and IT) is a critical factor in the successful application of data analytics in the area of tax.

In this article we start by giving a short introduction outlining the typical characteristics of transactional taxes. Then we elaborate on the way large organizations manage, via their ERP systems, their tax application for large volumes of data, with the aim of preventing errors. Data analytics / detective monitoring plays an important role in managing indirect tax compliance – which is elucidated in the next section. Then we explain that analysis of large volumes of transactional data can reveal other non-tax insights, all of which come from the same data source. As a case study, we explain how KPMG’s global VAT data analytics solution – Tax Intelligence Solution (TIS) – is a good facilitator for managing tax compliance and opportunities via data analytics. We conclude this article with our vision on how data analysis can contribute to the application of “Horizontal Monitoring”, a concept that has been adopted by many Dutch organizations in accordance with the tax authorities in the Netherlands.

Transactional taxes in a nutshell

To enterprises, there is a big difference between managing direct taxes such as corporate income tax, and indirect taxes such as VAT/GST, customs duties and excise duties. The biggest difference is that, for indirect taxes, every single transaction (both sales and purchases) and many activities (such as transportation) require an assessment; these activities have their own individual tax treatment.

For corporate income tax, it is basically irrelevant where the customer is resident, which product he is buying, where the product is shipped from, and which incoterm was agreed upon. For indirect taxes, these elements are crucial to the question as to whether or not the transaction is subject to tax and, if so, at which rate and sometimes under which jurisdiction, etcetera.

Another big difference between direct and indirect taxes is the fact that, in most countries, the indirect tax returns are not or almost never audited by the tax authorities when submitted by the taxpayer. Only after an audit has been executed, which may take place years later, the taxpayer will have certainty about the tax returns he has submitted.

It is a simple conclusion that many transactions make it hard for (large) companies to manage their indirect tax processes. It becomes even more difficult for these companies if they are registered for indirect tax in different countries, in combination with a complex supply chain.

Example

A mid-sized Dutch company purchases goods from inside and outside the EU. Its customers are resident in many EU countries. To be able to supply these customers, the Dutch company has warehouses with stock in five countries outside the Netherlands. Under the assumption that there are no permanent establishments in the other countries, the Dutch company should submit one corporate income tax return, many months after the fiscal year has ended.

On the other hand, it is realistic to state that the company should submit at least 24 VAT returns, 24 EC sales lists and 72 Intrastat returns in 6 countries. The number of import declarations depends on the facts, but will be at least 12 (and can add up to hundreds). On top of this, the company has just one or a few weeks on average before these returns and declarations must be submitted.

Apart from the number of returns and declarations, every single transaction has its own local tax treatment; the rates differ (from 0% to 27%), and in some countries the reverse charge rule is applicable.

Automation is necessary to be able to manage this complex process.

Tax processing in ERP systems (end-to-end process)

As a typical transaction-driven tax, VAT may be applicable on every single incoming or outgoing invoice. And not only invoices but also accruals, journals or other kinds of financial postings may be relevant from an indirect tax perspective. Present-day ERP systems support local and global businesses in their administration of logistic, production and financial processes and – more importantly – ensure that these processes are mutually connected in order to facilitate end-to-end business processes. From a VAT perspective, the process in the ERP system ends with a VAT returns report (see Figure 1).

In most cases, it is simply a matter of running a standard report that summarizes the totals (baseline amount and VAT amount) per configured and actually used tax code.

Running a standard VAT returns report in an ERP system is a financial activity for which the tax code forms the basis. Besides the tax code, there is a limited amount of further information available to provide detailed information on the underlying transaction that was the initial trigger for the invoice. In order to assess the accuracy of the accounted tax code, more information – from different process angles – is needed to make an appropriate analysis. Hence, the VAT reporting activity typically does not belong to an area where sophisticated detective (data analysis) checks can be performed.

Before we further zoom in on the need for data analysis in the Accounts Payable (AP) and Accounts Receivable (AR) areas, it is important to explain the different natures of tax code determination between AP and AR.

C-2015-1-Loo-01-klein

Figure 1. End-to-end VAT processes in ERP systems. [Click on the image for a larger image]

In the AR area, where invoices are typically created via sales orders and outbound deliveries, the most common ERP systems (such as SAP, Oracle) have functionality (“VAT logic”) in place to automatically derive tax codes for each outgoing sales invoice item. This should be an automated control for which companies have to enrich out-of-the box standard VAT logic with business specific VAT intelligence. There is no single ERP system on the market that automatically supports out-of-the-box VAT determination across all kinds of industries. Therefore, as we discussed in an earlier publication ([Bigg08]), it is of vital importance that VAT experts and IT experts collaborate closely during the design and implementation of the VAT logic in the ERP system. Once implemented and tested successfully, a solid governance process around the VAT process should ensure that internal (business) and external (law) changes are picked up and processed in a controlled way. Next to the implemented VAT logic – the core ERP tax determination – sufficient VAT application controls should also be implemented to make sure that the VAT logic is the single source of VAT determination. A good example of a VAT application control is the ERP configuration setting that stipulates that ERP-determined tax codes cannot be overridden manually. If such controls are missing, or cannot be relied upon due to weak IT general controls (e.g. IT change management process), the VAT logic, which is system-driven, cannot ensure that the tax code decision is made by the ERP system in all cases.

In the AP area – generally speaking – no automated tax code determination is in place as part of out-of-the-box ERP implementations. Suppliers who issue invoices to companies are (manually or automatically) processed within the AP department where AP clerks have to read the invoice and the tax consequences mentioned on the invoice in order to manually pick out an appropriated tax code that matches the tax application on the actual invoice. One may understand that it requires basic knowledge of the different country-specific VAT systems and jurisdictions in order to identify the correct tax cod e. Furthermore, the VAT rules and percentages change from time to time, which means that AP clerks need to be trained on the latest VAT derivation rules on a regular basis. What we often see in the market for these kinds of manual processes, is that VAT departments design VAT derivation manuals that include VAT decision trees. These decision trees ultimately lead to a tax code that AP clerks need to select from the overall list of available tax codes. One can imagine that this is an error-sensitive activity, since the number of tax codes from which the AP clerk can choose easily exceeds 100 or sometimes even 500. In addition to this, companies that have implemented financial shared service centers (SSC) have defined hard KPIs partly by the total number of invoices that employees need to process on a daily basis. As the work has a strongly repetitive character, a wrong tax code is easily picked. Furthermore, few preventative (system-based) controls are in place to prevent mistakes. All these typical characteristics of the AP process at large organizations give rise to the need for detective VAT quality controls, such as data analytics.

All these transactional processes and processed data rely heavily on the timely availability and accuracy of master data. Generally speaking, the key master data components that are mostly relevant from a VAT perspective are suppliers, customers and products. Accurate and complete VAT-relevant information needs to be captured for each of those master data components. A basic example of a critical VAT-relevant customer master data field is the country where the customer resides. The existing output VAT logic that drives the tax-code decisions uses the country where the customer is established in almost all cases. It may be evident, but in cases where the customer country in the master data is not a reliable field, how can the accuracy of the tax code decision be guaranteed? The answer is simple: it cannot be guaranteed. Almost all organizations that have implemented ERP systems and are exposed to 100,000+ elements of master data face the challenge to have a solid master data process in place containing sufficient checkpoints to ensure that master data are stored in such a way that they reflect the actual situation.

Another aspect – next to correct master data – that needs to be taken into account in order to rely on the automated VAT determination is to ensure that the actual master data (and thus actual transaction) are always used to calculate the tax code. In other words, how do we know that the tax code decision is based on the correct business flow parameters?

An example: an employee enters a sales order, delivers the goods and creates the invoice. Suppose that the real transaction is a delivery from the Netherlands (country of the warehouse) to Germany (country of the delivery address). Ideally, the ERP system should pick out both countries from the master data in the system. However, if the VAT logic is configured in such a way that the country to which the goods are shipped is derived from the country to which the invoice is sent, a wrong goods flow may be used as the underlying information to calculate the tax code. Another example of incorrect VAT data being used to pick out the tax code is when employees have the possibility to manually enter a (delivery or administrative) country that will be picked out by the VAT logic to derive a tax code. In this case, the actual transaction data (from the master data) are ignored by the VAT calculation mechanism, with a potential risk of inaccurate tax codes.

What makes the end-to-end process even more complex is that the VAT-relevant information that should feed the VAT decisions is widely distributed across different modules in the ERP system.

C-2015-1-Loo-02

Figure 2. VAT is scattered through different areas in the ERP system.

Accurate VAT decisions can only be made by a combination of master data, logistics, procurement and financial information. Besides challenges to automate VAT decisions, it is not easy to perform retrospective analysis to test the effectiveness of the VAT controls, VAT logic and manual VAT decisions. Further on in this article, we explain how these challenges can be overcome by applying what we call ‘sophisticated VAT cubing techniques’ to extracted transactional and master data.

VAT monitoring through data analytics

Tax authorities, supervisors, financial investors and other stakeholders are increasingly focused on taxation and tax risks, and expect companies to be in control of the main tax risks. For a company to be in control of its main tax risks means that it must be aware of the main risks it is running. A Tax Control Framework (TCF) – a fiscal risk-and-controls monitoring mechanism that is part of the Business Control Framework – consists of policies/guidelines, a clear overview of tax responsibilities and accountabilities, internal tax procedures/processes and controls (both hard and soft controls), among other things. A proper implementation of a TCF within a company’s daily tax processing system can reduce fiscal errors, spot fiscal opportunities in good time, and increase the quality of correct fiscal returns.

Part of an implementation of a fiscal risk-and-controls monitoring mechanism such as a TCF contains a periodic assessment of the quality of the monitoring mechanism. Whereas assessments were previously undertaken manually and relied on subjective opinions by fiscal expert testing – focusing on the existence of documentation, processes and testing manual controls – we now see that the internal and external stakeholders’ assessment focus is shifting to an increasingly automated approach consisting of the testing of IT-dependent/IT-application controls and (substantial) transactional data testing using advanced tax data analytics. This shift is mainly due to increasingly complex tax supply chains and increasing reliance on ERP-sourced information for tax processing.

Concretizing to VAT – although this also holds true for other transactional taxes – application controls are in place to ensure that automatic VAT derivation supported by sophisticated logic implemented in the ERP system on sales/purchase invoices cannot be disrupted. Examples of VAT application controls are:

  • Every sales invoice contains a tax code.
  • Tax codes on sales invoices cannot be manually overridden.
  • Only authorized users are allowed to create/change tax codes and tax parameters in the ERP system.

The effectiveness of application and authorization controls – combined with effective IT General Controls – only gives partial assurance of the correctness and completeness of input and output VAT activity with regard to transactional data. An efficient and effective way of achieving this objective is to make use of sophisticated VAT data analytics. These targeted analytics test the transactional data against VAT/legal requirements, and can be used to assess transactional data on risk areas (e.g., focusing on underpayment of output VAT, claiming too much input VAT), opportunity areas (e.g., focusing on overpayment of output VAT, input VAT recovery, input VAT accruals) and VAT working capital benefits.

C-2015-1-Loo-t01

Table 1. Examples of VAT data analytics (including an example control objective).

An initial assessment of the outcomes of the analytics results in potential false positives (transactions that are incorrectly selected as output from the analytics and do not add up to the VAT risk/opportunity) that need to be removed. Once the VAT data analytics have been optimized for purpose, they can be considered as efficient and effective assessment instruments.

One of the current challenges tax managers face is to define the right mixture of manual controls, VAT (application) controls and VAT data analytics. Reporting requirements and increased control from tax authorities, lack of time/resources, increasingly complex and globalized supply chains in combination with increasing IT dependence are factors that enforce a company’s need of a VAT-monitoring mechanism.

Other tax and non-tax value from data analytics

We mentioned that VAT-relevant information is widely distributed throughout different areas of ERP systems, and that all incoming and outgoing invoices are – in some way – relevant from a VAT perspective. When data analytics is applied to analyze the quality of the VAT process, the same data contain much more insights than the VAT process when you only look at it from an indirect tax perspective. One can think of other taxes that have a strong transactional character, such as transfer pricing or customs duties and excise. Of course, in order to analyze data from the perspective of these kinds of taxes, you need to enrich the transactional data with additional information that is needed to perform checks that make sense. TARIC code information or insurance costs per transaction form typical supplementary information from a customs and duties perspective. When the VAT cubes are enriched with this information, a (tax) data analyst can perform analytical tests on the same data for different types of taxes. This avoids the need for multiple data extracts and multiple tools that use different data sources for the data extracts.

C-2015-1-Loo-03

Figure 3. A solution covering indirect tax, direct tax and non-tax analytics.

From a transfer-pricing perspective, the VAT transactional data cubes can be used to analyze intercompany margins/deviations per product (groups), goods flows and periods and suchlike. From practical experience, we see that interesting insights can be unlocked from these kinds of analyses. This transforms the traditional style of intercompany pricing analysis, which is a typical Excel-based exercise in most cases, to a real data-driven approach where dozens of transactional data flows form the basis of the analysis. Furthermore, the data do not lie. They form the source of financial reporting and are an important starting point for intercompany transfer-pricing analysis.

Besides taxes, it is also possible to look at the same data set from a non-tax angle. One can think of procurement, audit, working capital or general process improvement / operational excellence.

Example analytics in the non-tax area are:

  • Possible duplicate invoices
  • Low-value AP invoices
  • Segregation of duties
  • Invoices without a purchase order
  • Early payments to suppliers

The strength of the combination of tax and non-tax analytics on the same data set lies in the fact that different departments in the same organization can leverage from a single investment in the area of data analytics solutions. This increases the chance of adoption of a(n) – initially intended – VAT data analytics tool. For IT departments that are a key enabler when it comes to an actual implementation of a VAT data analytics tool, it is easier to support and invest in new technologies because departments other than only the tax departments will benefit from the data analytics solution.

Case study: “Tax Intelligence Solution”

KPMG and Meijburg & Co have developed an indirect tax data analytics suite called “Tax Intelligence Solution (TIS)”, enabling clients as well as KPMG indirect tax professionals to:

  • Obtain fact-based insights to identify regularities.
  • Highlight opportunities to improve the efficiency, effectiveness and harmonization in business operations and financial processes.
  • Identify both tax and non-tax value adds such as missed KPIs for a business-outsourcing provider.
  • Accelerate input tax credits and improve working capital.
  • Optimize supply chain from a tax perspective in order to eliminate refund claims in jurisdictions where refunds are difficult/ailing.
  • Identify root causes of issues such as: who in the organization overruled standard systems tax logic and on which transactions?
  • Offer supplier discounts through the prompt processing of transactions and payments.

C-2015-1-Loo-04

Figure 4. TIS: a global indirect tax data analytics solution.

Tax Intelligence Solution – How does it work?

C-2015-1-Loo-05

Figure 5. Tax Intelligence Solution: how does it work?

Phase 1: Data extraction

TIS makes use of raw data that reside in a company’s ERP system. As tax determinant data points are scattered throughout most ERP-system data, a thorough understanding of database modeling and query techniques are necessary to derive tax analytical value from the data. In addition, basic reports in ERP systems only provide a single view on the data – e.g., accounting, logistics – which results in limited information being available to end-users to perform data analytics. TIS offers standard data extraction utilities for the most common ERP systems to automatically download all the tax-relevant raw data – accounting, logistic, master data and customizing – with minimum effort actually being required from the client’s IT resources.

Phase 2: Data cubing

After data extraction, raw data need to be staged and loaded onto a server platform for transformation purposes. Within this platform, the raw data tables will be combined to form so-called ‘tax cubes’ respecting the database relational model of the underlying ERP system. On average, 20-30 raw data tables will be used to produce a single tax cube. Besides data modeling, the enrichment of data takes place at this stage: intelligent fields are added to the data cube to enable the performance of smart analytics at a later stage in the process. Data cubes exist for different parts of the indirect tax processes (e.g., AR, AP, tax reporting) and can also be combined and stacked for cross-cube analytics.

Example

The AR VAT cube consists of a combination of accounting, invoice, delivery, order and master data – representing the end-to-end accounts-receivable VAT process. Moreover, it contains numerous intelligent fields such as goods flow (combination of ship-from information and ship-to information), VAT scenario recognition (whether the transaction is part of a triangular supply, sales of consignment goods, sales of services – to which different VAT law and legislation applies).

Phase 3: Reporting

Data cubes are loaded into a business intelligence layer providing the end-users with smart tax dashboards containing predefined VAT analytics available out-of-the-box, and helpful key facts and figures. The TIS reporting front-end contains over 80 standard VAT analytics and over 20 standard dashboards. Client-specific, customized analytics and dashboards are also possible.

C-2015-1-Loo-06-klein

Figure 6. Example of TIS dashboard: sales overview. [Click on the image for a larger image]

Analysis scoping

After agreeing a VAT data analytics project with the client, a kick-off meeting will be held with the client to gain in-depth understanding of the client’s indirect tax processes. The main goal of this meeting – besides the usual scoping of entities and the time scope to be analyzed – is a joint selection of areas that will be targeted with VAT analytics and a definition of the analytics that are fit-for-purpose to cover the project objectives.

Example

Another interesting area for VAT data analytics is in Shared Service Centers where accounts payable clerks process large volumes of invoices. The quality of tax coding by these AP clerks may give rise to potential input VAT recovery opportunities. Table 2 shows typical example analytics that are applicable in this case.

C-2015-1-Loo-t02

Table 2. Examples of VAT data analytics (including an example analysis objective).

Data extraction

Based on the scoping (entities, period, analytics), the data extraction scope will be determined and be executed by the client’s IT department. Data will be securely transferred from client premises to KPMG premises.

Generate client-specific TIS and perform data analysis

After receiving client data, tax data scientists will prepare an initial version of TIS – taking into account the agreed scoping of analytics. These specialists will take a first high-level glance at the TIS, performing sanity checks (reconciliations, spot checks such as revenue totals, spend totals, top customers, top suppliers) to ensure the reliability of the data for further analysis. In conjunction with indirect tax professionals, data analysis will be performed using TIS as a professional support tool. The main outcomes of this data analysis will be quantified, fact-based attention points/observations, and a sample of underlying sales/purchase invoices for validation purposes. Next, the client will pick the invoices, and indirect tax specialists will test the selected invoices against the reason behind the sampling. The conclusion can be that either the invoice is correct from a VAT point of view, or the invoice shows the test’s correctness. In the first case, the data analysis needs to be technically amended to suppress transactions with these characteristics, whereas in the latter case this implies that this transaction (and potentially other similar transactions) hold a VAT risk and/or opportunity, based on the testing hypothesis. More invoices can be requested on the basis of the results of the first invoice sample.

Hold a validation workshop and write a report

A validation workshop will be held along with the client’s finance, tax and IT professionals to discuss the initial findings of the data analysis. TIS will act as a facilitation mechanism to provide clients with key, factual insights that support the findings. The client’s input is helpful to obtain deeper understanding of the data analytics outcomes, to identify potential root-causes, and ultimately verify the correctness of the analytics performed. Based on the validated data analytics, a report will be written containing observations, recommendations and suggested next steps. Detailed outcomes of the data analytics are extracted from TIS and distributed to the client as well.

One-off versus insourced/outsourced solution

The process approach described is typical for any client who comes into contact with indirect tax data analytics for the first time. The purpose of the project, however, can be completely different, varying from a risk assessment of outgoing sales transactions to a Shared Service Center accounts payable VAT opportunity review. Next to these off-line, historical data analytics projects, clients are requesting continuous access to indirect tax data analytics solutions themselves. Figure 7 visualizes the different solutions that can be installed. A distinction can be made between insourced or outsourced solutions.

C-2015-1-Loo-07-klein

Figure 7. TIS implementation offerings. [Click on the image for a larger image]

TIS SaaS: an outsourced, cloud solution that enables clients to connect externally to the data analytics dashboards. A periodic data transfer takes places between the client and KPMG for refresh purposes. This solution is mainly of interest to medium-sized companies with limited end-users (<10) and smaller database sizes.

TIS On-premise: an insourced, on-premise data analytics solution bolt-on to the client’s ERP/BI platform that enables clients to have continuous access to data analytics dashboards. Ownership of analytics and dashboards is not transferred. Periodic maintenance, as well as analytics, dashboards and legislation, will be taken care of by KPMG. This solution is mainly of interest to large multinationals with 10 to 100 end-users, without having to maintain the solution in tax technical terms.

TIS Implemented: the same as TIS On-premise, but ownership of the analytical content, dashboards and corresponding maintenance is also transferred. This solution is mainly of interest to huge multinational companies with 100+ end-users and an IT department that has the capacity to perform maintenance themselves.

A fit-for-purpose solution will be chosen to cover client needs (from a costing perspective as well as a maintenance/governance perspective).

Typical project findings/benefits

  • There were up to 4% of sales invoices where the automatically calculated tax code had been manually overwritten by accounts receivable employees.
  • There were up to 3% of sales invoices where no indirect tax had been accounted for on domestic transactions where local VAT should have applied.
  • There were up to 3% of purchase invoices from domestic suppliers for which no tax code had been assigned, resulting in outgoing VAT that was not recovered.
  • There were up to 1% of purchase invoices where an output tax code was incorrectly assigned.

Horizontal Monitoring and data analytics

In a number of countries, the relationship between taxpayers and the tax authorities has changed. In the Netherlands, Horizontal Monitoring (in Dutch: “Horizontaal Toezicht”) was introduced about 10 years ago.

Horizontal Monitoring can be described as having a sustainable partnership with the tax authorities, based on (justifiable) mutual trust, showing transparency and respect, with codified responsibilities of both parties, with codified mutual agreements, which are respected at all times.

Horizontal Monitoring implies that the company has already implemented or will implement a Tax Control Framework. This is an internal control instrument that focuses particularly on the business’s tax processes. It forms an integral part of a company’s Business or Internal Control Framework.

In a system of Horizontal Monitoring, such as the one deployed by the tax authorities, there is scope for monitoring by the tax authorities itself, but a basic premise is that the tax authorities do not do work that has already been done by others (e.g., internal and/or external auditors). The object of monitoring is the Tax Control Framework, because it describes the business’s system for controlling tax processes.

Data analytics can be regarded as an important element of the Tax Control Framework, as the outcome demonstrates the level of quality of the tax process. It also reveals the root cause of the weak spots in the system and enables the company to take the necessary measures to ensure that mistakes will no longer occur.

Conclusion

In this article we have outlined how data analytics can be applied in the area of transactional taxes. Because organizations are becoming more globalized and transactional flows are becoming more complicated, the necessity monitoring accuracy of tax calculations via data analytics has significantly increased. In addition, the tax authorities are becoming increasingly better equipped with sophisticated tools and specialists to perform VAT audits in a highly efficient way. In order to be proactively in control from a tax perspective – for yourself and for the tax authorities – a combination of a profound set-up of the ERP system (authorizations, VAT application controls, correct tax rates) with a VAT monitoring mechanism (data analytics or the application of statistical sampling techniques) is needed to achieve this. Data analysis should never be a goal in itself but is always a means that helps measure VAT control objectives and contributes to the realization of effective processing of VAT calculations.

This can only be successfully achieved when multidisciplinary teams (tax and technology) collaborate and demonstrate willingness and capability to step into each other’s worlds and try to speak each other’s language.

References

[Bigg08] S.R.M. van den Biggelaar, S. Janssen and A.T.M. Zegers, VAT and ERP – What a CIO should know to avoid high fines, Compact 2008/2.

[Dave13] Thomas H. Davenport, Analytics 3.0: The Era Of Impact, Harvard Business Review 2013/12.

Van risicoanalyse naar data-analyse in de publieke sector

In november 2014 organiseerde KPMG een rondetafelbijeenkomst over de toepassing van data-analyse in de publieke sector. De doelstelling van deze bijeenkomst was om met relaties uit de publieke sector een open discussie te voeren over de mogelijkheden en beperkingen van data-analyse. Hiertoe hebben diverse sprekers hun visie op een succesvolle toepassing van data-analyse gepresenteerd. Deze visie is aan de hand van praktijkvoorbeelden van de Autoriteit Diergeneesmiddelen en KPMG nader geïllustreerd. In dit artikel een verslag van de belangrijkste uitkomsten van deze bijeenkomst.

Inleiding

Data-analyse staat sterk in de belangstelling, met name vanwege de toenemende beschikbaarheid en de combinatie- en analysemogelijkheden van gestructureerde databases, om op feiten gebaseerde conclusies te trekken of beslissingen te nemen. Data-analyse vormt daarmee een steeds belangrijker onderdeel van de ‘governance’ van organisaties. Al dan niet geïnspireerd door de toepassing van data-analyse in de jaarrekeningcontrole en door mediaberichten over de – onbegrensd klinkende – mogelijkheden van big en open data, zijn veel organisaties overgegaan tot toepassing van data-analyse als onderdeel van ‘verbijzonderde controles’ in het primaire proces en de analyse van transactieverwerking in de bedrijfsvoering.

Waar voorheen steekproeven of enquêtes werden gebruikt, kan voortaan de gehele (gegevens)populatie worden geanalyseerd. Dit als opmaat voor het in de toekomst kunnen benutten van de ontluikende data-explosie met ontwikkelingen als het Internet of Things (sensoren in de vitale publieke infrastructuren).

De eerste succesvolle toepassingen van data-analyse in het bedrijfsleven waren voornamelijk in de financiële, retail- en logistieke sectoren en binnen organisaties bij financiële en marketingafdelingen. De bij deze organisaties in gebruik zijnde ERP-systemen bevatten veel transactiegegevens, die door hun gestructureerdheid relatief gemakkelijk voor data-analyses kunnen worden benut. Al constateren wij in de praktijk nog vooral operationeel georiënteerde data-analyses en nog weinig strategische toepassing – de beantwoorde vragen komen nog beperkt uit het beleid voort.

Data-analyse heeft bij overheidsinstellingen echter tot nu toe minder ingang gevonden dan in bovengenoemde commerciële sectoren. Naast researchinstellingen en UMC’s zijn het in eerste instantie met name uitvoeringsorganisaties en toezichthouders die de uitvoering van hun taken, het voldoen aan wettelijke termijnen of de beteugeling van hun rechtmatigheids- en frauderisico’s op basis van data-analyses willen versterken. In de publieke sector worden eveneens veel gegevens opgeslagen en door het gebruik van het burgerservicenummer (BSN) zijn deze ook eenvoudiger te combineren en te koppelen – mits dit is toegestaan uit wettelijk oogpunt (zogeheten ‘doelbinding’ uit de Wet bescherming persoonsgegevens) of vanuit maatschappelijke verwachtingen.

Om de mogelijkheden van het verder uitbreiden van de toepassing te onderzoeken hebben Ronald Koorn, Henk Hendriks, Koen klein Tank, Stefan Zuijderwijk en Peter Bölscher vanuit KPMG IT Advisory een bijeenkomst over data-analyses in de publieke sector georganiseerd. Bij de bijeenkomst waren deelnemers aanwezig afkomstig van uitvoeringsorganisaties zoals zelfstandige bestuursorganen, agentschappen, inspecties, toezichthouders en (hoger)onderwijsinstellingen. In de paragraaf ‘Uitwisseling van ervaringen’ leest u enkele voorbeelden van door deelnemers en KPMG’ers uitgewisselde ervaringen.

Mogelijke doelstellingen en vormen van data-analyse in de publieke sector

Ronald Koorn startte de bijeenkomst met een inleiding op de gehanteerde doelstellingen en vormen van data-analyse in de publieke sector. Aan de hand van figuur 1 besprak hij hoe data-analyse kan worden toegepast bij het verbeteren van effectiviteit, betrouwbaarheid, rechtmatigheid en doelmatigheid van zowel primaire als ondersteunende processen. Hierbij kan verder onderscheid worden gemaakt in de wijze waarop kan worden gebruikgemaakt van persoonlijke expertise op een bepaald gebied, bedrijfsregels, kunstmatige intelligentie en gestructureerde of ongestructureerde externe data (zie de ringen van de stam in figuur 2). Het analyseren van data aan de hand van bedrijfsregels en gestructureerde data van andere instanties zijn momenteel de eerste stappen die overheidsorganisaties hebben gezet. Wij zien nog marginaal gebruik van ongestructureerde interne of externe data, zoals data van onder toezicht gestelde partijen.

C-2015-1-Koorn-01

Figuur 1. Nut en noodzaak van data-analyse in de publieke sector.

C-2015-1-Koorn-02-klein

Figuur 2. Data-analyse in de publieke sector: antwoord op maatschappelijke en organisatorische vragen. [Klik op de afbeelding voor een grotere afbeelding]

Voordat de twee praktijkcasussen over data-analyse gerelateerd aan de dienstverlening en aan de bedrijfsvoering werden behandeld, werd ingegaan op de relatie tussen risicoanalyse en data-analyse (zie figuur 3).

  • Met een risicoanalyse kan worden bepaald in hoeverre bijvoorbeeld organisatie- of beleidsdoelen niet worden behaald, wat de kans hierop is en welke impact dat heeft. Volwassen organisaties hebben op basis van een organisatiebrede risicoanalyse naast key performance-indicatoren (KPI’s) ook key risico-indicatoren (KRI’s) gedefinieerd.
  • Met een data-analyse kunnen deze KRI’s worden gemonitord, maar kan natuurlijk ook worden geprobeerd antwoorden op specifieke maatschappelijke en organisatorische vragen uit de data te destilleren. Voorbeelden van dergelijke vragen zijn met welke interventies de veiligheid in stadscentra het meest gebaat is, in welke processen gemeenten en provincies hun administratieve lasten het beste kunnen verlagen, of alle omvangrijke inkopen Europees zijn aanbesteed, welke processen lange doorlooptijden en afwijkende betalingen kennen, etc. Daarnaast kan met data-analyses worden vastgesteld in hoeverre de andere getroffen beheersingsmaatregelen al dan niet effectief functioneren (zie de figuren 3 en 4).

C-2015-1-Koorn-03

Figuur 3. Van risicoanalyse naar data-analyse.

C-2015-1-Koorn-04

Figuur 4. Samenhang van beheersingsmaatregelen.

Terwijl data-analyses zich vrijwel uitsluitend richten op databaseniveau, kunnen risicoanalyses zich op alle niveaus van de ‘stack’ van beheersingsmaatregelen richten, van doelen tot aan operationele aspecten (zie ook figuur 4).

Praktijkvoorbeeld van toepassing van data-analyse in het primaire proces

De directeur van de Autoriteit Diergeneesmiddelen, dr. Hetty van Beers, gaf vervolgens een toelichting op de toepassing van proces-, systeem- en data-analyse voor de landelijke monitoring van de reductie van antibioticagebruik in de veehouderij. In 2010 besloot de overheid het gebruik van antibiotica te reduceren om de toenemende resistentie te beteugelen; het antibioticagebruik moest in 2011 met 20 procent gereduceerd zijn, in 2013 met 50 procent en uiteindelijk in 2015 met 70 procent. De Autoriteit Diergeneesmiddelen (SDa) werd door de overheid en private partijen opgericht om standaarden te zetten, te benchmarken, afwijkend gebruik te signaleren en toezicht te houden op de kwaliteit van de data en de registratieprocessen.

Door aan veehouders, diersectoren en dierenartsen benchmarkwaarden en de te hanteren rekensystematiek voor te schrijven en periodiek hierover terug te koppelen hoe hun verbruik van verschillende typen antibiotica zich verhoudt tot die van andere vergelijkbare veehouders, heeft de SDa bewerkstelligd dat het gebruik inmiddels significant is teruggedrongen. Aan het vaststellen van de benchmarkwaarden en het berekenen van het gebruik van antibiotica op bedrijfsniveau liggen een goede analyse, transparante rekensystematiek en een diergeneesmiddelendoseringstabel ten grondslag. Data-analysemethodieken vormen een belangrijk onderdeel van deze aanpak doordat op basis van resultaten van data-analyses het absolute en relatieve antibioticagebruik inzichtelijk wordt gemaakt en de benchmarkwaarden en doseringen worden berekend. Verder vindt toepassing van data-analyses plaats bij het bewaken van de kwaliteit van de gehanteerde data. Ook werd ingegaan op de rol van KPMG, die ondersteuning bood bij het uitvoeren van landelijke proces-, systeem- en data-analyses in diersectoren en bij dierenartsen. Op basis hiervan heeft de SDa beter kunnen bepalen in hoeverre de registratieprocessen en datakwaliteit toereikend zijn voor het bepalen van rekensystematieken en benchmarkwaarden.

Zonder betrouwbare data en landelijke data-analyses zouden geen goede en – per type antibioticum gedifferentieerde – uitspraken en rapportages over antibioticagebruik en reductie ervan aan het ministerie en de Tweede Kamer te doen en maken zijn.

Data-analyse als onderdeel van risicomanagement van ondersteunende processen

Vervolgens presenteerde Koen klein Tank vanuit KPMG de aanpak en succesfactoren van data-analyse in ondersteunende processen. Hij ging nader in op hoe data-analyse op basis van KPMG’s Facts2Value-aanpak kan worden toegepast als onderdeel van risicomanagement van bijvoorbeeld een betalings- of HR-proces. Hiertoe schetste hij hoe data-analyse bijvoorbeeld kan worden gebruikt bij het onderzoeken van de volgende zaken:

  • Het efficiënt functioneren van bulktransactieprocessen, bijvoorbeeld in een shared-serviceorganisatie (‘worden alle interne en externe klanten binnen SLA-termijnen bediend?’).
  • Het betrouwbare en integere verloop van operationele transacties, zoals controle op gemandateerde inkopen en factuurbetalingen (‘zijn er invoerfouten gemaakt?’ en ‘zijn er krediet- of declaratielimieten overschreden of spoedbetalingen buiten werktijden doorgevoerd?’).
  • De effectieve werking van autorisaties en procedures, zoals hiervoor reeds genoemd en in figuur 4 gevisualiseerd. Dit betreft dus niet alleen de theoretische mogelijkheid van het doorbreken van mandaten en functiescheidingen, maar ook het daadwerkelijk doorgevoerd zijn van transacties (‘is het bestellen rechtmatig gebeurd?’ en ‘is het afboeken van dubieuze debiteur of wanbetaler volgens onze richtlijnen gebeurd?’).
  • Het verloop van het werkkapitaal (‘moeten wij een beroep doen op de bank voor onze te verwachten liquiditeitsbehoefte?’).
  • Het naleven van wet- en regelgeving (‘zijn er afwijkende betalingstransacties, bijvoorbeeld transacties met bijzondere organisaties of transacties die fraude- of omkopingssignalen bevatten?’).
  • Het waarborgen van de privacy, vertrouwelijkheid en retentie (‘wie heeft inzage gehad in medische gegevens van medewerkers?’ en ‘hebben wij geen gegevens/documenten opgeslagen die over hun bewaartermijn heen zijn?’).
  • De kwaliteit van de gegevens, de heilige graal (‘hoeveel keer komen dezelfde klanten en leveranciers voor?’ en ‘hoeveel uitval is er bij een fotovergelijking met een basisregistratie?’).

De visie van KPMG op de toepassing van preventieve controles en detectieve data-analyse in het inkoopproces is in figuur 5 aan de hand van een vergelijking met een snelweg geïllustreerd.

C-2015-1-Koorn-05-klein

Figuur 5. KPMG’s visie op preventieve controles en detectieve data-analyse: de snelweg. [Klik op de afbeelding voor een grotere afbeelding]

Uitwisseling van ervaringen

Tot slot spraken de deelnemers in een open discussie over de toepassingsmogelijkheden van data-analyse en de uitdagingen hierbij. Vergelijkbaar met wat in het internationale KPMG-onderzoek over data-analyse ([KPMG14]) naar voren kwam, waren de meeste deelnemers van mening dat de toepassing van vergaande data-analyses hun functie zal kunnen veranderen en in de eerste plaats efficiency- en effectiviteitswinst in de bedrijfsvoering tot gevolg kan hebben.

Op basis van hun leerervaringen bespraken de inleiders en de deelnemers de belangrijkste uitdagingen, de do’s en don’ts, voor de toepassing van data-analyse in de publieke sector – in lijn met het bovengenoemde KPMG-onderzoek.

Projectmatige leerervaringen

  • Er zijn meer data-analysespecialisten nodig; in Nederland moeten we daarom veel investeren in de opleiding van dergelijke specialisten. De grote hoeveelheid aan kleinschalige initiatieven op het gebied van data-analyse zou beter gecoördineerd moeten worden.
  • Data-analyse moet met steun van het management uit de operationele controlehoek en hobbysfeer komen om belangrijkere beleids- en organisatorische vragen te kunnen beantwoorden. Dan kunnen ook de kwantitatieve analyseresultaten aan kwalitatieve vraagstukken worden verbonden.
  • De betrokkenheid van zowel ervaren proces-, systeem- als data-analisten is cruciaal om een pilot te laten welslagen door bruikbare resultaten. Bij voorkeur maakt de pilot ook deel uit van een breder organisatietraject met bestuurlijke ophanging (bijvoorbeeld Lean, risicomanagement, fraudedetectie en dergelijke).
  • Generieke data-analyses voegen weinig toe, die moeten concreet worden toegespitst op specifieke processen en onderwerpen. Het juist vertalen van vage doelen en wensen naar praktisch uitvoerbare controles en analyses vergt veel aandacht om ‘false positives’ te vermijden. Het aantal false positives moet op een acceptabel laag niveau liggen voor voldoende draagvlak. Bovendien is de overheid nog beperkt competent in het definiëren van goed bruikbare risicoprofielen.
  • Vergeet niet het verandertraject naar een informatiegedreven organisatiecultuur. Vanzelf ontstaat dan het bewustzijn dat ‘eigenaarschap’ en standaardisatie van gegevens onmisbaar zijn.
  • Zorg dat data-analyse onderdeel is van een breder proces, denk bijvoorbeeld aan de integratie van data-analyses in bestaande beleidsevaluatie, managementinformatie of de Planning & Control-cyclus. Zonder organisatorische inbedding hebben data-analyses weinig overlevingskansen.

Inhoudelijke leerervaringen

  • Door samenvoeging van verschillende databronnen worden op termijn de uitkomsten en de datakwaliteit beter. Dit kan gezien de ontstane vervuiling wel een meerjarig traject vergen.
  • Een gegevensautoriteit en gegevenswoordenboek per sector of keten is nodig om te komen tot uitgebreidere gegevensuitwisseling en data-analyses.
  • Bij het in één database combineren van ‘kroonjuwelen’ is de toegangsbeveiliging van cruciaal belang.
  • Tevens moet voorzichtig worden omgegaan met het analyseren van gevoelige persoonsgegevens en gegevens over persoonlijk gedrag. Om te voorkomen dat de overheid als Big Brother wordt beschouwd is het beter de gegevens eerst te anonimiseren of pseudonimiseren[Pseudonimiseren is een procedure waarmee identificerende gegevens met een bepaald algoritme worden vervangen door versleutelde gegevens (het pseudoniem). Het algoritme kan voor een persoon altijd hetzelfde pseudoniem berekenen, waardoor informatie over de persoon, ook uit verschillende bronnen, kan worden gecombineerd. Daarin onderscheidt pseudonimiseren zich van anonimiseren, waarbij het koppelen op persoon van informatie uit verschillende bronnen niet mogelijk is (uit: ISO-standaard TS 25237).] voorafgaand aan het uitvoeren van data-analyses – anders zou allereerst regelgeving of expliciete toestemming nodig zijn.
  • De rol van tooling is essentieel om efficiënte data-analyses uit te voeren; in veel gevallen blijken er al IT-hulpmiddelen in huis te zijn.
  • Eventueel maatwerk in standaardpakketten is een complicerende factor waar rekening mee moet worden gehouden bij de interpretatie van analyseresultaten.
  • Als data-analyses op het terrein van bedrijfsvoering met name detectief van aard zijn, dan is het beter om op basis hiervan een aantal preventieve applicatiecontroles in te richten.
  • Het is van belang kwalitatief goede data op dusdanige wijze beschikbaar te krijgen dat ze kunnen worden toegepast bij data-analyses.

Het visualiseren van uitkomsten is een krachtig middel om bestuurders en managers te overtuigen van de mogelijkheden van data-analyses, met name in het primaire proces.

De meeste deelnemers verwachten de komende jaren nog bezig te zijn met het op poten zetten van goede data-analyses. De vervolgstappen naar Continuous Auditing en Continuous Monitoring of naar volledig – in de processen en systemen geïntegreerd – risicomanagement zien de deelnemers pas op langere termijn plaatsvinden.

Slotoverwegingen

Overheidsorganisaties staan nog aan de vooravond van bredere, gedetailleerdere en doelgerichtere data-analyses. Niet alleen om de bedrijfsvoering te beheersen en te optimaliseren, maar vooral ook om de primaire processen effectiever en efficiënter in te richten. Na een start met data-analyses uitgevoerd op de kernprocessen bij inspecties, toezichthouders en uitvoeringsorganisaties, verwachten wij dat daarna complexere maatschappelijke vraagstukken en beleidsvraagstukken zullen worden aangepakt. Tevens zullen patroonherkenning en heuristische analyses ingang vinden bij de meer volwassen data-analysegebruikers. Hiervoor zal het meestal ook nodig zijn gegevens uit de eigen organisatie en uit andere organisaties of bronnen te combineren en daarvoor zijn verdere standaardisatie van de informatie-infrastructuur van de overheid (governance, data- en uitwisselingsdefinities) en goede rechts- en privacybescherming randvoorwaardelijk.

Omdat ruime praktijkervaring ontbreekt, waren alle deelnemers van mening dat het verder uitwisselen van kennis en ervaring een mogelijke oplossing is voor het succesvol(ler) toepassen van risico- en data-analyses in de publieke sector. Ten slotte spraken alle deelnemers de verwachting uit van een sterke groei aan data-analyseprojecten in hun organisatie.

Literatuur

[KPMG14] KPMG, Driving performance while managing risk: embedding data and analytics in the business model, 2014, http://www.kpmg.com/NL/nl/IssuesAndInsights/ArticlesPublications/Documents/PDF/Big-Data/Driving-Performance-While-Managing-Risk.pdf

[Veld14] M. op het Veld, A. van der Harst en N. Scheps, Data-analytics: Rondetafel Internal Audit Diensten, Compact 2014/2.

The Effects of Data Governance in Theory and Practice

Although we have considerable experience in implementing data governance as part of a data management organization and we have seen that the effects are consistently positive, it remains difficult to establish the exact effects of data governance. In this article, we pinpoint the relationship between data governance and an organization (theory). Subsequently we use client cases to examine the relationships between data governance and business performance (practice). These two together provide insight in the effects of data governance.

Introduction

Enterprise data have become highly important. They were initially seen as a by-product of business processes, for example for financial recording. Nowadays, data are considered to be a valuable asset in and of themselves. This value is primarily provided through two important applications: business processes and reporting. First, increasingly complex and globalizing business processes require the support of reliable data. For example, the international container shipping industry requires timely and accurate data to feed its logistical planning; insufficient data quality leads to inefficiencies in the supply chain. Second, enterprise data are used for reporting to, for example, the regulator. Tax reporting, for instance, depends on reliable recordings of the company’s purchases. Put differently, enterprise data are being used to steer and direct business performance, while simultaneously enabling compliance.

Notwithstanding its importance, the implementation of data management at companies is not always sufficient. Although many companies have well-managed IT systems, the responsibilities and accountabilities with regard to enterprise data are mostly unclear. We see that, when no clear policies, rules and controls are defined within the organization about who is responsible for which data, the overall quality of the data is likely to deteriorate. Poor data quality leads to inefficiently organized business processes, and cause companies to run the risk of non-compliance with the relevant regulator(s).

KPMG has broad experience in advising clients about sustainable data management using data governance (such as [Waal12]). In most cases, we see that clients are satisfied with the solution provided and experience the added value of data governance. Nevertheless, it appears to be difficult to get sponsorship for a sustainable data management organization in advance. We consider an insufficient understanding of the effects and functioning of data governance in an organization to be the root cause of this. How does data governance affect an organization? And what is the quantitative effect on business performance? In other words: what is the business case for improving data governance?

In this article, we provide a view on data governance in an organization in order to elucidate the manner in which it affects enterprise data and business processes. By outlining cases in the food, retail and logistics sector, we set the first step towards gaining insight into the effects of data governance on an organization.

What is data governance?

The starting point of this article should be the definition of data governance. A commonly used definition has been formulated by Thomas ([Thom06]): “Data governance is a system of decision rights and accountabilities for information-related processes, executed according to agreed-upon models which describe who can take what actions with what information, and when, under what circumstances, using what methods.” Essentially, data governance is an overarching concept that defines who is responsible and has which role for what data at what point in the process. Roles and responsibilities for enterprise data alone, however, are not sufficient to improve data quality in a sustainable way. Data governance needs to be complemented by other elements of data management that together form a comprehensive data management framework.

We defined a framework for data management (see Figure 1), based on our experience in the field of Enterprise Data Management and commonly used data management frameworks such as DAMA DMBOK ([Mosl10]). The framework consists of nine building blocks, representing the approach for Enterprise Data Management. Data Governance is part of the approach, together with, for example, data Definitions, Standards & Quality, providing a single source of truth within an organization. The package of measures creates a sustainable data management organization, given that they are properly embedded in the organization, guided by a strategy and principles for enterprise data.

C-2015-1-Jonker-01

Figure 1. KPMG Enterprise Data Management Framework.

Theory: Conceptualizing data governance

In our data management projects, we have experienced that data governance and the accompanying data management measures from the EDM Framework have a positive effect on the performance and compliance of businesses. The measures elevate the data quality to the level of fitness-for-purpose for the organization and its regulator. Put differently, data quality should be improved up to the point at which data are a sufficiently reliable source of information to be fully supportive to the enterprises’ business processes and reporting.

Notwithstanding our broad experience in Enterprise Data Management projects, helping many organizations to create a sustainable data management organization, it is difficult to determine the exact impact on the business performance. For example, what is the effect of data governance on the Operation Expenditure (OPEX) of a company in the logistics sector? 10% decrease? 30% decrease? As one can imagine, it is difficult to find a straightforward answer to this question. One of the main reasons is that data governance, including all accompanying measures in a data management organization, has an enterprise-wide effect. As is essentially the case with all types of governance projects, data governance is initiated top-down. Consequently, there are many factors that ultimately determine the effect on the performance of the business. Consider incorrect product data in the ERP system of a food retailer. The supply chain planning and processes experience inefficiencies due to incorrect product data entries. Erroneous dimensions of products can, for example, lead to incorrect truck-loading schedules, requiring the expensive ad-hoc deployment of additional trucks. Furthermore, data governance should be a part of an Enterprise Data Management approach in order to function properly. It is therefore difficult to abstract the specific effects of data governance from the effects of the EDM framework implementation.

Due to this complexity, it is crucial to start with the conceptual relations between data governance, enterprise data quality and business performance. The context is added by mapping the relations on a typical organization, creating a generalized high-level overview of the effects of data governance in an organization. See Figure 2.

C-2015-1-Jonker-02

Figure 2. Data Governance Conceptualization.

We start at the bottom layer. The Technology layer includes computers, databases and so forth, but also other devices that contain data used in the enterprise. Other elements include, for example, data stored in the cloud, on a server somewhere in the world that is (securely) connected to the internet.

The data in the Technology layer forms the basis of the Create, Read, Update, Delete (CRUD) processes and other data processes in the overlying Data layer. CRUD processes are the four basic processes performed with data in databases. Other important data processes are the acquisition, validation, exchange and archiving of data. For example, when a piece of data, such as information about the delivery address, size, weight and content of products, is used in the (supply chain) process, the data is “Read” for use in the business. From the viewpoint of causal relations, this means that if the Technology is of a lower quality, the quality of the processes that can be performed with the data will also be lower. If, for example, the data in the database are poorly accessible, the data processes also suffer from this.

The processes in the Data layer create a certain data quality. When, for example, a sales order is created and processed, the data quality of this order depends on the functioning of these processes. This originates from the fact that data quality is a multifaceted concept, entailing elements such as timeliness. A low data quality – the degree to which the data are fit for purpose for the enterprise – is pervasive, costly and can cause high inefficiencies.

The primary business processes and reporting are situated in the Business Processes layer. These are both affected by the data quality, as a sufficient data quality is required to enable efficient business processes and reporting. For example, in the production process of a certain product, the amount and composition of the planned products must be known. If the data quality is too low, for example due to failing CRUD processes, it could induce errors in the production process, as well as in the reporting of the enterprise processes, such as error logs or financial data.

Business performance and regulatory compliance are at the end of the causal relations chain. These are altered by the business processes and the reporting in the Business Process layer. At first, the efficiency of business processes largely reflects the business performance of the enterprise. This relation is relatively straightforward, as a lower throughput in the production process will cause the production to decline, and therefore the business performance to decline (considering a constant product quality and market price). Second, the reporting influences the business performance and compliance of an enterprise. On the one hand, reporting is used for forecasting in business processes and performance overviews, on the basis of which the processes can be managed (monitoring). On the other hand, reporting (audit trails) is used to prove compliance with several laws and rules, depending on the country and sector.

As an overarching factor, the Organization layer includes data governance. It affects the CRUD and other data processes in the Data layer, as the organization will be more in control of its data processes as a consequence of data governance. It entails, for instance, roles and responsibilities regarding enterprise data. When no responsibilities are set, errors in the data might not be rectified, or only recognized much later in the process. If a responsible employee has been appointed, it can be assumed that fewer errors will actually enter the system, or that errors will be rectified earlier, leading to more efficient processes.

Although the conceptualization of data governance may seem straightforward, especially to those who are frequently involved in data management projects, it is an important starting point in measuring the effects of data governance in an organization. As the diagram shows, it can be concluded that data governance is part of the organizational structure, meaning that it is an overarching layer in the organization. Data governance influences the entire organization. This enterprise-wide effect drastically increases the difficulty of measuring the effects.

Practice: Cases of data governance effects

The conclusion from the conceptualization of data governance is clear: measuring the generalized effects of data governance is neither an easy nor an unambiguous exercise. To tackle this problem, we used three client cases to determine the effects ex post. Which effects do the companies experience? We interviewed three company representatives in the food, retail and logistics sectors who were closely involved in a data management project, being either data or IT managers. One additional representative from a company in the financial sector was interviewed as a comparing case.

The questions asked were twofold. First, do clients agree with our conceptual view on data governance? The answer to this question was positive in all interviews. More importantly, which effects of data governance did the clients experience in their businesses?

As expected, we gathered information on the effects of implementing data governance as part of a data management project. In line with earlier conclusions, the data governance effects as such are difficult to separate fully from the effects of other measures in the Enterprise Data Management Framework. Data governance alone simply does not suffice to sustainably increase data quality. The effects determined can therefore be attributed to the implementation of the data management organization, of which data governance is a component.

Case A: Dutch company in the food retail sector

The first company was a large Netherlands-based company operating mainly in the national food and retail sector. The company processes products for resale at over 400 local sales points, but does not manufacture any products itself. The supply chain of this company is highly complex and crucial to the efficiency of the company’s business processes. This case was characterized by insufficient data quality in the product database, primarily caused by absent formalized responsibilities with regard to the enterprise data.

Before data governance and accompanying data management measures were introduced at this client, the data quality throughout the supply chain was insufficient to ensure efficient business processes. The company’s product database is the backbone of daily operations and contains tens of thousands of products from various suppliers. At that time, it contained hundreds or even thousands of erroneous entries – and counting. This put a large burden on the efficiency of operations, as firefighting the consequences of errors in the product database had become a daytime job. Even critical errors occurred from time to time, which completely stalled the supply of products to the local sales points. The unavailability of products at the local sales points was not only a potential risk to the business profit, but also to the company’s reputation. Especially in a highly competitive market, this was very concerning.

An important root cause for the deteriorated data quality in the product database was the overall low attention paid to the product data. Few employees felt responsible for the database which was used by many in the company. Triggered by this conclusion, we advised the implementation of a data management organization, including data governance.

Nowadays, the company has fully implemented roles and responsibilities concerning its enterprise data, as well as most of the other aspects related to the data management organization, such as a meeting structure to continuously improve the product data.

Most importantly, has data quality improved? Is the company more in control of its product data? And, are business processes more efficient now that data governance and accompanying data management measures have been introduced into the company? The overall conclusion is positive. Of the thousands of errors in the system, practically none remained, the rest having been structurally solved. The company has indicated that about 50% of all data-related working hours have been saved. Weekly product data mutations, such as price changes at the local selling points, are an example of this improvement. Due to errors in the product database, mutations had to be performed throughout the week in a far more ad-hoc manner. For instance, altered prices turned out to be incorrect, requiring extra manual adjustments by the local sales point employee. After implementation, almost no ad-hoc changes were required. In conclusion, by structurally improving the data quality through data governance, the company was able to structurally improve its supply chain efficiency and reduce operational expenditure. This validates the relations in the Data Governance Conceptualization.

Case B: Dutch company in the food producing sector

The second case is a Netherlands-based company operating internationally in the food producing sector. The company manufactures products in various countries all over the world. The efficiency of the supply chain is therefore of great importance to the company’s business performance. The unique feature of this case is the strong focus on the centralization of data management.

Similar to the situation in Case A, the data quality was insufficient for efficient supply chain processes. The subject of the matter was the data quality at local production facilities all over the world. The facilities all had separate databases, containing data in different formats and quality. For the global operator, it was therefore practically impossible to gain insight into the process efficiency at the production facilities, let alone control the production costs. This for example led to situations in which two production facilities in the same country had different vendors for the same product, missing out on larger-scale benefits and wasting valuable transportation costs. Incorrect invoicing and critical errors in the production process also frequently occurred. These inefficiencies were a serious problem for the profitability of the business.

As we see more often, the production facilities had such a strong focus on the daily routine of producing and transporting products to sales points that few employees could oversee the impact and importance of data quality in the system. A great deal of workarounds were in place to take care of duplicate vendor entries, and some fields in the system were used for other purposes than intended, creating a maze of data entries in the system. Again, the responsibility for the company’s data had not been formalized, facilitating the deterioration of data quality.

The effects of the implementation of data governance and accompanying data management measures were also positive in this case. Data management was centralized to the global head office, taking responsibility for the data in the local production facilities. This included a large data-cleansing operation, removing about 40% of all data from the local systems. In conjunction with the centrally implemented data management organization, introducing, for example, enterprise-wide data standards, structured communication between head office and local production facilities, and data quality tooling, the data quality increased significantly. By deploying the new insights in the production processes for business strategy purposes, the costs of production could be significantly lowered. This conclusion is consistent with the relations in the Data Governance Conceptualization.

Case C: Dutch company in the logistics sector

The third case is an international company operating in the logistics sector. The company ships products all over the world. As the process of shipping products is the core business of this company and the market in which it operates is highly competitive, the company relies heavily on the quality of data within its supply chain. The drive to increase data quality is the particularly interesting aspect of this case.

Data quality is essential to the efficiency of business processes at this company. On one hand, the company has to comply with increasingly complex regulatory requirements in many countries. On the other hand, decreasing demand in the market in which this company operates requires a highly efficient supply chain. In the past, the company encountered problems with customs and with an overall reduction in its competitiveness, caused by insufficient data quality. For example, some shipments could not be handled by customs in specific countries or were delayed due to insufficient or incorrect data on the shipments. Ultimately, this led to decreasing customer satisfaction, which the company simply could not afford.

As a solution, data governance and data management measures were implemented, including, for example, roles and responsibilities for enterprise data and data quality tooling. The entire approach was focused on decreasing the costs of the supply chain, to enable the company to maintain its position in the global market. The approach turned out to have a tremendous impact on the efficiency of the supply chain. The company estimates that the return on investment of creating and implementing business rules as standards for enterprise data alone is more than 3.5 million euros. The reason for this success is that the company is more in control of the quality of its enterprise data. It has the ability to not only indicate whether or not data are available, but also to check for other aspects of data quality, such as correctness. All brought together in a data quality dashboard, the decision making within the supply chain has improved significantly. This led to a more efficient supply chain with fewer compliance issues, leading to a higher customer satisfaction. The improved business performance and compliance due to data governance validates the Data Governance Conceptualization.

Case D: Dutch company in the financial sector

The last case we review involves a large international company in the financial sector. In contrast to supply-chain-driven companies, business performance is mostly based on client relations. The company does not produce, ship or sell any physical products. Customer satisfaction is essential to the existence of this company.

An interesting feature of this case is that, before the introduction of data governance and accompanying data management measures, client information was stored in many systems throughout the company. This led to many inconsistent, incomplete, incorrect and double entries in several systems. Of course, with its strong reliance on customer relations and satisfaction, this put a heavy burden on the business performance. Data cleansing had to be performed constantly, as the data quality continued to deteriorate.

Centralized data management, including data governance, was implemented in order to increase the overall data quality at the company. The governance of data in different systems was centralized, creating one single source of truth. As we have also seen at supply-chain-driven companies, data governance and accompanying data management measures significantly increased the data quality and the overall control over enterprise data. Continuous data cleansing is now no longer needed and the data quality remains fit for purpose, which has significantly increased customer satisfaction. In an international customer satisfaction index, the company was the first in the business to reach positive numbers, largely supported by the data management approach. Other examples of effects are the saving of FTEs in the manual processing of customer data, which has now become unnecessary due to structurally improved data quality, as well as increased compliance with various regulators, such as a high-quality customer data supply to the regulator in the US, which demands data on US citizens. Again, this case validates the relations in the Data Governance Conceptualization.

Comparing the cases

The conclusion of the four cases seems clear: dData governance and accompanying data management measures are an effective concept to structurally increase enterprise data quality towards fitness-for-purpose within the company. The application differs slightly from case to case, but the effects are similar. The company in Case A focuses on product data, while the company in Case D aims to increase customer data quality. Regardless of their exact application, data must always be supportive to the primary processes of a company, similar to what we concluded in the conceptualization of data governance. Whether the core enterprise data are customer, product or other data does not matter. Especially now that data are becoming more and more important in business processes, are becoming more of an asset to the company, the relevance of data management is increasing. Differences in effects between the financial, the retail and logistics sector are minimal, which will also be the case in other sectors that rely on enterprise data in their primary processes.

C-2015-1-Jonker-t01

Table 1. Comparison of cases.

Conclusion

In this article, we have conceptualized data governance and reviewed information on the effects of data governance at four companies. The most important conclusion is that data governance, as part of an enterprise data management approach, has a positive effect on the quality of enterprise data. We see that companies are better in control of their data, structurally increasing the quality. The improved data quality has a considerable effect on the efficiency of business processes and the business performance, but also positively increases compliance with the regulator. The exact determination of the effects, however, remains a specific and complex task, as many company-specific factors that determine business performance and compliance are influenced by data governance. Thereby, it turns out to be difficult to abstract data governance from other measures in the Enterprise Data Management Framework. For now, the fact that the experiences with Enterprise Data Management are consistently positive motivates us to continue delivering this message, helping future clients in creating a sustainable data management organization.

References

[Mosl10] M. Mosley, D. Henderson, M.H. Brackett and S. Earley, DAMA guide to the data management body of knowledge (DAMA-DMBOK guide), Technics Publications, 2010.

[Thom06] G. Thomas, Alpha males and data disasters: the case for data governance, Brass Cannon Press, 2006.

[Waal12] A. de Waal and A.W.A. de Jonge, Data Governance bij een grote verzekeraar, Compact 2012/2.

Soft controls: IT General Controls 2.0

Organisaties besteden steeds meer aandacht aan soft controls en data-analyse om de kosten van compliance verder te verlagen, maar belangrijker nog om gedrag te verklaren en te beheersen. Dit blijkt enerzijds uit de toenemende behoefte van externe toezichthouders om inzicht te krijgen in cultuur en gedrag en anderzijds uit de technologische mogelijkheden om door middel van data-analyse een hogere mate van compliance te behalen op het gebied van interne beheersing. Grote incidenten en fraudes hebben de afgelopen jaren aangetoond dat het vaak de soft controls waren die haperden, zoals zonnekoningengedrag en/of een gebrek aan (onder meer) aanspreekbaarheid. Dit artikel verkent hoe soft controls binnen een IT-audit kunnen worden geïntegreerd. Het geeft inzicht in de toepassing van soft controls binnen IT-afdelingen en geeft een voorbeeld van het integreren van soft controls in de jaarrekeningcontrole ten aanzien van het IT-domein.

Inleiding

In 2003 verdedigde de Amerikaanse senator Paul Sarbanes in de Senaat zijn wetsvoorstel voor deugdelijk ondernemingsbestuur. Een rechtstreeks gevolg van deze wet is het systematischer inrichten van de interne beheersingsmaatregelen voor de financiële rapportages. Op 30 december 2004 trad de Nederlandse versie, de code-Tabaksblat, in werking. Deze code is van toepassing op alle vennootschappen in Nederland die zijn genoteerd op de Amsterdamse beurs. De code schrijft voor hoe toezicht op het bestuur is geregeld en hoe het bestuur verantwoording moet afleggen. In de eerste jaren na invoering van de wet concentreerden bedrijven zich vooral op het opzetten van een raamwerk van interne beheersingsmaatregelen. Zoals uit figuur 1 blijkt, is in de jaren die daarop volgden de focus verlegd naar het zoeken naar manieren om de interne beheersing verder te optimaliseren en hiermee de kosten van interne beheersing te verlagen. Hierbij zijn organisaties meer gaan steunen op geautomatiseerde beheersingsmaatregelen ([Bast04], [Neis02]).

C-2015-1-Basten-01

Figuur 1. Changing control environment.

Momenteel kijken organisaties naar aanvullende manieren om de effectiviteit van de interne beheersing te vergroten en hierover zekerheid te krijgen. Veelal moeten de kosten van compliance van interne beheersing omlaag en moet de zekerheid omhoog. Hierdoor bestaat de behoefte en de noodzaak om via aanvullende wegen aan zekerheid te komen. Daarnaast geven enkel hard controls niet voldoende zekerheid dat de risico’s van interne beheersing voldoende worden beheerst. Data-analyse en soft controls worden vaak genoemd als nieuwe technieken waarmee je met minder inspanning meer zekerheid kunt verkrijgen. In onze visie neemt de verschuiving van de aandacht naar data-analyse en soft controls in de jaarrekeningcontrole de komende jaren een grotere vlucht omdat data-analyse en soft controls niet alleen beter inzicht verschaffen in de mate van interne beheersing, maar organisaties ook inzicht geven in brede zin om bedrijfsprocessen verder te optimaliseren.

Behalve vanuit de interne organisatie (met name vanuit de interne auditdienst) komt er ook steeds meer aandacht voor soft controls vanuit internationale beroepsgroepen en Amerikaanse toezichthouders. Het COSO-raamwerk, dat in mei 2013 na twintig jaar een nieuwe release kreeg, vraagt expliciet aandacht voor competenties en verantwoordelijkheden. Een van de oorzaken is de toenemende complexiteit van organisaties en hun omgeving.

Ook in Nederland hebben externe toezichthouders (AFM en DNB) en commissarissen steeds meer aandacht voor soft controls. Uit onderzoek ([Lück15]) komt naar voren dat 48 procent van de commissarissen vindt dat de accountant een bijdrage kan leveren aan het beoordelen van de ‘tone at the top’. Na schandalen in de semipublieke sector, onder andere bij Vestia, Rochdale en Amarantis, heeft het kabinet eind 2013 een onafhankelijke commissie opdracht gegeven principes voor ‘behoorlijk bestuur’ op te stellen ([Hals13]). Deze Commissie Behoorlijk Bestuur, met als taak het opstellen van gedragsregels voor professioneel en ethisch verantwoord handelen van bestuurders en interne toezichthouders in de semipublieke sectoren, richt zich voor een belangrijk deel op soft controls.

Dit artikel begint met een definitie van soft controls. Daarna volgt een voorbeeld van de wijze waarop soft controls kunnen worden geïntegreerd in de jaarrekeningcontrole in het IT-domein.

Door meer regels meer ‘in control’?

Hoewel een verschuiving plaatsvindt naar het integreren van soft controls binnen audits, waren soft controls al aanwezig voordat hard controls binnen een organisatie werden geïmplementeerd. Ter illustratie: in het verleden liep de directeur van een grote supermarktketen een rondje door het bedrijf en was op die manier ‘in control’ over de operationele bedrijfsvoering. De afgelopen jaren heeft deze supermarktketen een aantal grote overnames gedaan van winkelketens. De directeur geeft aan dat het voor hem niet uitvoerbaar is om ‘in control’ te zijn door ‘management by walking around’.

De aard van de risico’s bij een groeiende onderneming verandert en de omvang van de risico’s neemt toe. Organisaties die ‘in control’ zijn weten vaak een balans te vinden tussen regels en vertrouwen. Naast compliance komt dit de tevredenheid, innovatiekracht en klantgerichtheid ten goede. Daarnaast wordt hiermee de betrokkenheid van medewerkers vergroot, wat vaak een positief effect heeft op het controlebewustzijn in de organisatie.

C-2015-1-Basten-02

Figuur 2. Verband tussen regels en fouten ([Katz05]).

Op basis van onderzoek ([Katz05]) is geconcludeerd dat er geen lineair verband bestaat tussen het aantal regels en het aantal incidenten. Er bestaat een optimum van beheersing waarmee de kans op incidenten het kleinst is. Mensen hebben blijkbaar behoefte aan houvast en duidelijkheid, maar dit kan ook doorslaan. Voorbij dit optimum vergroten additionele regels en procedures de kans op incidenten omdat men dan door de bomen het bos niet meer ziet en mensen geneigd zijn niet meer zelf na te denken. Vaak wordt geredeneerd dat iemand anders al goed heeft nagedacht over een bepaalde checklist en er dus niet meer hoeft worden nagedacht. De kans op incidenten kan echter niet tot nul worden gereduceerd, waardoor het management vaak de neiging heeft regels toe te voegen. Dit is concreet en tastbaar maar leidt niet zelden tot schijnzekerheid. Het vraagt lef van organisaties om op zoek te gaan naar de juiste balans door regels af te schaffen.

Soft controls

Soft controls kunnen worden gedefinieerd als ‘niet-tastbare gedragsbeïnvloedende factoren in een organisatie die van belang zijn voor het realiseren van de doelen van de organisatie en de eisen en verwachtingen van stakeholders‘ ([Kapt10]).

Organisaties nemen in toenemende mate soft controls mee in hun interne onderzoeken om op een vollediger wijze aantoonbaar ‘in control’ te zijn. Het management van een organisatie formuleert het beleid en stippelt de strategie uit om die vervolgens te vertalen naar kritische succesfactoren. Heus en Stremmelaar ([Heus00]) maken hierbij onderscheid tussen kritische succesfactoren (KSF’s) en kritische organisatievariabelen (KOV’s). Volgens hen heeft een KSF primair een externe focus en neemt die het perspectief van onder meer klanten en toezichthouders als uitgangspunt. Aan de hand van deze factoren kan de organisatie zicht houden op de mate waarin de strategische koers wordt gevolgd en de mate waarin de organisatie daarmee bijvoorbeeld onderscheidend blijft ten opzichte van de concurrentie. Voorbeelden zijn het percentage klantvriendelijkheid en het aantal klachten. Een KOV heeft daarentegen een interne focus. Hierbij wordt gekeken naar sociale, culturele en psychologische variabelen van de organisatie. Deze variabelen zijn van directe invloed op de effectiviteit van bedrijfsprocessen. Het management moet bij de inrichting van processen aandacht besteden aan zowel KSF’s als KOV’s.

Voor organisaties is het een opgave om de KSF’s/KOV’s te monitoren en bij te sturen. Sturing vindt plaats door zowel hard controls als soft controls. Soft controls zijn complementair aan hard controls (zowel data-analyse als process level controls). Een goede kwaliteit van soft controls heeft een positief effect op de effectieve werking van hard controls. Andersom geldt ook dat niet-effectieve process level controls een negatief effect kunnen hebben op gedrag. Een kassa die gemakkelijk toegankelijk is, leidt nu eenmaal eerder tot diefstal dan een kassa die afgesloten is. Het signaal dat uitgaat van een afgesloten kassa is evident: geen ongeautoriseerde toegang.

Inzicht in de kwaliteit van soft controls geeft inzicht in potentiële nieuwe risico’s. Soft controls zijn een belangrijk onderdeel van de in COSO beschreven entity level controls. ‘Tone at the top’, openheid en betrokkenheid bepalen voor een belangrijk deel het controlebewustzijn in de organisatie. Daarmee is de kwaliteit van soft controls (mede)bepalend voor de waarschijnlijkheid waarmee risico’s tot een acceptabel risico kunnen worden verlaagd.

Organisaties schrijven de meerwaarde van soft controls onder andere toe aan de systematische gedragsoorzakenanalyse. Internal-auditafdelingen maken in toenemende mate gebruik van een gedragsoorzakenanalyse om de kiem van een auditbevinding bloot te leggen. Soms wordt hiermee inzicht verkregen in nieuwe potentiële risico’s. Als resultaat van een audit gericht op de effectiviteit van hard controls kan bijvoorbeeld de bevinding worden gerapporteerd dat een procedure en/of richtlijn ontbreekt voor het proces van wijzigingsbeheer. De conclusie zou kunnen zijn dat de procedure en/of richtlijn (al dan niet op schrift) ‘niet effectief’ is. Het is nog maar de vraag of dit het geval is. Bij een oorzakenanalyse kan aan het licht komen dat medewerkers geheel volgens de (externe) norm werken maar dat bijvoorbeeld sprake is van een gebrek aan leiderschap. Denk in dit geval aan een leidinggevende die geen belang hecht aan regels, deze ook niet kent en dus hier ook niet op toeziet. De vraag is in welke mate deze manager betrokken is bij andere normen, zoals de gedragscode of regels rondom data security. Door te letten op soft controls, zoals de houding van het management, komen mogelijk niet eerder geïdentificeerde risico’s aan het licht.

Soft controls en soft-controlinstrumenten

Er is een onderscheid tussen soft controls en soft-controlinstrumenten. Soft controls zijn het best te vergelijken met de eerdergenoemde kritische organisatievariabelen (KOV’s) en beschrijven de context van een organisatie op verschillende niveaus, bijvoorbeeld op organisatiebreed niveau de ‘tone at the top’ en op het niveau van processen of controls de mate van uitvoerbaarheid van of betrokkenheid met hard controls. Soft controls vormen het fundament van iedere organisatie, het gedrag van bestuur, management en medewerkers. Soft-controlinstrumenten zijn de beheersingsinstrumenten die zijn gericht op het stimuleren van gewenst gedrag in een organisatie.

In figuur 3 is het KPMG Soft Controls Model opgenomen. Dit model geeft een schematische weergave van de samenhang tussen hard controls en soft controls. Het model bestaat uit de acht soft controls beschreven door Muel Kaptein ([Kapt11]).

C-2015-1-Basten-03-klein

Figuur 3. KPMG Soft Controls Model. [Klik op de afbeelding voor een grotere afbeelding]

Soft controls en soft-controlinstrumenten binnen het IT-domein

Wanneer de IT-auditor in het kader van de jaarrekeningcontrole een onderzoek naar de General IT Controls uitvoert, dan neemt de IT-auditor vaak al een aantal soft-controlinstrumenten mee in de beoordeling van de interne beheersing, zoals de IT-governancestructuur, security awareness en het gehanteerde IT-governancemodel (denk hierbij aan het demand-supplymodel tussen de business en de IT-organisatie of het hebben en naleven van de IT-strategie). Uiteraard heeft de IT-auditor vooraf het object van onderzoek bepaald op basis van een risicoafweging ([Neis02]).

Daarnaast besteedt de IT-auditor op procesniveau vaak impliciet aandacht aan soft controls. Het Capability Maturity Model (CMM) ([CMMI02]) helpt enerzijds om de volwassenheid van processen te meten en anderzijds om goed inzicht te krijgen in de menselijke factor in IT-beheersprocessen. Wanneer we de soft-controlinstrumenten uit het KPMG Soft Controls Model vergelijken met het CMM, dan zien we een overlap van componenten zoals:

  • gedragscode, ‘tone at the top’ en beleid (relateert aan de soft controls ‘helderheid’en ‘voorbeeldgedrag’);
  • monitoring en direct supervision (relateert aan de soft controls ‘transparantie’ en ‘aanspreekbaarheid’);
  • training en bewustwordingsactiviteiten (relateert aan de soft control ‘betrokkenheid’);
  • functioneringsgesprekken en taken & verantwoordelijkheden (relateert aan de soft control ‘helderheid’).

C-2015-1-Basten-04-klein

Figuur 4. Capability Maturity Model (CMM). [Klik op de afbeelding voor een grotere afbeelding]

Zoals uit figuur 4 blijkt, relateren een aantal meetindicatoren van het CMM aan de kwaliteit van soft controls. Zo kan het aspect ‘Mensen-en-vaardighedenmanagement’ (People and Capability Management) gemeten worden aan de hand van personeelsverloop, medewerkerstevredenheid en competenties van mensen. Deze indicatoren geven inzicht in de mate van betrokkenheid (hoe tevreden zijn mensen met hun werk en is tevredenheid mogelijk een reden voor laag personeelsverloop?) en uitvoerbaarheid (krijgen medewerkers de juiste trainingen om hun werk uit te voeren?).

Andere indicatoren/componenten, naast de meetindicatoren uit het CMM, die de IT-auditor helpen om inzicht te geven in de kwaliteit van soft controls zijn bijvoorbeeld:

  • Sterkte van de relatie tussen business en IT. Hebben business en IT heldere afspraken gemaakt over interne service levels? In welke mate zijn dilemma’s bespreekbaar?
  • Span of control. Is de afdeling te groot om nog direct supervision toe te passen? In hoeverre is de leidinggevende nog in staat om in voldoende mate betrokken te zijn?
  • Regeldruk. Hoe ziet de balans tussen regels en vertrouwen eruit?
  • Functional/technical quality of applications. In hoeverre worden medewerkers geholpen (of juist tegengewerkt) door IT-hulpmiddelen?
  • (IT-)strategie/visie. In hoeverre bestaat deze en wordt deze door het management uitgedragen en nageleefd? In welke mate zijn de strategie en visie helder voor de medewerkers?

Casus: monitoring en direct supervision

Bij een IT-afdeling van een Europees handelsbedrijf zijn de rechten van IT-medewerkers niet beperkt en hebben zij alle rechten binnen het ERP-pakket (zogenoemde ‘super users’). Het management geeft hiervoor twee redenen. Enerzijds zijn de super users nodig om goede support te kunnen leveren aan eindgebruikers en anderzijds is de beperking van rechten toch maar schijnzekerheid. Immers, zo redeneert het management, de IT-medewerkers kunnen via het OS of de database toch wel in het systeem komen. Kortom, de casus illustreert dat de interne beheersing voor een groot deel berust op vertrouwen in de medewerkers in plaats van op de inzet van hard controls.

Het is voor het management niet haalbaar om het daadwerkelijke gebruik van super users te loggen, maar de afspraak binnen de afdeling is dat IT’ers in een logboek vastleggen wanneer ze door middel van SQL de database hebben benaderd. De regel is dat zij het benaderen van de database samen met een andere persoon doen (sociale controle). Daarnaast zitten alle IT’ers centraal bij elkaar in een ruimte (direct supervision) en niet wereldwijd verspreid, waardoor medewerkers over het algemeen minder snel geneigd zijn om ongeautoriseerde transacties uit te voeren (‘de kassalade staat niet ongezien open’).

Een onderzoek naar de kwaliteit van soft controls geeft een belangrijk inzicht in de effectieve werking van de interne beheersing die voor een groot deel berust op vertrouwen. Relevante vragen in dit onderzoek zijn bijvoorbeeld: in welke mate zijn de bovengenoemde regels helder voor de IT-medewerkers, stimuleert de leidinggevende van de afdeling controlebewust gedrag, zijn de IT-medewerkers betrokken en gemotiveerd om risico’s te beheersen? En spreken zij elkaar aan bij het niet naleven van regels? Om antwoord te krijgen op deze vragen zal de IT-auditor gebruik moeten maken van minder traditionele vragen en auditinstrumenten, waardoor de accountant mogelijk minder gegevensgerichte werkzaamheden hoeft uit te voeren vanwege het verlagen van het restrisico.

Soft controls in het kader van de jaarrekeningcontrole

Wij onderscheiden twee niveaus bij de beschouwing van soft controls in het kader van de jaarrekeningcontrole: het niveau van entity level en het niveau van process level.

  • Wanneer we naar soft controls kijken op het niveau van entity level, beschouwen wij de kwaliteit van een of meer van de acht soft controls binnen een organisatie. Dit kan bijvoorbeeld door middel van een enquête onder medewerkers binnen een bepaalde thematiek, zoals ‘openheid’ of ‘controlebewustzijn’. De kernwaarden van de organisatie kunnen als referentiekader worden genomen.
  • Bij soft controls op het niveau van process level kijken we naar soft controls en soft-controlinstrumenten binnen bedrijfs- of IT-processen. Hier wordt vaak een link gelegd naar hard controls. Soft-controlinzichten kunnen input zijn voor de risicoanalyse voorafgaand aan de controlewerkzaamheden. De IT-auditor onderzoekt in het kader van ‘understanding of the IT environment’ wat de kans is op een materiële afwijking in de jaarrekening als gevolg van fraude en/of fouten in het IT-domein. Een goed begrip van de mogelijke oorzaken van afwijkingen is hierbij noodzakelijk. Inzicht in de kwaliteit van soft controls draagt bij aan het verkrijgen van een goed begrip.

In tabel 1 zijn de wijzigingen in de aanpak voor de IT-auditor schematisch weergegeven. De activiteiten in de nieuwe aanpak vragen om een IT-auditor die getraind is om soft controls te kunnen toetsen. De IT-auditor zal meerdere technieken moeten toepassen om zijn conclusie beter te kunnen onderbouwen.

C-2015-1-Basten-t01

Tabel 1. Veranderingen in de activiteiten van de IT-auditor.

De IT-auditor zal minder traditionele vragen moeten stellen en andere auditinstrumenten moeten hanteren die hem helpen in zijn onderzoek naar de kwaliteit van soft controls. Hij zou bijvoorbeeld de auditee een aantal stellingen kunnen voorleggen, voorafgaand aan het interview rondom hard controls. Dit vergt uiteraard ook vanuit de auditee de openheid om hier eerlijk over te antwoorden en vereist dus mogelijk nieuwe vaardigheden van de (IT-)auditor. Voorbeelden van zulke nieuwe vaardigheden zijn:

  1. Medewerkers zijn voldoende kritisch ten aanzien van elkaar met betrekking tot de control ‘autoriseren van gebruikers’.
  2. Medewerkers worden aangesproken op het omzeilen of niet juist uitvoeren van de control ‘de emergency change procedure’.
  3. Aanspreken op het niet naleven van de control ‘security awareness’ gebeurt serieus (niet alleen met een grap).
  4. Fouten rondom de control ‘review functiescheidingsconflicten’ worden niet afgeschoven op anderen.

Ook observaties geven de IT-auditor waardevolle informatie over het gedrag dat medewerkers vertonen. Denk hierbij aan de mate waarin zij adequaat vragen beantwoorden en elkaar aanspreken bij onbehoorlijk wachtwoordgebruik. Dit zijn belangrijke observaties in het kader van interne beheersing.

Een ander instrument is de dilemmasessie. Hierin kunnen ‘brede’ ethische dilemma’s worden behandeld, maar kan men ook specifiek ingaan op dilemma’s relevant voor de IT-audit, bijvoorbeeld in de sfeer van IT-security. Hierin kan het naleven van het informatiebeveiligingsbeleid aan de orde komen, bijvoorbeeld het spanningsveld tussen het halen van deadlines (service level agreements) en een gedegen implementatie van programmatuurwijzigingen in de productieomgeving (emergency change procedures). Dilemmasessies leveren niet alleen waardevolle controlinformatie op, maar vergroten tevens het risicobewustzijn bij de klant.

Casus: testmanagement

Het testmanagement bij een grote bank bleek in eerste instantie goed te zijn geregeld, maar uit onderzoek bleek dat een kritische houding op de testafdeling ontbrak. Dit werd vooral veroorzaakt door de ervaren druk om targets te halen. Een testprocedure, testverslagen, test evidence en formele (user acceptance testing [UAT]) goedkeuringsverslagen waren aanwezig. Ook de gesprekken gaven de bevestiging dat het testmanagement goed was ingericht en dat de procedures werden nageleefd. Echter, toen er enkele soft-controlvragen werden gesteld, kwam een ander beeld naar voren: de testen startten nooit op tijd en ook de benodigde resources werden nooit beschikbaar gesteld. Maar dit had uiteindelijk geen impact op het eindresultaat: de UAT-verslagen werden op tijd aangeleverd en de resultaten waren in bijna alle gevallen positief. Deze situatie is ontstaan doordat de testafdeling doorkreeg dat het hoger management een nieuwe release altijd goedkeurt en hun inbreng bij deze besluitvorming minimaal is. Testen is vaak de laatste stap voordat een nieuwe applicatie, module of change naar productie wordt gebracht. Het hoger management wil deze deadline halen en laat zich niet afleiden door een aantal testbevindingen. Het testteam kan alleen door substantiële testbevindingen het hoger management van gedachten laten veranderen, maar de testafdeling voelde zich niet voldoende gesteund om dit soort krachtige signalen af te geven (eerdere kritische signalen werden niet opgevolgd/gehoord). Daardoor werd er getest op een dusdanige wijze dat de uitkomsten overall positief zijn. Het testteam bleek uiteindelijk door scopewijzigingen, diepgang van testen en het oprollen van testresultaten over voldoende flexibiliteit te beschikken om naar een goed testverslag te kunnen werken, zonder dat het kon worden aangerekend op de aanwezige lacunes in de systemen.

Op basis van inzichten in de kwaliteit van soft controls krijgt de IT-auditor een beter inzicht in de daadwerkelijke risico’s van interne beheersing en kan hiermee een gefundeerde conclusie trekken over de werking van beheersingsmaatregelen binnen een organisatie.

Uitwerking met voorbeelden

In tabel 2 is voor twee typische ITGC-onderwerpen een uitwerking gegeven van mogelijke auditwerkzaamheden op zowel hard controls als soft controls.

C-2015-1-Basten-t02

Tabel 2. Uitwerking van ITGC-onderwerpen met voorbeelden.

Conclusie

Recent uitgevoerde jaarrekeningcontroles tonen de meerwaarde aan van het integreren van soft controls in het domein van General IT Controls. Na ruim tien jaar Sarbanes-Oxley, waarbij organisaties met name de focus hebben gelegd op het implementeren van hard controls, krijgen soft controls en data-analyse de afgelopen jaren meer aandacht. Organisaties hebben de ambitie om aantoonbaar ‘in control’ te zijn over (gedrags)risico’s en de kosten van compliance te verlagen. Aandacht voor soft controls kan nader inzicht verschaffen in de risico’s die een organisatie loopt en input geven voor een risicoassessment in het kader van de jaarrekeningcontrole. Na het testen van de beheersingsmaatregelen kan op basis van een soft controls root cause analysis worden vastgesteld wat de achterliggende oorzaak is van bevindingen zoals het ontbreken of niet effectief zijn van beheersingsmaatregelen. Met dit inzicht kunnen zowel kleine als grote ondernemingen aan de slag om de interne beheersing van risico’s binnen de organisatie verder te versterken. Dit draagt bij aan het succes van de organisatie.

Literatuur

[Bast04] Drs. A.R.J. Basten RE, De invloed van automatisering op AO/IC, Compact 2004/3.

[CMMI02] CMMI Product Team, Capability Maturity Model® Integration (CMMISM), Version 1.1, Software Engineering Institute, Carnegie Mellon University/SEI-2002-TR-012. Pittsburg, PA.

[Hals13] F. Halsema, Een lastig gesprek: Advies Commissie Behoorlijk Bestuur, september 2013.

[Heus00] R.S. de Heus en M.T.L. Stremmelaar, Auditen van soft controls, 2000.

[Kapt03] M. Kaptein en V. Kerklaan, Controlling the ‘soft controls’, Management Control & Accounting, vol. 7, nr. 6, pp. 8-13, 2003.

[Kapt10] M. Kaptein en Ph. Wallage, Assurance over gedrag en de rol van soft controls: een lonkend perspectief, Maandblad voor Accountancy en Bedrijfseconomie, vol. 84, nr 12, pp. 623-632, 2010.

[Kapt11] S.P. Kaptein, Waarom goede mensen soms de verkeerde dingen doen: 52 bespiegelingen over ethiek op het werk. Amsterdam: Business Contact, 2011.

[Kapt13] S.P. Kaptein, Soft-controls in de MKB-praktijk: een handreiking, Leidraad voor de Accountant, pp. 80, A.2.7-01-22, 2013.

[Katz05] T. Katz-Navon, E. Naveh and Z. Stern, Safety climate in health care organizations: a multidimensional approach, Academy of Management Journal, 48 (6), pp. 1075-1089, 2005.

[Lück15] Prof. dr. M. Lückerath-Rovers en prof. dr. A. de Bos RA, Nationaal Commissarissen onderzoek 2014: de commissaris en de accountant, januari 2015.

[Neis01] Prof. A.W. Neisingh RE RA, Accountantscontrole en informatietechnologie: ‘bij elkaar deugen ze niet en van elkaar meugen ze niet’, Compact 2002/4.

Data Driven Compliance

De hoeveelheid wet- en regelgeving en daarmee compliancethema’s nemen steeds meer toe en bedrijfsprocessen worden steeds complexer. Een groot deel van de complexiteit en inspanning die het kost om naleving van wet- en regelgeving te toetsen ontstaat doordat er in compliancesilo’s wordt gewerkt. De huidige stand van de techniek maakt het echter mogelijk om te kiezen voor een overkoepelende en gegevensgerichte benadering. In dit artikel wordt het concept van Data Driven Compliance toegelicht, waarmee het voldoen aan verschillende relevante wet- en regelgeving naar een hoger niveau wordt getild door het gegevensgericht toetsen en monitoren van transacties, processen en communicatie.

Inleiding

Het concept van Data Driven Compliance is ontstaan naar aanleiding van de ‘miljoenen boetes’ die grote internationale ondernemingen de laatste jaren hebben ontvangen. In de media zijn voldoende voorbeelden te vinden van dergelijke ondernemingen die enorme boetes hebben gekregen voor overtredingen of onvoldoende controle op omkoping en corruptie, kartelvorming, witwassen en het schenden van handelssancties. In de eerste helft van 2014 heeft de Office of Foreign Assets Control (OFAC) bijna $ 1.2 miljard aan boetes uitgedeeld voor overtredingen van sanctiewetgeving. Sinds 2008 zijn er boetes uitgedeeld voor omkoping en corruptie met afzonderlijke bedragen van € 100.000 tot meer dan € 1 miljard. Hadden deze ondernemingen geen complianceprogramma of beheersingsmaatregelen ingesteld? Waarschijnlijk wel, maar toch is met onderzoek (door of in opdracht van de toezichthouder) in historische data non-compliance aangetoond. Het proactief monitoren op deze belangrijke ‘compliancedata’ had dus de non-compliance vroegtijdig kunnen signaleren en de miljoenen euro’s aan boetes kunnen voorkomen.

Huidige stand van zaken

Complianceafdelingen van grote ondernemingen worden veelal bemand door medewerkers met een juridische achtergrond met veel kennis op het gebied van wet- en regelgeving. Er zijn weinig professionals met zowel een juridische achtergrond als een achtergrond in IT. Dit veroorzaakt een kloof tussen IT en compliance, waardoor men niet in staat is de reeds aanwezige omvangrijke databestanden met informatie over de mate van compliance in de bedrijfsvoering volledig te benutten.

Het proactief analyseren van gestructureerde compliancedata (bijvoorbeeld transactiegegevens of historische rentestanden) om aan te tonen dat een onderneming compliant is met wet- en regelgeving, wordt momenteel weinig toegepast. Dit terwijl bijvoorbeeld rentestandmanipulatie met de juiste analyses wel degelijk is aan te tonen. Het proactief analyseren van ongestructureerde data (bijvoorbeeld e-mailgegevens of voicedata) wordt op het moment niet of slechts beperkt toegepast.

Compliancethema’s zoals Anti-Money Laundering (AML), Anti-Bribery & Corruption en Foreign Account Tax and Compliance Act (FATCA) worden van oudsher individueel behandeld. Binnen complianceafdelingen van grote ondernemingen zijn vaak specialisten per thema werkzaam. Het voordeel hiervan is dat de complexe en veelvuldig veranderende materie beter ingevuld en bijgehouden wordt. Het nadeel is echter dat beleid en beheersingsmaatregelen in compliancesilo’s binnen de onderneming worden uitgewerkt en het uitvoeren van deze maatregelen voor de operationele afdelingen binnen de onderneming een onnodig zware belasting kan zijn. Dit is grafisch weergegeven in figuur 1 (links). Deze compliancethema’s hebben ieder hun eigen beheersingsmaatregelen, zoals klantidentificatie, het screenen van relaties, het monitoren van communicatie of financiële transacties en ratio’s. Hoewel er op detailniveau verschillen kunnen zijn in de wet- en regelgeving kan het ook een operationeel voordeel opleveren als er een overkoepelend control framework wordt ingericht en daarbij gebruik wordt gemaakt van een gegevensgerichte benadering. Dit laatste is ook weergegeven in figuur 1 (rechts).

C-2014-4-Ozer-01

Figuur 1. Behalen van efficiëntie door overkoepelend control framework met integrale benadering.

Het overbruggen van de kloof tussen compliance en IT, het proactief analyseren van zowel gestructureerde als ongestructureerde data en het doorbreken van de individuele silo’s is naar onze mening een grote stap richting het beter mitigeren van compliancerisico’s. Dit noemen wij Data Driven Compliance.

Aanpak voor Data Driven Compliance

Het proces voor de inrichting van Data Driven Compliance is in figuur 2 in drie stappen weergegeven.

C-2014-4-Ozer-02

Figuur 2. Algemeen compliancemonitoringproces.

Risk Assessment

De eerste stap in de aanpak voor Data Driven Compliance is een lichte aanpassing op de traditionele risicogebaseerde benadering. In plaats van kans en impact, worden relevantie en compliancerisico tegen elkaar afgezet. Relevantie wordt bepaald door elementen als de sector, de jurisdictie en het wel of niet onder toezicht staan van de onderneming. Het compliancerisico wordt bepaald door de mate waarmee de onderneming het compliancerisico heeft afgedekt. Om het Risk Assessment-proces te begeleiden is er een app ontwikkeld waarmee een risicoprofiel kan worden bepaald. De app voert een quick-scan uit door middel van vragen die de relevantie van compliancethema’s en compliancerisico’s bepalen. Het resultaat wordt weergegeven in een risicomatrix. Een voorbeeldvraag en resulterende risicomatrix zijn weergegeven in figuur 3.

C-2014-4-Ozer-03-klein

Figuur 3. Voorbeeld compliancerisicovraag (links) en (rechts) voorbeeld resulterende matrix op een vijftal compliancethema’s. [Klik op de afbeelding voor een grotere afbeelding]

Identificatie van Key Compliance Indicatoren

Per compliancethema dat naar voren is gekomen uit de Risk Assessment kunnen Key Compliance Indicatoren (KCI) worden opgesteld die samen het niveau van compliance kunnen kwantificeren.

KCI’s komen voort uit de wetgeving rondom de compliancethema’s, uit doelstellingen van de onderneming of uit aanwijzingen van de toezichthouder. Een voorbeeld van een KCI is het aantal transacties dat heeft plaatsgevonden naar gesanctioneerde landen zoals Iran en Cuba. Dit soort transacties is vanuit de sanctiewetgeving beperkt toegestaan. Een ander voorbeeld met betrekking tot communicatie van medewerkers is de aanwezigheid van termen die relateren tot schendingen van wet- en regelgeving, zoals ‘gaan we regelen’, ‘prijs‘ of ‘omzeilen’.

Compliancemonitoring

Tot zover nog geen technisch of complex verhaal. De kracht van Data Driven Compliance is eerder beschreven als het overbruggen van de kloof tussen compliance en IT, het proactief analyseren van zowel gestructureerde als ongestructureerde data en het doorbreken van barrières tussen individuele compliancesilo’s. De eerste twee hierboven genoemde stappen gaan over het doorbreken van de barrières tussen de verschillende compliancesilo’s. Bij de derde stap gaat het vooral om de proactieve analyse van data en het slaan van een brug tussen compliance en IT. Hier moeten namelijk de eerder opgestelde KCI’s berekend worden op basis van grote hoeveelheden gegevens die in diverse hoeken van de IT-infrastructuur zijn opgeslagen. Gezien de moeilijkheidsgraad om dit te bewerkstelligen, zullen we hier nader op ingaan in het vervolg van dit artikel. De compliancemonitoringstap in figuur 2 kan in vijf onderdelen worden verdeeld. Deze zijn visueel weergegeven in figuur 4.

C-2014-4-Ozer-04

Figuur 4. Het omzetten van ‘compliancedata’ naar compliancemonitoring.

Bepalen van de scope

De eerder opgestelde KCI’s dienen verder uitgewerkt te worden in technische vereisten, waarin de koppeling wordt gelegd naar data. Deze data kan worden gecategoriseerd in gestructureerde data en ongestructureerde data. Gestructureerde data varieert van Excel en ERP tot systemen die logs van fysieke toegangspoorten vastleggen. Met reeds beschikbare analysetools kan vaak al relatief snel inzicht in deze data verkregen worden. Bij ongestructureerde data gaat het om bijvoorbeeld e-mail, documenten, chatberichten (zoals Lync, Reuters of Bloomberg chat), sociale media en zelfs opgenomen telefoongesprekken. In bepaalde gevallen is non-compliance vooral te ontdekken in ongestructureerde data (zoals bij communicatie ten behoeve van het manipuleren van rentestanden), waarbij in andere situaties gestructureerde data de signalen van non-compliance zal bevatten (zoals transacties naar gesanctioneerde landen of organisaties). Om deze reden is de combinatie van gestructureerde data en ongestructureerde data essentieel.

Het is van belang om voldoende tijd te besteden aan het bepalen welke brongegevens relevant zijn en daarin weloverwogen keuzes te maken. Het achteraf wijzigen van deze scope leidt namelijk tot een additionele investering van tijd en kosten die vaak vele malen groter is dan wanneer dit van tevoren al bekend was.

Als het gaat om communicatie, dan bevinden aanknopingspunten voor non-compliance op basis van onze ervaring zich met name in de informele kanalen (bijvoorbeeld chat, sms of WhatsApp) omdat men vaak de formele communicatiekanalen (zoals e-mail) probeert te omzeilen.

Verzamelen en verwerken van gegevens

Om compliancemonitoring te kunnen uitvoeren dient de brondata op periodieke of continue basis te worden ontsloten. Het verdient aanbeveling om deze gegevens vervolgens in één omgeving samen te brengen. Hierdoor kunnen op een later moment analyses gebruikmaken van meerdere bronnen en heeft men bij het vinden van non-compliancesignalen direct toegang tot alle daaraan verwante gegevens (zoals communicatie die rond hetzelfde tijdstip heeft plaatsgevonden).

Om inzicht te kunnen verkrijgen in de ontsloten gegevens is er vaak een aantal voorbewerkingsslagen vereist. Dit is een bekend concept binnen het data-analysedomein, met het verschil dat de monitoring van compliance veelal betrekking heeft op grote hoeveelheden ongestructureerde data. Om hier inzicht in te verkrijgen en analyses op te verrichten kunnen technieken worden ingezet uit de forensische wereld. Met deze zogenaamde ‘eDiscovery tools’ kan er een voorverwerking plaatsvinden op bijvoorbeeld grote hoeveelheden e-mails, chatberichten en audiobestanden waardoor men zeer efficiënt dergelijke bestanden kan doorzoeken.

Filteren van gegevens door slimme analyses

Tijdens de analysestap dienen de KCI’s vertaald te worden naar technische zoekslagen welke op periodieke of continue basis zullen worden uitgevoerd. Bij de monitoring van compliance ligt de uitdaging in het definiëren hoe non-compliance tot uiting komt in ongestructureerde data. Dit kan bijvoorbeeld door zoekwoorden toe te passen die men in geval van non-compliance verwacht aan te treffen in communicaties van medewerkers. Een belangrijke afweging in dit proces is dat de zoekwoorden breed genoeg gedefinieerd moeten worden om spelfouten, afkortingen of codetaal te kunnen ondervangen, terwijl de keerzijde is dat te breed gedefinieerde zoektermen kunnen leiden tot grote hoeveelheden ‘false positives’.

Review

Review wordt over het algemeen gezien als een manuele en tijdrovende stap. Bij ongestructureerde data is het een belangrijk onderdeel om beter inzicht in de data te verkrijgen en het reduceren van ‘false positives’. Daarnaast levert de review input voor een feedback-loop waarmee de precisie van de zoekwoorden verhoogd wordt. Na verloop van tijd kunnen slimmere algoritmes ontwikkeld worden waardoor de tijd benodigd voor reviewwerkzaamheden drastisch omlaag wordt gebracht. Een voorbeeld hiervan is het uitsluiten van resultaten die meldingen opleveren door aanwezigheid van termen als ‘omkoping’, terwijl de desbetreffende communicaties gaan over het interne beleid van de onderneming. Daarnaast kunnen tijdens de review ook patronen of codewoorden ontdekt worden, die medewerkers gebruiken om ontdekking te voorkomen, waarmee vervolgens de analyses ook weer geoptimaliseerd worden.

Monitoring

Het resultaat van voorgaande stappen is het monitoren van de compliancerisico’s van de onderneming door middel van een compliance-dashboard. Dit dashboard biedt een visuele helikopterview op de KCI-data en helpt daarmee overzicht te creëren. Hierdoor ontstaat real-time inzicht in wat compliant en non-compliant is. De hierboven beschreven werkwijze maakt het ook mogelijk om vanuit het dashboard door middel van ‘drill-down’ in de details te duiken. Zo worden afwijkingen zichtbaar en is gericht ingrijpen vroegtijdig mogelijk waardoor boetes en sancties voorkomen worden. Het dashboard kan geïntegreerd worden in bestaande KPI’s van de onderneming, waardoor het belang van KCI’s weer wordt gestimuleerd.

Casus

Probleemstelling

Veel internationale financiële instellingen hebben in de afgelopen jaren te maken gehad met de manipulatie van rentestanden die plaatsvond binnen de eigen bedrijfsvoering en de daarmee gemoeide boetes van autoriteiten uit diverse landen. Hierdoor is een behoefte ontstaan om de communicatie van medewerkers op de handelsvloer op continue basis onder de loep te nemen zodat er bij een incident direct ingegrepen kan worden.

De hoeveelheid communicatie die in de gemiddelde internationale financiële instelling op dagelijkse basis plaatsvindt, is echter enorm. Medewerkers sturen honderden e-mails per dag, zijn continu via chatprogramma’s in gesprek met collega’s en hebben vaak meerdere telefoonlijnen tot hun beschikking. Dit leidt ertoe dat de hoeveelheid gegevens die dagelijks dienen te worden verzameld vanuit deze diverse media, tot in de terabytes loopt en vaak verspreid is opgeslagen over verschillende locaties en IT-systemen. Naast dat de real-time verzameling van deze gegevens een complex vraagstuk is, is het onrealistisch om met alle communicaties mee te lezen of luisteren.

Aanpak

Voor een specifieke internationale financiële instelling hebben wij de volgende aanpak gehanteerd. De aanpak voor de monitoring van communicaties volgde de stappen zoals uitgebeeld in figuur 4. De bepaling van de scope vond initieel plaats en de daaropvolgende stappen werden op continue basis uitgevoerd. Tijdens de implementatie van deze stappen moesten er verschillende afwegingen gemaakt worden. Zo kon de instelling enerzijds het proces van verzamelen, verwerken en reviewen van de communicaties volledig uit handen geven aan een externe partij. Anderzijds konden ze dit proces inregelen binnen de organisatie van de financiële instelling zelf. Een belangrijk voordeel van het uit handen geven was dat de monitoring zeer snel operationeel kon zijn en uitgevoerd zou worden door professionals die hier reeds meerdere jaren ervaring mee hadden. Hierbij kwam wel een extra stuk complexiteit kijken omdat er rekening gehouden moest worden met interne en externe privacyregels.

Bij het intern inregelen van het proces kon de financiële instelling zelf de benodigde kennis en ervaring opbouwen en intern delen en konden medewerkers opgeleid worden voor het uitvoeren van de technische en reviewwerkzaamheden. Hier zou echter meer tijd mee gemoeid zijn en dit zou ook een investering vereisen in de aanschaf van nieuwe technologie, de aanpassing van de bestaande IT-infrastructuur en de opleiding van medewerkers.

Toegevoegde waarde voor de klant

De financiële instelling in kwestie heeft ervoor gekozen om van beide voornoemde oplossingen gebruik te maken. Om op de korte termijn inzicht te hebben in mogelijke complianceovertredingen, heeft de instelling de externe partij gevraagd direct te beginnen met het monitoren van communicaties van handelaren. Ondertussen kan vervolgens gewerkt worden aan het opzetten van een monitoringproces binnen de onderneming zelf en het trainen van de eigen medewerkers.

De communicatie van honderden medewerkers wordt op dit moment op real-time basis gescreend en gereviewd op non-compliance. Dit biedt de mogelijkheid om continu controle te hebben over mogelijke complianceovertredingen. Verzoeken vanuit autoriteiten hoeven daardoor niet meer tot verrassingen te leiden en miljoenenboetes en daarbij behorende reputatieschade kunnen zodoende worden voorkomen. Monitoring heeft ook een preventieve werking zodra medewerkers op risicovolle posities weten dat er gemonitord wordt.

Voordelen

De voordelen van de beschreven aanpak spreken voor zich: ondernemingen vermijden boetes van toezichthouders, reputatieschade, en creëren synergievoordelen door de naleving van (extraterritoriale) wetgeving integraal te realiseren. Het bieden van transparantie op basis van data zal, naast het in-control zijn en het inzicht verschaffen, in toenemende mate van invloed zijn op de reputatie en het succes van ondernemingen. Het is een aanpak die de vereisten van toezichthouders vooraf in kaart brengt en de naleving ervan aantoonbaar maakt. Met andere woorden, compliant en 100% transparant zijn doordat alle relevante feiten bekend zijn.

Conclusie

In dit artikel is een concept beschreven dat ondernemingen kan helpen met het beter beheersen en meten van hun compliancerisico’s. Toegelicht is hoe er, in tegenstelling tot hoe voorheen deze risico’s per compliancethema werden behandeld, efficiëntievoordeel behaald kan worden door specifieke vereisten binnen thema’s te combineren en gebruik te maken van de overlap die deze thema’s bevatten.

Er is stilgestaan bij de hoeveelheid compliancedata die een onderneming registreert of kan registreren. Door gerichter gebruik te maken van deze data kunnen ondernemingen aantoonbaar maken dat ze compliant zijn met bepaalde wet- en regelgeving. Is dit niet het geval, dan kunnen ze non-compliance proactief adresseren en daarmee hoge boetes of reputatieschade vermijden.

Door op een andere wijze naar data te kijken en door naast gestructureerde data ook ongestructureerde data te analyseren, kan de vraag ‘hoe compliant is mijn onderneming’ beter beantwoord worden. Door real-time te monitoren op communicatie kan non-compliance vroegtijdig gedetecteerd worden, terwijl dit met traditionele methoden pas naar voren zou komen wanneer het te laat is.

Fraud Detection Tools That Outsmart Fraudsters

History shows that fraudsters are very innovative and have developed a wide range of schemes to commit and hide fraud, like we have seen in the recent Libor scandals. In order to stop fraudsters, many organizations are looking for effective countermeasures to outsmart them. The increasing amount of available data provides new opportunities for innovative techniques to detect suspected fraudulent behavior. These techniques use characteristics from the data that fraudsters are unaware of or is extremely difficult for them to control. This approach helps fraud investigators to find signs of fraud they did not even know existed. By being innovative themselves, investigators prevent fraudsters’ schemes from succeeding.

Introduction

Analysis of fraud cases shows that the typical fraudster is 36 to 45 years old, generally acting against his or her own organization, and mostly employed in an executive, finance, operations or sales/marketing role ([KPMG13]). Above all, fraudsters are creative. Although creativity cannot be measured, the history of fraud cases reveals how creative the fraudsters are. Fraudsters exploit a wide range of vulnerabilities, from doing business with nonexistent customers, like Satyam did to inflate revenues, to executing complex financial transactions, such as Enron did to hide their debt. When the fraud is detected by investigators, the fraudsters will continue innovating to cover it up. To prevent and detect fraud, organizations need to be more innovative than the fraudsters and always one step ahead of them. We need methods so advanced and complex that they can detect even the most subtle and innovative acts of fraud, yet so simple that they are easy to use.

Any fraud investigation will start by setting out the topics and questions for investigation. Choosing which method to employ to identify possible fraudulent behavior depends on these questions. Which methods are most applicable is further limited by the available data. Several innovative solutions to detect signs of fraud activity using various types of data exist, and more are being developed. The next sections describe some of these solutions.

Innovative methods to detect signs of fraud

Investigators using traditional methods search large volumes of data for known signs of fraud, signs they already know based on their previous experience ([Rijn11]). However, such an investigation will only uncover the tip of the iceberg. To outsmart fraudsters we need methods that will also detect anomalies that may be signs of fraud, signs that investigators were not already looking for and frauds they were not already aware of. In other words, instead of looking for “things I know that I don’t know about the data,” investigators need to find “things I don’t know that I don’t know about the data,” as illustrated in Figure 1.

C-2014-4-Fissette-01

Figure 1. Information extraction pyramid.

The ever-growing amount of data poses challenges for traditional fraud investigations that will only identify a small part of the actual scams. But large volumes of data also presents opportunities for new and innovative detection methods. As data is generated following fraudulent acts, it becomes increasingly difficult for the fraudster to mask the fraud by controlling and manipulating this data trail. New analysis tools and methods can detect subtle anomalies and patterns in large amounts of data, turning the challenge of large volumes of data into an opportunity.

Pattern recognition

There is a class of innovative solutions based on recognizing patterns in data. Pattern recognition itself is not a new concept. In fact, humans perform pattern recognition on a daily basis. For example, recognizing an object as a banana is a pattern-recognition task. Humans learn to recognize bananas based on a combination of features including color, shape and size; the values for these features for a banana are “yellow,” “curved cylinder” and “15-25 cm long.” Pattern-recognition methods are based on the same principle. They use features to make inferences about the data.

The advantage of automatic pattern-recognition methods is that they can be used to read the data to learn the features of a scam. Users of these techniques do not need to define which features and values they are looking for. As a result, these methods identify things you didn’t know that you didn’t know about the data. Just as we recognize bananas based on their features, it is possible to recognize signs of fraud using specific features. For example, features describing pharmaceutical health-insurance claims include the age and gender of the patients, expenses of the claims and the dispatch rate of the medicine. When the values for these features deviate from the expected values, that may indicate fraud with the insurance claims. The insurance claims for one person who received medicine worth 60,000 euros on multiple days in a year stand out, as compared to the pattern of insurance claims of other patients. Pattern-recognition methods are able to identify combinations of a large number of features to detect deviating, possibly fraudulent, behavior.

A Bayesian network is a method that is suitable for detecting deviation from a pattern. A Bayesian network learns the relation between features. Features that are dependent on each other are connected. For example, where a transaction is entered by a user who is an employee, the date and time of that transaction should correspond to the time of day and day of the week that the employee is known to be working. The simple Bayesian network of this example is given in Figure 2.

C-2014-4-Fissette-02

Figure 2. Simple Bayesian network.

A Bayesian network develops probability distributions that explain how the nodes and arrows interact. For example, Figure 3 shows how the user and day of the week are correlated. Since Mary never works on Mondays, the probability that Mary entered a transaction on Monday is zero. Hence Bayesian networks are able to construct probable scenarios from many features of transactions. Subsequently, the network and probability distributions are used to give a score to each possible scenario. This score indicates the likelihood of the combination of specific feature values of that scenario occurring. A very low likelihood score indicates a deviation from a pattern, which may be the result of fraud ([Rijn11]). The likelihood score of a transaction being entered by Mary on Monday is very low. So, when the pattern-recognition method finds such a transaction, it may have found a fraudulent activity. Fraud is confirmed when further investigation of the transaction reveals that Peter the cleaner used Mary’s account to transfer money to a friend’s bank account.

C-2014-4-Fissette-03

Figure 3. Probability of combinations of day of the week and presence of employee.

Process-mining techniques, a subfield of data-mining techniques, extract features from the event logs created by Enterprise Resource Planning (ERP) systems to identify business processes. These features include which activities are executed when and by whom. Process-mining techniques are able to extract the actual processes instead of the designed process. A discrepancy between the actual and designed process may indicate a violation of the procedures and therefore be a sign of fraudulent behavior ([Jans11]). Furthermore, process-mining techniques can show incomplete or incorrect processes, which could pose a risk of fraud.

Visual analysis

Visualization methods combine computational power with human pattern-recognition capabilities ([Keim06]). These methods convert complicated data into a comprehensible visual representation. Humans are able to derive useful information from this visual representation. This principle is already used in simple graphs and bar charts. These graphs and charts summarize data in a way that makes the information easier for people to grasp than if they were to try to understand it from the source data records alone. Complex graphs may be 3-dimensional and add additional information by using color. Figure 4 gives an example of a complex visualization. Increasingly innovative methods produce more advanced visualizations and allow the user to interact with this output and the underlying data. This way visualization methods can reveal unusual patterns that may indicate fraudulent behavior that is not apparent from the original data.

C-2014-4-Fissette-04

Figure 4. Example of a complex visualization.

The tool Visual Ledger is an example of an innovative method that applies visual analysis methods to visualize the series of transactions present in the general ledger. A general ledger records all the transactions relating to a company’s assets, liabilities, equity, revenue and expenses. Business processes (for example, the procurement process) result in predictable series of transactions that affect a series of general ledger accounts. Accountants rely on their knowledge and expertise to know which series are expected. Therefore accountants are able to identify any series of transactions that deviates from the expected norm. It is possible to follow these series manually. However, due to the large number of transactions in a general ledger, manual analysis is only possible for a sample of the data. Using Visual Ledger it is possible to analyze all such series of transactions. Figure 5 shows a schematic overview of the visualization produced by Visual Ledger. The tool allows the user to zoom in on the transaction details between two accounts.

C-2014-4-Fissette-05-klein

Figure 5. Schematic overview of the visualization produced by Visual Ledger. The tool allows the user to zoom in on transaction details. [Click on the image for a larger image]

The general ledger does not explicitly segregate a series of transactions. The general ledger contains all transactions performed on the general ledger accounts, but does not register which changes belong together or which succeed each other. This information is necessary to detect fraudulent behavior among the transactions. Therefore, the tool first segregates a series of transactions based on the information that is registered in the general ledger. After identifying the series of transactions, a visualization of this series is constructed.

For visualization tools to be easy to use, the visualization needs to be intuitive ([Keim06]). As an example, Visual Ledger shows how cash and cash equivalents flow into and out of the organization. Visualizing all accounts of an organization not feasible, due to the large number of accounts. However, these accounts can be grouped into larger more high-level categories ([Rijn13]). By interacting with the tool, the user is able to retrieve specific account and transaction details. Accountants can use the tool to identify unusual money flows by combining the visualization with their knowledge of what is normal for the organization. The accountant can retrieve the transaction details of the unusual flows to judge whether further investigation is required.

Text analysis

Pattern-recognition and visual-analysis methods are very useful for analyzing structured data. In addition to structured data, organizations have large amounts of unstructured data in the form of textual documents. These documents contain a wealth of information that can also be used to detect signs of fraud. The use of text in fraud investigations is not new. Descriptions of transactions are analyzed as part of ongoing anti-money-laundering measures, and e-mails are searched based on keywords. Innovative text-analysis methods automatically scan texts according to certain characteristics. These characteristics are used to analyze the texts. As a result of unconscious psychological processes, writers disclose identifiable personal characteristics or clues about whether they know the text to be truthful. Therefore, it is potentially possible to identify the author of a text or determine whether a document is likely to be fraudulent ([Fiss13], [Mark14]).

One advantage of these screening tools is that automatic text-analysis methods, unlike manual analysis, are objective. Just like the pattern-recognition techniques, the method defines features based on the data. Text-analysis methods use linguistic features extracted from the texts to detect patterns. Examples of commonly used linguistic features are word counts and grammatical word classes. Figure 6 gives an example of the word counts for two sentences. From these word counts it can be concluded that the sentences are most likely about data, and more specifically about structured data. Grammatical word classes can be extracted automatically to provide additional information about words. Figure 7 gives an example of the word classes for the sentence “The man has a large blue car.” The papers of disgraced scientist Diederik Stapel that contained fraudulent data he had knowingly manipulated used fewer adjectives than his accurate papers on his legitimate research. He also used more words that expressed certainty about the results in his fraudulent papers, as compared to the legitimate papers ([Mark14]).

C-2014-4-Fissette-06

Figure 6. Example of word counts for two sentences.

C-2014-4-Fissette-07

Figure 7. Example of word classes extracted from the sentence “The man has a large blue car.”

Another advantage of these screening tools is that automatic text analysis is very efficient. The manual analysis of texts is time-consuming, considering the large amount of textual documents an organization has. It is not feasible to analyze all these documents. Automatic text analysis overcomes this problem. This provides the opportunity to analyze more and larger documents. For example, a large number of annual reports can be analyzed. In the past, analysis of annual reports has focused on the financial information. However, in the last couple of years the amount of textual disclosures in annual reports has increased. These texts may contain clues indicating the presence of fraud. Currently, a method is being developed to test whether annual reports of companies where fraud was committed can be distinguished from non-fraudulent reports, based on the linguistic features of the texts.

Analysis of digital behavior

Information containing signs of fraud is not only present in the financial data and textual documents of an organization. It is also in the behavior of its employees. A lot of this behavior is captured digitally on websites and social media. Behavioral expressions can be analyzed using open-source intelligence methods. The results of these analyses can be used in several types of fraud investigations.

For example, sentiment-analysis methods can be used to analyze the writers’ emotions. These methods identify whether a piece of text contains a positive or negative emotion, or they detect a more specific emotional state of the writer. These methods can, for example, discern from a message whether the writer was happy, sad or angry. These emotions can be used in subsequent analyses. For example, sentiment can be used to distinguish true hotel reviews from deceptive hotel reviews ([Yoo09]). To prevent fraud within an organization, sentiment analysis can be used to assess the emotions and behaviors of employees. When necessary, the organization can take measures to influence the behavior of its employees, reducing the probability that dissatisfied employees will commit fraud.

Sentiment analysis uses information contained in the messages themselves. However, all documents and social media messages also have metadata that describes the document or social media message. Examples of this type of information include the name of the document author, the time of creation and location of the network on which the document was created. Metadata is stored automatically and is nearly impossible for fraudsters to influence. For insurance companies, the metadata can be very useful in determining whether insurance claims are false. For example, when a policyholder files a claim for car damage that happened in Amsterdam, metadata from social media may show that the policyholder was in New York at the time of the claimed car damage.

Metadata, optionally in combination with the actual messages and other information on websites, can be used to extract information about social networks. These networks determine which people know each other and how close their relationship is. This information can be useful in fraud investigations. For example, when John approves insurance claims a social network can show that he also approved a claim for his neighbor Jane. Figure 8 shows a very simplified social network for John, showing that he is closely related to Jane. Further investigation of the relation between Jane and John shows that they are in a close relationship. The false insurance claim was filed to cover the costs of a joint vacation.

C-2014-4-Fissette-08

Figure 8 .Simple social network showing the relations of John.

Conclusion

Depending on the data available and the questions fraud investigators ask, an investigator can choose among several innovative solutions that are already available (or will be in the future). Each of the previously discussed methods makes use of the large amounts of available data and is able to find signs of fraud you did not know you were even looking for. These methods extract patterns from a combination of a large number of data features. It would be difficult for a fraudster to manipulate all these features in such a way that they would follow the normal patterns. Therefore, these methods have the ability to outsmart the fraudsters. With these solutions we are one step ahead. In the future, methods like the ones described will be able to predict fraud before it even happens, based on the data trails at the very early stages of fraudulent actions. With such methods we are even several steps ahead of fraudsters.

References

[Fiss13] M. Fissette, Author Identification Using Text Mining, De Connectie, 2013.

[Jans11] M. Jans, J. Martijn van der Werf, N. Lybaert and K. Vanhoof. A Business Process Mining Application for Internal Transaction Fraud Mitigation. Expert Systems With Applications, 38:13351-13359, 2011.

[Keim06] D.A. Keim, F. Mansmann, J. Schneidewind and H. Ziegler, Challenges in Visual Data Analysis. In: Proceedings of the conference on Information Visualization IV ’06, IEEE Computer Society, 2006.

[KPMG13] KPMG, Global Profiles of the Fraudster, 2013.

[Mark14] D.M. Markowitz and J.T. Hancock, Linguistic Traces of a Scientific Fraud: The Case of Diederik Stapel, PLoS ONE 9(8): e105937. doi:10.1371/journal.pone.0105937, 2014.

[Rijn11] Q. Rijnders, P. Özer, V. Blankers and T. Eijken, Zelflerende software detecteert opvallende transacties, MAB 3, 2011.

[Rijn13] Q. Rijnders, T. Eijken, M. Fissette and J. van Schijndel, Behoefte aan visuele technieken voor verbetering controle, MAB 6, 2013.

 [Yoo09] K. Yoo and U. Gretzel, Comparison of deceptive and truthful travel reviews, Information and Communication Technologies in Tourism 2009: Proceedings of the International Conference. Vienna, Austria: Springer Verlag, 2009.

Information Protection… Back to the Future

Tony Buffomante, Principal, KPMG in the US, joined KPMG in the US in 2004 after spending the previous 10 years of his career managing information security for a $ 42 billion retailer and spending time as an information security consultant for global organizations. He is currently leading the information protection and business resilience in the Central United States from the Chicago office and serves a number of global clients across industry sectors.

Marty McFly: “Wait a minute, Doc. Ah… Are you telling me that you built a time machine… out of a DeLorean?”

Dr. Emmett Brown: “The way I see it, if you’re gonna build a time machine into a car, why not do it with some style?”

In the mid 80’s, Emmett Brown was looking for 1.21 gigawatts of power to travel back in time, personal computers were starting to pave the way for how organizations could empower employees to work with data, and speaking of style….I was roaming the school hallways in the coolest pair of acid-wash jeans anyone had ever seen. We’ve learned a lot since then…how to turn cars into spaceship-like machines, how to interact with computers in all aspects of our lives, and maybe even a thing or two about fashion (ok, ok, I still like a pair of white puma hi-tops untied with the big tongue hanging out, but that’s a different story altogether)!

One thing we knew back then, however,…just like Dr. Brown trying to get his machine to work…was that the information we had at our fingertips was power…in our personal lives or in business. It was all about the data!

When I started analyzing computer security in the early 90’s, companies were very concerned about this new technology called the internet. How do they get on-line? How do they leverage automation like email and services to quickly move data files from one location to another? Could they communicate with customers in a new way? We spent a lot of time building physical security around data centers that housed company computing resources, tried to build “walls” around company networks with technology solutions, and educated users on how to access information they needed to do their jobs in this new way.

Over the years, the information security industry has certainly evolved, due to rapid technology advancements, a changing regulatory climate and the proliferation of new business models for information-security tools vendors and service providers. Oh…and let’s not forget about the fact that the bad guys have figured out ways to monetize their efforts vs. just being cool and showing off to their buddies.  

Nowadays clients are dealing with:

  1. More advanced and resourceful adversaries
  2. The proliferation of data via technologies such as Cloud, Social Media and Data Analytics
  3. Increased regulatory pressures on reporting information-security incidents to the public

Sounds like a bit of a perfect storm, doesn’t it?

So what do they currently do about it? Figure out new ways to lock down systems and the network, buy new shiny tools from security vendors who have “the solution,” and try to add more resources to the team to keep up with the pace of change. All of this of course comes with a price, and a new approach to justify the return on investment of this “insurance” program.  

Over the past 5 years, I can’t tell you how many conversations I’ve had with companies who told me they just implemented a new security system, reported a successful implementation to the board of directors, and then 3 months later had to disclose that they had been hacked.

Why is this? Well, sometimes as security practitioners, we get blinded by the shiny lights of new tools and technology. We want to win the arms-race with the bad guys by making sure our weapons are better than theirs. We place these weapons all over the company as much as we can as IT professionals, and we try to figure out what the mountain of stuff that comes out of the tools really means. Since we can’t find the real issue…more problems arise, via another attack or an audit finding. So what happens next? You guessed it: more security solutions layered on top of the program, and of course, more cost.  

So when can we learn from going “Back in Time” (other than Huey Lewis and the News were absolute musical geniuses)?

It’s all about the data.

In a world of unstructured information flying inside and out of the organization, over the network, on mobile devices; and increased collaboration with customers or partners requiring more access inside the company walls; how can we prioritize where to place our security investments? The answer is simple to say, and difficult to implement; which provides a great opportunity to assist clients with truly transforming their information security and risk management programs.

It’s all about the data.

I think some of the best advice for clients in this space sometimes is to have the IT people stop acting like legacy IT people for a bit…and start talking business language with their partners. Change the conversation from one of “sure I can code that” to:

  • What is the company strategy / initiative that we are supporting?
  • What are your key business processes that support that strategy?
  • What information is absolutely critical to those processes?
  • Where does that information live?

Only then can clients have a meaningful conversation on how to prioritize their information security efforts and apply fiscally responsible insurance. Only then can they find that needle-in-a-haystack, because the haystacks are much smaller pockets of critical information assets to look through. Only then can they go to the board and describe how information security investments are being applied to items tied directly to business success.

As we look to the future…undoubtedly we will see continued technology advancements. Self-healing networks, automatic data destruction (poof!) and true artificial intelligence will test our resolve to yet again race to implementation. Additionally, we can all expect increased regulatory challenges, further globalization, and continued pressure on IT departments to support business initiatives better, faster, cheaper. This is great news for KPMG firms as they sit squarely at the intersection of business and information technology issues.  

The ability for KPMG professionals to continue to drive the value conversations noted above will be critical to assist clients in making sound information protection and risk management decisions for the next generation and beyond. I look forward to the day when the 2030 version of Marty McFly comes back to ask me two key questions:

Hey Tony…did you know it’s all about the data?…and where the heck can I get a pair of those jeans?

Access Control Applications for SAP

Many organizations want to get a better grip on the management of SAP authorizations in order to get rid of their “authorization issues”. This has stimulated an increased use of integrated Access Control applications over the last few years. This article elaborates upon the advantages of using integrated Access Control applications, and lists a number of factors that can improve the success in implementing these applications.    

Introduction

In the last decade, organizations have come to pay more attention to internal control and risk management in ERP systems such as SAP. This increased attention is partly but not solely the result of stricter legislation. Actual daily practice has shown that authorization related controls – as a part of internal control – are still not functionally sound. Users have been assigned undesirable combinations of authorizations, and a relatively high number of users are authorized to access critical functional transactions or system functionality. In the past, management frequently initiated efforts to reconfigure their authorization processes and procedures. Unfortunately, it often turned out that problems with the assigned authorizations resurfaced after some years, which allows for undesirable segregation of duty conflicts to show up again, while the costs of control remain high.

Over the past few years, the market has responded to these issues, and a number of different integrated Access Control applications have been launched. These offer extensive opportunities for managing (emergency) users, authorization roles and facilitate the (automatic) assignment of authorization roles to users. In addition, all these applications provide support with controls, such as preventative and detective checks on segregation of duty conflicts.  In addition, these applications make it easy to see a clearer picture of the actual access risks, by means of reports and dashboards.

This article focuses on the functionality of Access Control applications (hereafter called “AC applications”) and the preconditions for a successful implementation of these applications.  

Why are authorizations so important?    

To describe authorization management, this article adopts the definition of Fijneman et al. ([Fijn01]), which is based on the IT management process:  

“… All activities related to defining, maintaining, assigning, removing and monitoring authorizations in the system”

The authorization management process can subsequently be divided into the following sub-processes:  

  • User management: all activities, including controls, related to assigning and withdrawing authorizations, as well as the registration in the system. In a practical context, the term “provisioning” is commonly used. User registration takes place on the basis of source data: for example, as recorded in an HR system. One part of user management is issuing passwords and managing special users, such as system and emergency users.[System users are users that are used by (another) system to establish an interface between systems or are required for batch purposes. An emergency user is a user which is used in cases of disaster, and often has more access rights. ] Recurring assessments and checks of the assigned authorizations also form a major part of user management.  
  • Role management: all activities, including controls, required for the definition and maintenance of authorizations within the system. There is a strong relationship between the role-management process and the change-management process. Here too, recurring checks of the authorization roles are essential.    

Authorizing access to a person or object in any SAP system is usually based on arrangements made beforehand: a policy is established for granting access, for example. These arrangements are made by the management, as a rule, and in virtually all cases they aim to ensure that risks or threats to an organization remain on an acceptable level.  

Authorizations are an integral part of the internal control system of an organization. “Segregation of duties” is based on the principle of avoiding conflicting interests within an organization. The aim is to ensure that, within a business process, a person cannot carry out several successive (critical) tasks that may result in irregularities – accidentally or on purpose – that are not discovered in time or during the normal course of the process ([ISAC01]). It is essential to an organization to identify any issues related to segregation of duties and take appropriate action. The causes of segregation of duty conflictsare discussed in the next section.    

Authorization issues  

Many organizations find that managing authorizations within SAP is a major challenge, and that assigning authorization roles and preventing segregation of duty conflicts  are time-consuming matters that result in high administration costs. Common problems in this context are:

  • a large number of unknown and unmitigated risks related to segregation of duty violations
  • authorizations that are not in line with the users’ role and responsibilities in the organization (business model)
  • excessive authorizations for system administrators and other “special” users.  

Overall,  these issues have their origins in the following causes:  

  • insufficient insight into SAP authorization roles, in the business as well as the IT organization
  • insufficient insight into the assigned authorizations
  • insufficient insight into the impact of organizational changes on existing authorizations
  • lack of attention to update authorizations in times of organizational change
  • insufficient insight into potential issues related to the segregation of duties
  • lack of control ownership
  • unclear responsibilities within the organization, so that it is not clear who is allowed to do what
  • unable to resolve authorization issues due to the complexity and lack of knowledge of the SAP Authorization concept
  • non-compliance with procedures;  

AC applications can solve the majority of the issues that concern user and role management. In the case of role assignments, functionality exists to configure  approval workflows. In addition, the workflow can include a preventative control that in case of segregation of duties violations the related risks must be approved by the financial manager beforehand. Workflows can likewise be configured for changes within authorization roles; in such cases, similar approval is required before the changes become effective. At the same time, the applications offer support when it comes to the periodic or ad-hoc checks and evaluations of the assigned authorizations in the system.  

Access Control applications

In the past, AC applications were primarily used by IT auditors who developed these applications themselves. This arose from the need to carry out audits on the logical access security of SAP in a more effective and efficient manner. This functionality predominantly involved the offline identification and detection of assigned authorizations and segregation of duty conflicts. Examples of these kind of applications are the KPMG Security Explorer and the CSI Authorization Auditor, which can be used for the periodic evaluation of the assigned authorizations. However, there is an increased need of management and the IT organization to manage the authorizations more efficiently. Within organizations, it has given rise to the goal of using “integrated” AC applications within the context of managing user roles. This will also enable preventative checks in an efficient manner.                              

There are various solutions on the market in the field of integrated AC applications for SAP. Table 1 provides a short description of three well-known AC applications.  

C-2013-3-eng-Spruit-t01

Table 1. Examples of Access Control applications.

Integrated Access Control functionality vs. controls

To stay in control over SAP authorizations, it is necessary to implement and embed certain controls in the organization and system. These controls can be identified with the help of a generally accepted information security standard. AC applications can offer support in this context by providing functionality that enable:      

  1. Insight in access risks related to segregation of duties violations and assignment of critical authorizations. This enables organizations to monitor and evaluate the assigned authorizations on a continuous basis.
  2. Controlled assignment of authorizations to users, including the documentation of mitigating controls in case segregation of duty violations are breached.
  3. Controlled authorization role changes.  
  4. Controlled use and review of “super users”.
  5. Controlled password self-service reset functionality.
  6. Documentation of the risks and rules related to critical access and segregation of duties.  

Process efficiency and cost reduction  

Apart from more “control-related” reasons to use AC applications, organizations also apply them for reasons of cost reduction and process optimization. Organizations can, for example, automate large parts of the user management process. Workflows and mobile apps enables the business to request, approve and assign authorizations without the involvement of user administrators.

Integrated AC application also contains a password self-service functionality, which enables a staff member to reset his or her password him-/herself, without involving the helpdesk.

Implement AC Applications

Figure 1 represents our recommended approach to implement AC applications. It is important to note in this context that an implementation is not limited to the technical implementation itself. Typically the aim of a project is to resolve issues in the existing authorization concept, as well as improving the related governance and processes. Our method is based on the following stages:  

  • Laying the foundation – Risk Identification and Definition In this stage, the desired segregation of duties and critical activities are defined, as well as the policy for dealing with a segregation of duty violations and user of emergency users.    
  • Laying the foundation – Technical Realization In this stage, the rules defined in the previous stage are translated into authorization objects and transaction codes. The AC Application is configured to monitor the segregation of duties and critical activities in the system and the “emergency user” functionality is implemented to allow quick wins in the Get Clean stage.
  • Getting Clean – Risk Analysis In this stage the defined  rules are used to analyze to what extend the desired segregation of duties are in place. Identified segregation of duty violations or users with access to critical activities will be reported.
  • Getting Clean – Risk Remediation In this stage, the aim is to remove identified risks by making changes in the assigned authorizations or in the roles itself. Quick wins can be realized by using advanced data analysis techniques from the KPMG F2V methodology. These analyses extend beyond the determination of whether or not a user has executed a transaction, as they also determine whether or not an actual change or entry has been made in the system.
  • Getting Clean – Risk Mitigation In this stage, the aim is to mitigate the remaining risks, by the implementation of mitigating controls in the organization and the documentation of these controls in the AC application.
  • Staying Clean – Continuous Management The aim of this stage is to optimize user management and role management processes by utilizing the functionality of AC applications
  • Staying Clean – Continuous Monitoring This stage involves the definition and implementation of procedures for ongoing monitoring of assigned authorizations and segregation of duty conflicts.

C-2013-3-eng-Spruit-01-klein

Figure 1. Recommended method for implementing Access Control. [Click on the image for a larger image]

Integration with other Continuous Control Monitoring applications

A number of AC applications are compatible with Continuous Control Monitoring (CCM) applications. SAP Access Control can be integrated with for example SAP Process Control which makes it possible to determine the effectiveness of the mitigating controls assigned in SAP Access Control via the “test of effectiveness” functionality of SAP Process Control. In addition, workflows from Process Control can be configured to review the logical access security, where reports from SAP Access Control are shown. Security Weaver and ControlPanelGRC also offer integration opportunities with their Process Auditor and Process Controls Suite.

Access Control and the IT auditor

Companies and organizations that implemented integrated AC applications prefer that the (external) auditor rely on the controls and reports of the AC application. Reasons are the desire to reduce the audit fee, but also using one and the same set of rules is also considered as a benefit. Auditors cannot simply depend on the functionality and reports of the AC applications, but first need to gain a certain degree of assurance with regard to the accuracy and completeness of the reports and the setup of the AC application, which slightly changes the  audit object. This is represented in diagram form in Figure 2.  

C-2013-3-eng-Spruit-02

Figure 2. Shift in the audit object.

Conditions for relying on AC application functionality and reports

Before depending on the reports and another functionality of AC, an auditor wants the organization to meet a number of requirements:  

  1. Segregation of duties
    • All conflicts with regard to the segregation of duties that are relevant to the auditor and accountant have been incorporated into the segregation of duty matrix used by the application.
    • The defined segregation of duty conflicts need to be translated correctly and completely into transaction codes, authorization objects with fields and values, in order to prevent false negatives, as described earlier by Hallemeesch and Vreeke ([Hall02]).
  2. The AC application has been configured to guarantee that:
    • Approvals are provided by the right approvers (e.g. users are not able to approve requests for themselves)
    • the segregation of duties check is performed on up-to-date data
    • change logs are activated to enable an audit-trail.  
  3. Procedures
    • The actual usage of super-user authorizations is reviewed  
    • Controls are in place to ensure that the AC application is not by-passed  
    • Exceptions for by-passing the AC application have been defined and documented
    • Change management procedures for configuration and segregation of duty matrix changes have been defined and implemented
  4. Authorizations
    • Authorizations within the AC application are assigned based on the roles and responsibilities of the organization.  

Control activities  

If an auditor has been able to determine that his or her conditions are met, the auditor can make use of a process-driven audit approach instead of a data-driven one.  

After the first review, there will typically be no need for an auditor to assess the segregation of duties matrix year after year. However, subsequent review will focus on the change-management. In such cases, the auditor should carry out the following actions:  

  • check the change-management process of the segregation of duties matrix
  • assess the changes and “change log” of the segregation of duties matrix.

Lessons learned

In terms of functionality the integrated AC applications offer adequate controls to realize the control objectives and are therefore a good option to help achieve these objectives. At the same time, they also offer opportunities in terms of process optimization and improve efficiency.

To succeed in getting and staying in control over SAP Authorizations with the support of an AC organization the organization would do well to:  

  • set clear objectives. The potential implications of an Access Control implementation are often far-reaching. It is important, therefore, that clear goals are set at the start of the project and that, on the basis of these objectives, a decision is taken to determine which components of the AC application are within the project’s scope. Realizing the project should be supported by a step-by-step approach.  
  • clean the authorizations beforehand, where possible, by implementing quick wins. With the help of “SAP statistics” and data analysis, unused authorizations can be deleted beforehand, and super-user functionality can be replaced by an “emergency” account. This will greatly reduce the amount of work during the Access Control project.
  • pay ongoing attention to the “human factor” whenever the AC application is being used – even though the applications contain controls to reduce the number of “errors” due to known risks or user mistakes in the field of authorizations. Devoting attention to this “human factor” will guarantee the acceptance and correct use of the application, even after project completion.  
  • carefully define the “golden rules” that are aligned with the business processes and the setup of the SAP system. The rules that define the desired segregation of duties and critical authorizations are crucial to a successful implementation.  
  • remain vigilant with respect to breaches on segregation of duties and the use of “super-user” functionality. Execute periodic evaluations to avoid a false sense of being in control. Also establish processes that validate the effectiveness of mitigating controls.

C-2013-3-eng-Spruit-03

Figure 3. lessons learned in using AC applications.

To avoid surprises at the end of an Access Control implementation project, an organization would do well to enable a role for the auditor during the project, so that it is possible to capitalize on the auditor’s findings during the implementation.  

Next steps

The current AC applications offer no solutions for advanced data analyses of actual usage by users. There is limited functionality that shows whether a user has executed an activity, but there is no functionality that actually analyze whether a user entered or changed certain transaction or master records. It is therefore impossible, for example, to determine whether users have processed invoices for orders they have placed. For this type of analysis, one still has to depend on transaction monitoring applications, as used in audits or with relative new solutions like SAP Fraud Management.

References

[ALE01] http://www.alertenterprise.com; 2010.

[Bien01] Bienen, Noordenbos and Van der Pijl, IT-auditing Aangeduid (IT Auditing Defined): NOREA Geschrift nr. 1 (NOREA Document no 1), NOREA 1998.

[CON01] http://www.controlpanelgrc.com/; 2010.

[Fijn01] Fijneman, Roos Lindgreen and Veltman, Grondslagen IT Auditing (Foundations of IT Auditing), p. 66ff, 2005.

[Hall02] Hallemeesch, Vreeke, De schijnzekerheid van SAP Authorizationtools (The False Security of Authorization Tools), 2008.

[ISAC01] ISACA, CISA Review Manual 2008, 2008.

[SAP01] http://www.sap.com/solutions/sapbusinessobjects/governance-risk-compliance/accessandauthorization/index.epx; 2010.

[SCW01] http://www.securityweaver.com; 2010.

SAP Basis Security — the crown jewels exposed

Organizations today are exposed to new security risks due to the implementation of SAP systems. Research shows that across industries these risks have been insufficiently mitigated. In addition, knowledge and tools to exploit these weaknesses are becoming easily accessible. These developments threaten the availability, continuity and particularly the reliability of the SAP system. Various vulnerable components within the SAP landscape can be secured in a relatively easy manner. However, this requires a multi-disciplinary team with capabilities within the application and the infrastructural layer.

Introduction

In the past few decades the definition of the terms ‘segregation of duties’ and ‘security’ were blurred by IT Audit and security professionals. Many SAP professionals refer to SAP security as the processes around authentication, roles and authorization profiles. The prevailing opinion is that users should only be allowed to access those functions in the system that are specifically and exclusively part of their job responsibilities and domain. This method should prevent staff from harming the organization and its system. Several organizations have invested lots of energy and efforts into their authorization concepts, partly as a requirement of the Sarbanes-Oxley Act ([Vree06]). Implementation of a sound segregation of duties concept doesn’t ensure that vulnerabilities in other (technical) aspects, such as the SAP gateway, password hashes or default internet services are automatically mitigated.  

SAP systems are becoming increasingly complex, partly due to the increase of SAP functionalities and products. Organizations are progressively implementing SAP systems in addition to the enterprise core component (ECC), unconsciously creating an expansion of access paths to confidential and valuable data: the organization’s crown jewels. Moreover, SAP embraces technologies such as Java, HTTP, SOAP, XML and open SQL. Consequently, this has resulted in the adoption of all the inherent security risks that accompany these technologies. A single vulnerability in just one of the SAP systems can potentially compromise the whole IT landscape ([Edmo11]). Organizations must immediately mitigate the vulnerabilities within SAP that have been discovered over the past few years, to protect SAP’s integrity, continuity and especially its reliability. This includes technical components such as the SAP gateway, SAP Application Server, SAP Message Server, Internet Communication Manager and SAP router, as well as hashing algorithms and various ports/services that are opened during an implementation (SAP Management Console). These subjects have been addressed in various SAP security notes.  

In the sections below, we elaborate on a number of vulnerabilities within the SAP landscape that we have encountered. We start with the password encryption method of SAP NetWeaver. Following that, we will take a closer look into SAP systems that can be accessed through the internet. We will conclude with a description of the risks caused by the absence of SAP security notes. The security and integrity of SAP at the Basis level often requires keen attention. By this article, we call for renewed attention on these aspects.  

Vulnerabilities

The password encryption method within SAP (hashes)

Within SAP, passwords are saved in the user master record table in an encrypted format. An important aspect of saving a password is the way it has been encrypted. The encryption method is also called the ‘hashing algorithm’. Hashes are irreversible encryptions that make it impossible to retrieve the original password. The hashing algorithm that is used within SAP has been modified several times over the past few years. This was provoked by shortcomings in former algorithms, which were revealed by security researchers. At the same time, password-cracking tools became increasingly effective when it came to guessing combinations of passwords, by using rainbow tables. Within a rainbow table, all possible passwords and accompanying hashes are pre-listed without the need of further calculations. Using this method, passwords can be retrieved or matched to the corresponding hash easily. Password cracking tools can be applied to assess the complexity of the passwords used.    

An efficient method to secure passwords is the use of a so-called ‘salt’, by adding a random series of characters to the password before it is encrypted. This makes it more difficult for password-cracking tools to retrieve the password. Prior to the introduction of SAP NetWeaver 7.1 or SAP NetWeaver 7.0 with Enhancement Pack 2, the user name was added as default salt for password encryption, as shown in Figure 1.  

C-2013-3-eng-Schouten-01

Figure 1. Hash function.

John the Ripper (JTR), a well-known password-cracking tool, contains a module for analyzing SAP passwords. On the internet, various tools are available to download the password hashes from the user table (USR02) and prepare them for JTR. The authors have learned by experience that approximately 5 percent of all passwords are retrieved by JTR within 60 minutes. Most likely, JTR will retrieve a user with unlimited access rights (SAP_ALL).  

On 21 February 2009, SAP introduced a security patch[https://websmp230.sap-ag.de/sap/support/notes/991968] with a robust hashing algorithm using a random salt. However, passwords that employ this new method are by default saved within the old, vulnerable format, due to compatibility requirements by other (SAP) systems. Hence, this solution is ineffective against hackers, as a weak password hash is still available. Fortunately, SAP provided security parameters to prevent hashes from being saved in the older vulnerable format.[login/password_downwards_compatibility ] Unfortunately, this solution introduces new challenges regarding the system’s connectivity with older kernels (interfacing). As a mitigating measure, authorizations that provide access to the password hashes should be restricted as much as possible. This would restrict the opportunity to view and misuse the hashes to a minimum number of people.

Unintentional exposure on the internet

Potential vulnerabilities that are frequently overlooked are included within SAP’s Internet Communication Framework services. A growing number of organizations make their SAP systems available for connections with customers, suppliers, partners and their own staff ([Poly10]). The expansion of functionalities causes organizations to expose their traditional internal systems, which were partly designed in the era of the mainframe, externally to the internet. Search engine Shodan[http://www.shodanhq.com], for e.g., gives an impression of the number of SAP systems that can be accessed via the internet. Shodan is a search engine that can determine, among other things, which software is being used per website. For instance, when this article was being written (August 2013), 7.493 SAP systems were linked to the internet via the SAP ICM (Internet Communication Manager).

C-2013-3-eng-Schouten-02

Figure 2. SAP links on the internet.

The search results from Figure 2 provide an overview of various publicly accessible SAP NetWeaver Application Servers. The majority of the SAP systems (1,762) are located in the US, followed by Germany (1,007), Mexico (409) and India (350). Making SAP functionalities available via the internet provides many advantages to organizations, but at the same time this may expose them— however unintentionally —to risks associated with the internet. SAP systems are becoming more accessible targets for cyber criminals or hackers, partly due to the exposure of vulnerabilities and misconfigurations within the (historically internal phasing) SAP system. Inherent vulnerabilities from default internet services can be misused by hackers for a targeted cyber attack. An example of a SAP service employing the so-called ‘Internet Communication Manager’ is the Info (/sap/public/info) service (refer to Figure 3). Our previous search, in Shodan, revealed various SAP servers offering this service via the internet unintentionally, allowing confidential information about the operating system, the database version, IP addresses and the SAP system Identifier to become publicly accessible (information disclosure). The spectrum of vulnerabilities that can be accessed by hackers can thus be expanded to the underlying layers as well. In addition, the risk exists that hackers will misuse unknown vulnerabilities via so-called ‘zero day exploits’, or misuse services with saved credentials. It is imperative to identify the services that are being offered via the internet. Particularly services that are accessible to the public or that bring specific security risks should be deactivated.[http://scn.sap.com/docs.DOC-17149]

C-2013-3-eng-Schouten-03

Figure 3. Internet-enabled services (/sap/public/info).

SAP security notes

Since 2008, the number of security patches – also called ‘security notes’ – launched by SAP has increased dramatically. Prior to 2008, SAP released only a few patches; but in 2010, 2011 and 2012 an average of 735 security patches were developed each year. Apart from the increase in quantity, the diversity of the discovered vulnerabilities has also grown. This can be explained by the addition of multiple features, components and modules to the old-fashioned SAP R/3 system. Due to the increasing complexity and nature of the risks, protecting and auditing the current SAP system is becoming more time-consuming and requires extensive knowledge of the SAP system.  

Figure 4. Examples of SAP security notes.

Note Description
1097591 Security Scan and XSS Vulnerabilities
1394100 Security note: Access to RFC-enabled modules via SOAP
1141269 Security: XSS vulnerability in SAP GUI for HTML
1177437 Cross Side Scripting issue with Internet Sales
1428117 Security Note: Introducing WSDL security in Java AS 7.20
1415665 SQL injection in Solution Documentation Assistant
1418031 Potential Security Issues in SAP-solution Manager
1445998 Disabling invoker servlet in the portal
1580017 Code injection vulnerability in TH_GREP

The growing addition of functionalities exposes SAP to inherent vulnerabilities in the underlying technologies. Examples of these adopted technologies include Java, HTTP, SOAP/ XML and open SQL programming languages. This expansion caused an extension of the quantity and diversity of security notes. Figure 4 contains an overview of vulnerabilities in different SAP systems (Solution Manager, Portal) and vulnerabilities inherent in the technologies used, via Cross Site Scripting and SQL injection. Unfortunately, not all organizations are in a position to implement security notes at short notice. The continuity of the SAP system must be guaranteed before implementing a security note. Partly due to the change management process, which involves a variety of acceptance tests, it often takes months for the vulnerabilities to be actually rectified ([Scho13]). Currently, SAP releases security notes on a monthly basis.

The risk description/exposure addressed by SAP within the note’s descriptions is often ‘high level’ and (perhaps) deliberately vague. The screenshots in Figure 5 outline the risk exposure in case security patches are not timely implemented within the SAP system. As demonstrated, malicious users are able to run commands at an operating-system level, as SAP does not validate the accuracy of the user’s input.  

C-2013-3-eng-Schouten-05

Figure 5. Exploiting security notes 1580017 and 1445998.

To perform a risk assessment, organizations have to rely on the categories used by SAP to classify its patches. Among all the security patches launched for each category, we observe a peak, – particularly in 2010/11 – in the number of ‘hotnews’ patches that were launched. One of the causes for this peak is the attention SAP received within the security community. As of 2010, the number of SAP security conferences grew substantially, for e.g., during Blackhat and Hack in the Box ([Poly12]).

Figure 6 presents the development of different security notes that were launched. As yet, there seem to be considerably fewer patches released by SAP in 2013. On the other hand, vulnerabilities are much more serious in 2013 than in the previous years.  

C-2013-3-eng-Schouten-06

Figure 6. Released SAP security notes.

One of the risks identified in different SAP patches concerns vulnerabilities in the SAP gateway (notes 1408081, 1465129, 1531820). The SAP gateway is a technical SAP component, which is deployed as ready to use. This means that security can be added afterwards, but is not activated by default. Technically, this involves the configuration of the SAP gateway by means of an Access Control List (ACL). The SAP gateway should exclusively communicate with systems within the ACL. If no Access Control has been activated for the SAP gateway, unauthorized persons or systems may access the SAP system, for e.g., by giving operating-system commands. Thus, a default SAP system is deployed from a usability rather than a security perspective.  

A current trend within the security community is the adoption of SAP exploits within tooling. For instance, popular penetrating-testing suites, such as Metasploit, Bizploit and Onapsis X1 demonstrate how a SAP system can be targeted easily by a large number of (ignorant) people. Figure 7 shows plug-ins such as ‘callback’, ‘eviltwin’ and ‘gwmon’, which can be used to exploit misconfigurations in the SAP gateway. This results in a complete compromise of the SAP landscape.

C-2013-3-eng-Schouten-07

Figure 7. SAP penetration-testing suites.

Study of SAP vulnerabilities  

Various aspects of SAP security issues were outlined in the previous section. To understand the extent and significance of these problems, various issues have been validated in actual practice ([Scho13]). Password hashes, internet services, security notes and scoping issues, among other things, have been addressed during research. This way, the extent to which SAP-related risks are being mitigated by organizations, is made explicit.          

All members of the Security Access Management focus group within the VNSG (Association of Dutch-speaking SAP Users) were approached for this study. On 19 September 2012, a security issue questionnaire was submitted to this group. It comprised 21 different questions and was returned by 22 respondents.  

The most vital results elaborated in the first three sections are listed below followed by the remaining results.  

1. Use of weak password hashes

Unfortunately, we have found that many of our clients utilize a weak password hashing algorithm (such as A, B, D, E, F, G), even though powerful encryption methods exist and have been made available by SAP (such as H/I). This is caused by downward compatibility, on the one hand, and by the number of users that have been defined as ‘service’ or ‘communication’ users. These users do not have to comply with the password policy within SAP, and probably their passwords have never been changed afterwards. Only one of the respondents indicated that password complexity was being checked by means of password-cracking tools.

2. Internet services

The study has shown that of the total respondents, 41 percent deactivated the ICF[ICF = Internet Communication Framework ] services. Other respondents indicated that ICF services were not deactivated, or indicated that they did not have knowledge about whether the services were enabled or not.  

3. Missing SAP security patches

Various security-related incidents and risks can be mitigated by the timely implementation of security patches in SAP. The investigation showed that less than 14 percent of the respondents implemented a security note within one month. Deficient security patches often expose an organization temporarily to all risks outlined in the patch. Unfortunately, a clear risk description/exposure is often not included within the security note, which makes it difficult for organizations to properly assess the risks. The study also showed that access to the SAP gateway was limited for 23 percent of the respondents. This observation is also recognized by many of our clients.

Other findings are:  

4. Privilege escalation SAP and OSI

During an IT audit, the Operating System (OS) and Database (DB) layers are usually assessed separately from the application layer. SAP, however, offers the possibility to execute commands on the OS or DB layers directly from the user interface. This enables all SAP users to access other layers within the OSI model (Open Systems Interconnect), namely, OS and DB; although this access may not be mandatory based on the user’s work domain. By approaching the OS via SAP, the user can alter the database, bypassing all configured (application) controls within SAP. The risk exists that bank account numbers will be changed intentionally. It is essential, therefore, that ordinary users of the SAP application should have restricted access to the OS/DB level. At the same time, SAP access to the OS and DB should be limited. Research ([Scho13]) has shown that, as a rule, situations such as those described above are not examined during a SAP audit. As a consequence, the organization runs the risk of unauthorized changes being implemented in SAP that cannot be traced back to an individual.    

5. Inadequate examination of non-production environments  

A SAP landscape involves more than just a production system. As a rule, organizations use DTAP street with separate systems for development, test, acceptance and production. Each of these systems has several clients. From the user’s point of view, a client is a separate environment with a user name and separate transactional- and master data. In general, eight to 16 SAP clients can be found within a SAP landscape. In this context, we are only referring to the core component, SAP ECC, leaving aside other products such as CRM or BW. During an IT audit, usually one client (Production) is examined,  instead of the entire landscape, despite other systems such as development or acceptance jeopardize the SAP security concept.

The risk exists that unauthorized users from non-production systems or clients logon to the production client by using Remote Function Call (RFC) or client independent transactions. These transactions create the opportunity to access the production client from other systems or clients. In the case of an incoming RFC connection, SAP relies on the authentication and authorization of the other (remote) system. Research ([Scho13]) has shown that IT audits tend to focus primarily on the production client and less on the many other clients or systems in the SAP landscape. It is essential that all systems and clients are examined together and in the same way, due to the interconnected nature of those systems.

Remediation plan

In the previous sections we have explained the issues related to SAP security. We initiated by outlining a number of inherent vulnerabilities in the SAP landscape. Subsequent to that, we examined the extent to which these and other vulnerabilities are mitigated in practice. Below, we have listed several practical solutions and guidelines for system owners to mitigate various SAP security risks. For practical and technical solutions refer to the Appendix at the end of the article.

C-2013-3-eng-Schouten-09

Figure 8. Remediation plan for SAP security risks.

Password hashes

  1. First and foremost, the use of weak password hashes in SAP must be avoided as much as possible. SAP passwords should be saved in the improved hashing algorithm (CODVN H/I). This can be realized with the help of a SAP NetWeaver upgrade (min. 7.1). In addition, powerful password  encryption can be enforced through security parameters.
  1. Weak passwords can be identified by using password-cracking tools, such as JTR. Background users in particular are often configured with passwords that might originate from the implementation date of SAP. These passwords need to be changed and measures should be taken to avoid such mistakes.
  1. It is said that you are only as strong as your weakest link. This perfectly applies to the Segregation of duties in SAP and is as strong as the weakest password. Various tables and access paths to the password hashes must be restricted by means of authorizations. The possibilities for gaining access to the password hashes must be acknowledged, analyzed and restricted. Password hashes must be regarded as confidential.  

Operating System and Database

  1. Access to SAP via the Operating System must be strictly limited. Security baselines on OS and DB levels must be designed and implemented. Also, authorizations which allow the execution of OS-commands via SAP must be restricted.
  1. Ensure that the SAP user at the OS level is not installed using either root or administrator privileges.    

Technical SAP components

  1. Technical SAP components should only be able to recognize those systems that are authorized or familiar within the landscape. This way, SAP can be protected against unknown and malicious interfering systems. By implementing Access Control Lists for the SAP router, Oracle, Application Servers and Message Servers, unknown malicious parties are excluded. In this context, SAP systems and servers that are operational should be made explicit, while ensuring that no addresses are overlooked.  

SAP security notes

  1. Implement the most recent security patches, particularly for the SAP gateway. In addition, the most recent Basis Support package and SAP kernel needs to be implemented. This can be downloaded from the SAP Marketplace. Review Earlywatch/RSECNOTE reports for new patches on a regular basis.

RFC connections and interfaces

  1. Investigate all RFC connections from non-production environments and verify the logon & security sections of these connections to prevent, among other things, the remote logon possibility  

Services

  1. Activate only those services that are essential to the business. Internet services surplus to requirements should be deactivated on the application server wherever possible. If possible, access to critical logfiles within the SAP Management Console should be restricted. The extent to which activities are logged should be decreased (trace level).

The recommendations outlined above can be used as a guide to mitigate various recognized SAP security issues. However, we do not warrant the completeness of the discussed SAP security topics. Other factors that could adversely affect the security of the SAP system include compromised ABAP source code, historical SOD’s, table debugging, network sniffing and many others. Also, it should be kept in mind that features such as soft controls and user awareness are preconditions for a secure system. The use of SAP penetration testing software should be considered to expose major SAP vulnerabilities. There are various commercial (ESNC) and easy-to-use freeware solutions (such as Bizploit) available on the internet.      

Conclusion

Due to the expanse of SAP functionalities and products, organizations are inadvertently increasing the number of access paths to their crown jewels. In addition, SAP embraces technologies such as Java, HTTP, SOAP, XML and open SQL, which exposes SAP to all the security risks inherent to these technologies. The risks involved with the technical security of SAP on the Basis layer, are generally unknown and neglected. Research has shown that, consequently, these risks are only mitigated to a limited degree.    

SAP security issues are noticed within the cyber security community. Since 2010, a growing number of SAP security conferences have been organized. Tools to exploit vulnerabilities in SAP have become easy to use and are accessible to a large number of people. Hence, exploiting a SAP system has become easier by the day.

In this article we have addressed risks, vulnerabilities and misconfigurations within SAP. Organizations are often unaware of the risks that they are exposed to by not fixing the neglected vulnerabilities. Fortunately, SAP is increasingly raising the quality of the default security measures in its system.

The effect on the regular IT audit is that working programs for SAP need to be adjusted and the risk analysis has to be revised. A number of the current vulnerabilities within the SAP landscape can be resolved in a relatively easy manner, as indicated in the section entitled ‘Remediation plan’. However, this requires a team possessing knowledge of the application layer and the infrastructure layer.    

Appendix

The technical details listed below can be used as a guideline to mitigate a number of known SAP security issues. The numbers correspond with those in the ‘Remediation plan’ section.

1. Parameter login/password_hash_algorithm & login/password_downwards_compatibility
2. John –format=sapB hashfile
3. Relevant objects:  S_TABU_DIS, S_TABU_NAM
  Relevant tables: USR02, USH02, USRPWDHISTORY
  Relevant authorization group: SC, SPWD
  Relevant transactions: SE16, SE16N, SM49, SM69, DB02, SM30, SM31, N, UASE16N, SE17,CAC_DET_ACCAS_30, CX0A7, CX0A8, KCS5, KEP6, PRP_UNIT
  Relevant programs: RK_SE16N, UA_SE16N_START
  Monitoring deletion of logfiles: RKSE16N_CD_SHOW_DELETE, RSTBPDEL, RSLDARCH02
4. Relevant objects: S_LOG_COM en S_DEVELOP
  Relevant transactions: SM49, SM69 (do not allow additional parameters)
5. N/A  
6. Oracle – SAP: tcp.validnode_checking = yes
    tcp.invited_nodes = (locahost, payrolldb, host3)
  SAP Gateway:  <> USER=* HOST=* TP=*
  SAP Message Server:  <> HOST=*
  Implicit deny D   *   *   *
  Incorrect entry P   *   *   *
7. Earlywatch / RSECNOTE  
  Remote OS authentication for the Oracle database instance (sapnote_0000157499, 21/10/2011)  
  SAP management console (sapnote_00001439348, 14/12/2010)  
8. Relevant transactions: SM59, SA38 – RSRFCCHK
9. Relevant transactions: SICF
  Activated services: http://127.0.0.1:8001/sap/bc/gui/sap/its/webgui
    http://127.0.0.1:8001/sap/public/info
  SAP Management Console: http://<host>:5<instance>13

References

[Edmo11] M. Edmonds (2011), SAP-Security Audit: The City Should Implement Additional Measures to Effectively Secure Its SAP Enterprise Resource Planning System, Audit Report.

[Poly10] A. Polyakov (2010), SAP-security: Attacking SAP Users, Digital Security Research Group.

[Poly12] A. Polyakov, Tyurin (2012), SAP-Security in Figures; A Global Survey 2007–2011, ERPScan.

[Scho13] T. Schouten (2013), A False Sense of Security; Auditing (Beyond) the SAP Production System, University of Amsterdam.

[Vree06] A. Vreeke and D. Hallemeesch, “Zoveel functiescheidingsconflicten in SAP – dat kan nooit, en waarom is dat eigenlijk een risico? De complexiteit van het SAP R/3-autorisatieconcept vervolgd” (“So Many Issues Connected with Division of Responsibilities in SAP – That’s Impossible, and Why Is That a Risk Anyway? The Complexity of the SAP R/3 Authorization Concept Continued”), Compact 2006/.