
Robo-advice: how to raise a new machine

Johannes Kepler, a German 17th century astronomer, famous for discovering how planets revolve around the sun, is supposed to have said that ‘logarithmic tables’ had doubled his lifespan. If a simple list of numbers can do this for an academic 400 years ago, imagine the impact of artificial intelligence (AI) on the life of a modern-day financial advisor. Embracing AI means eternal life is within their reach. Where Kepler used observational data of the planets gathered by the Danish astronomer Tycho Brahe, the modern-day financial advisor uses the abundance of data currently available. Its volume has exploded over the last 10 years. The combination of prolific processing power, data, data storage and AI has revolutionized the domain of recommendations; it allows the real-time delivery of automated, personalized advice. When this type of advice is related to financial products, we use the term ‘robo-advice’.

During the time of Kepler and Brahe the institutions in charge tried to control their scientific work and output ([Koes59]). How should 21st-century authorities respond to ‘robo-advice’ and the use of artificial intelligence? Should these possibilities be controlled and if so, how can this be done by the providers themselves?

Introduction

Humans have been providing advice since the dawn of time. It therefore doesn’t come as a surprise that automated advice, in the form of search engines, has been both a primary attribute and driver of the Internet. Without automated advice most on-line services and information would remain hidden from potential users or clients. We would still be reading magazines similar to the old-fashioned TV guide to navigate through the endless Internet universe. The business model of many successful and popular on-line enterprises also depends on the recommendation paradigm. Its capability has made global brands of companies such as Amazon, Netflix, Spotify, Booking and YouTube.

In addition to those business models aimed at entertainment, the financial sector has also embraced the recommender model. The reasons are numerous. The relationship in the financial sector was traditionally one of trust. Technology and costs have required the financial sector to invest in automation and self-service, however, impacting the relationship between the provider and the client. Clients themselves are expecting the financial services industry to offer them real-time, 24/7 digital services to assist them in what remains a complex domain. These expectations can be met by traditional providers as well as by providers outside the financial sector, such as Fintechs. They can target a European market that has increased significantly over the last 20 years due to the introduction of the Euro, passporting rights for financial firms and the removal of national barriers. All made possible by a legislator that aims to make Europe fit for innovation. However, that same legislator has introduced many additional regulatory obligations and prohibitions to protect the client and market. Rules that potentially increase the complexity and costs of the service.

The asset management industry has seen growth in two ‘recommender’ areas: automated investment advice (robo-advice) and automated portfolio management. Specific attention has been given to these two subjects by a number of national and international regulators during the last five years. This has resulted in guidance on how to tackle risks for providers, clients and the economy at large. The recommender system itself has been blessed by the exciting new possibilities that AI is offering. Used correctly, AI will allow recommendation systems to provide advice that cannot be matched by conventional technology or standalone human advisors. However, AI has introduced its own new challenges.

This article will discuss the principles of a recommender system, explain where AI is used, guide the reader through the different types of advice and identify when an activity qualifies as financial advice, share the traps and pitfalls of robo-advice and recommend mitigating controls the (internal) auditor will be expecting.

The Recommender Model

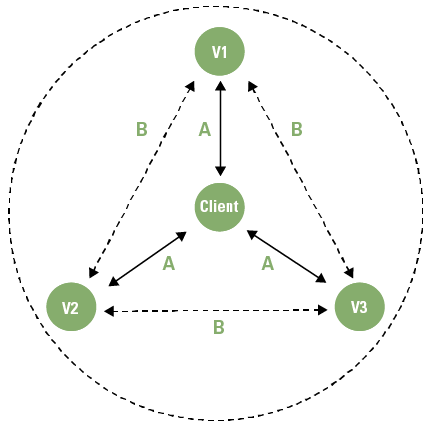
The principles of a recommender model are not hard to understand. In essence, a recommender system filters information and seeks to predict the rating or preference a user would give to an item ([Ricci11]). Generally, this system is based on one of three models: the collaborative filter model, the content-based model or the knowledge-based model (see Figure 1).

C-2019-4-Voster-01-klein

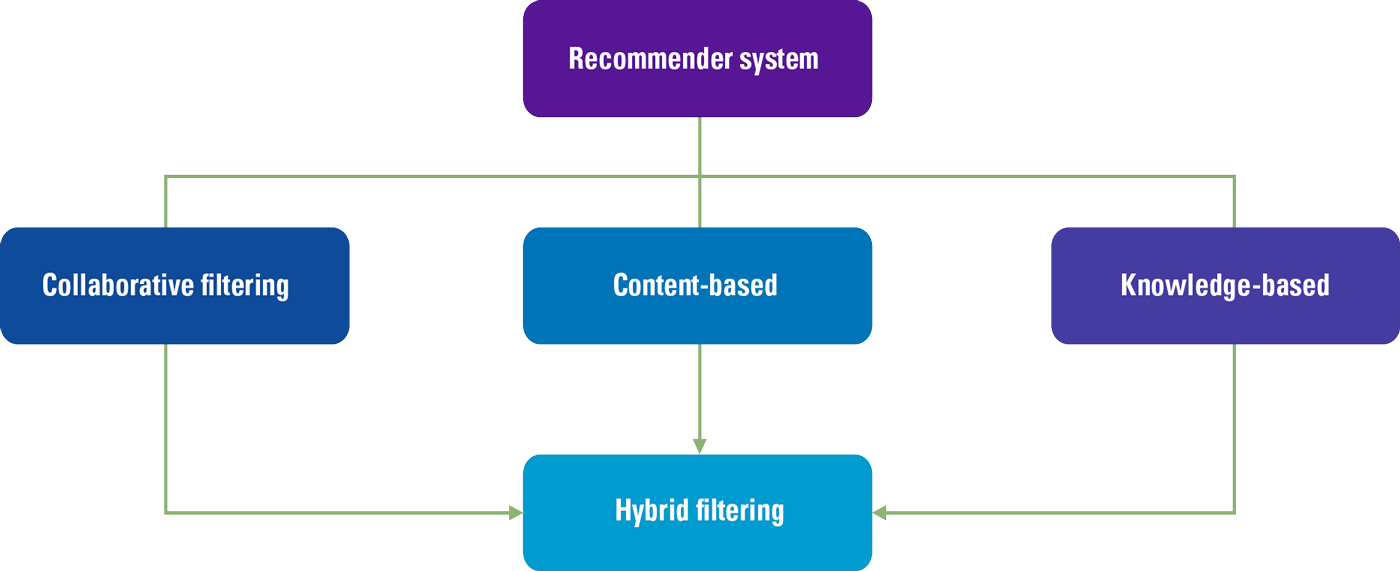
Figure 1. Recommender Models. [Click on the image for a larger image]

A collaborative filter model uses information of the behavior of many users with respect to a particular item. Hence the name ‘collaborative’. The content-based model requires information (i.e. content) about the item itself. Therefore, if the item is a book, a collaborative filter approach would gather the number of times people would search for the book, buy the book and rate the book in order to predict the preference of a client. The content-based approach would use attributes of the book itself: its title, author, language, price, format, publisher, genre etc. Content-based systems therefore seek similar features while collaborative filter systems seek similar attributes. The third model, the knowledge-based system, is based on explicit information about the item assortment, user preferences, and recommendation criteria. This system relies heavily on the identification of specific rules to determine when – in a given context – the right item is advised to the user. A system could also be based on a combination of the three techniques creating a hybrid system.

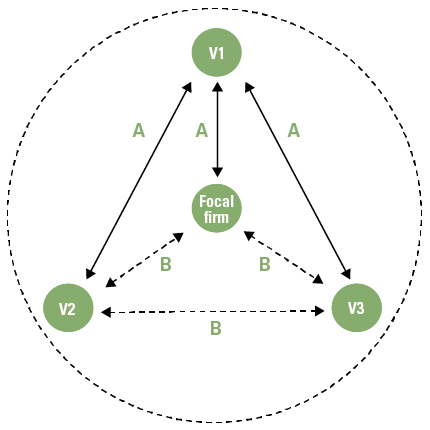
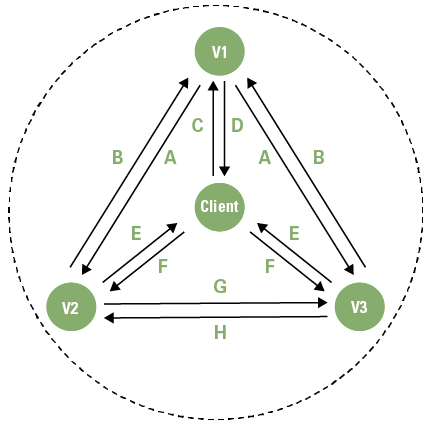
What is the (new) role of AI in a recommender system? AI is a suite of technologies that distinguishes itself by its ability to recognize patterns from structured and unstructured data based on accuracy and confidence ratings/weightings. One example of such an AI technology is the ‘neural network’ paradigm, a generic capability that was until recently limited to biological brains only ([Vost17]). With AI technology, recommender systems can be built that identify the required associations automatically. As such, using AI as a technology allows the development of automated adaptive (autonomous) recommendation systems that train themselves and improve in time (see Figure 2). The disadvantage of using AI is that it may become impossible to explain why the system has generated a specific recommendation, the AI dilemma of unexplainability.

C-2019-4-Voster-02-klein

Figure 2. Simplified AI Recommender Architecture. [Click on the image for a larger image]

When does a recommendation qualify as robo-advice?

Recommender systems are applied all around us, from products to services, to events: there are possibilities within many markets, such as retail, media and entertainment, healthcare, government and transportation. In essence, a recommender system helps a company to retain its customers by engaging with them. This increases loyalty and sales. Although they are most often associated with the retail and entertainment business, recommender systems are common in the financial services sector, where they are known under the generic term robo-advice.

It’s the legislator and the financial regulators that have started to use the term robo-advice exclusively within the context of the financial services industry, a heavily regulated segment of the economy. A joint discussion paper by the three European Supervisory Authorities for the financial sector (see box “Supervisory model Europe”) has identified three main characteristics of a robo-advice system ([ESAs15]):

  1. The system is used directly by the consumer, without (or with very limited) human intervention;
  2. An algorithm uses information provided by the consumer to produce an output;
  3. The output of the system is, or is perceived to be, financial advice.

The first two characteristics, A and B, have been discussed as part of the explanation of the recommender model. Characteristic C requires more analysis as the definition of financial advice depends on the regulatory and supervisory regime applicable to a firm’s business model and jurisdiction.

Supervisory model Europe

In Europe, the financial services sector is divided in three areas, with each area having its own European Supervisory Authority (ESA):

  • The European Banking Authority (EBA);
  • The European Securities and Markets Authority (ESMA); and
  • The European Insurance and Occupational Pensions Authority (EIOPA).

A national competent authority or supervisor is usually responsible for providing the license. The Netherlands has a twin-peak supervisory model. Prudential supervision is the responsibility of the Dutch Central Bank (DNB) and conduct supervision is the responsibility of the Authority for the Financial Markets (AFM). Some banks however are supervised by the European Central Bank (ECB).

Irrespective of robo-advice, it is always important for a firm to assess if the firm is required: (i) to notify a supervisor, (ii) to have a license or (iii) is exempt of any license requirements. In addition, firms need to know the regulatory regime applicable to their business model. For example, depending on the service, product and client segment, the Dutch conduct supervisor AFM exercises supervision under one of two acts: either the Financial Services Act (FSA) or the Consumer Protection Enforcement Act (see box “European regulatory regimes”).

European regulatory regimes

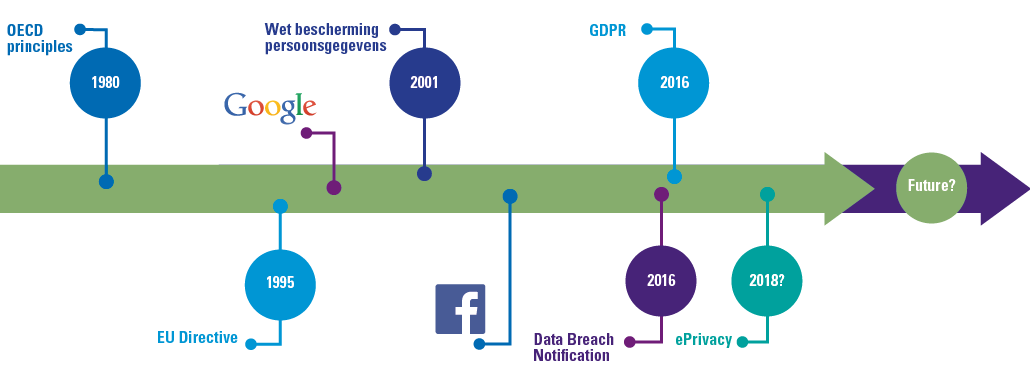
Membership to the European Union (EU) requires member states to transpose European Directives to national regulations such as the FSA. The flood of new or adapted European legal frameworks such as Solvency II, Insurance Distribution Directive (IDD), Capital Requirements Directive (CRD), Markets in Financial Instrument Directive II (MiFID II), Alternative Investment Fund Managers Directive (AIFMD) and the Market Abuse Directive (MAD) has resulted into significant changes to national financial regulatory frameworks. In addition, sector agnostic regulation has also impacted national legislation. A well-known example is the General Data Protection Regulation (GDPR), which has been applicable since May 2018 in the Netherlands, replacing national legislation (Wet bescherming persoonsgegevens (Wbp)).

A successful license application results in a registration in the applicable register at the applicable supervisor. The register will specify, among others, the Financial Service Type, the Service/Activity permitted and the date of entrance. The (internal) auditor should validate that the license provided matches the activities carried out by the firm. If this is not the case, it should be reported to the supervisor.

Unfortunately, not every regulatory regime is always clear about the meaning of financial advice. For example, the Markets in Financial Instruments (MiFID II) framework, which governs investment services, mentions four different types of advice related to investment activities ([EU14]):

  1. Generic advice: advice provided about the types of financial instruments, e.g. small cap equities;
  2. General recommendation: investment research and financial analysis or other forms of general recommendation relating to transactions in financial instruments;
  3. Corporate financial advice: advice to undertakings on capital structure, industrial strategy and related matters and advice and services relating to mergers and the purchase of undertakings;
  4. Investment advice: the provision of personal recommendations to a client, either upon its request or at the initiative of the investment firm, in respect of one or more transactions relating to financial instruments.

Of these four types of advice, only investment advice is an activity/service that always requires a license to operate in Europe. Of the other three types, both ‘general recommendations’ and ‘corporate financial advice’ are recognized as ancillary services. They don’t necessarily require a license. However, when the provider provides an ‘investment service’ such as ‘investment advice’ these ancillary services may introduce additional requirements.

Fortunately, the European authority ESMA has done some preparatory work to help companies understand the meaning of ‘financial advice’. It has defined five criteria ([CESR10]) to identify when an activity qualifies as ‘investment advice’. This model can be re-used and enhanced to define a decision tree to assess if a financial activity qualifies as ‘financial advice’ (see Figure 3).

C-2019-4-Voster-03-klein

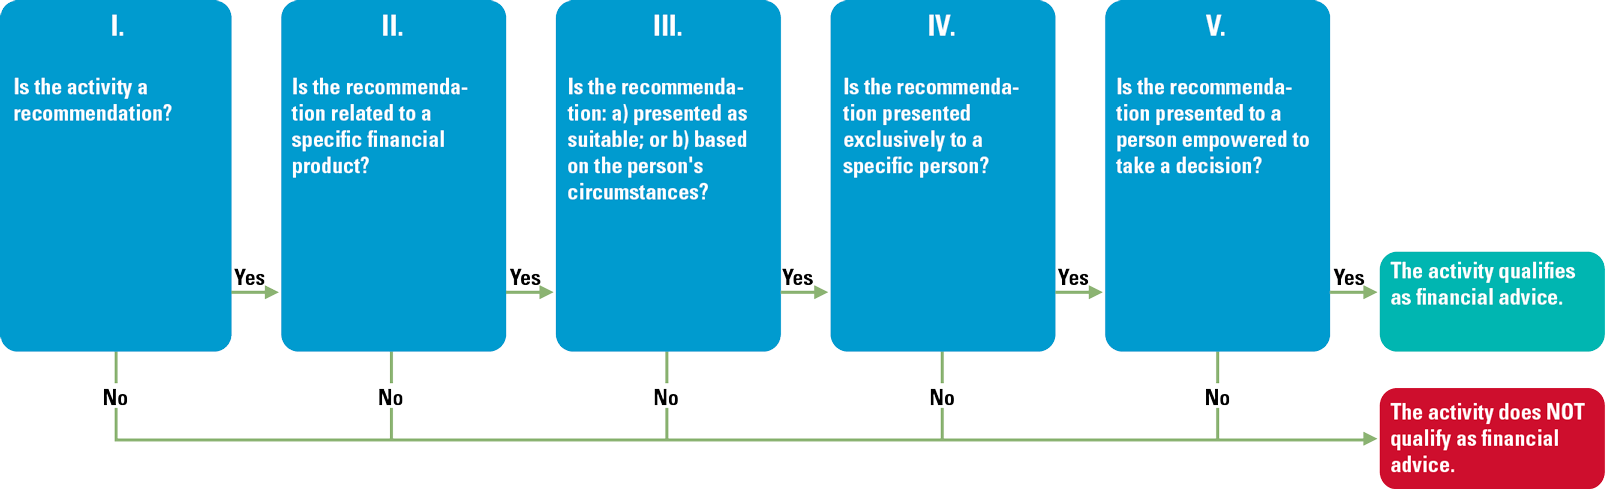
Figure 3. Financial Advice Decision Tree. [Click on the image for a larger image]

The first criterion used to qualify an activity is the question “Is the activity a recommendation? A recommendation requires an element of opinion on the part of the advisor. The second question requires an analysis of the actual outcome of the activity. If the outcome is narrowed down to a recommendation about a specific financial product the answer to this question is ‘Yes’. However, for a recommendation referring to a wide range of products or a group of products, e.g. an asset class, the answer is ‘no’ and an activity with such an outcome is not considered financial advice. Depending on a positive outcome of the three remaining criteria, the qualification of ‘financial advice’ may be given to an activity. Knowing which type of activity we are dealing with allows us to identify the respective regulatory permissions, obligations and prohibitions that have to be implemented. The decision tree may also be used by (internal) audit or compliance to verify the assessment of an existing set of activities.

The traps and pitfall of robo-advice and AI

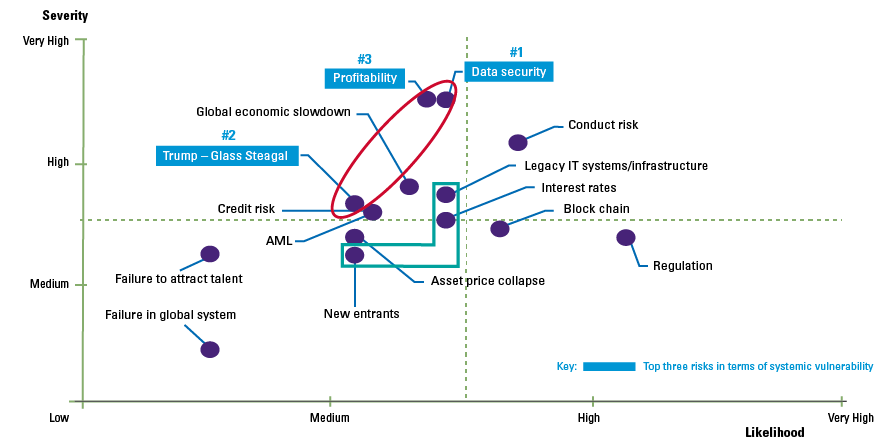
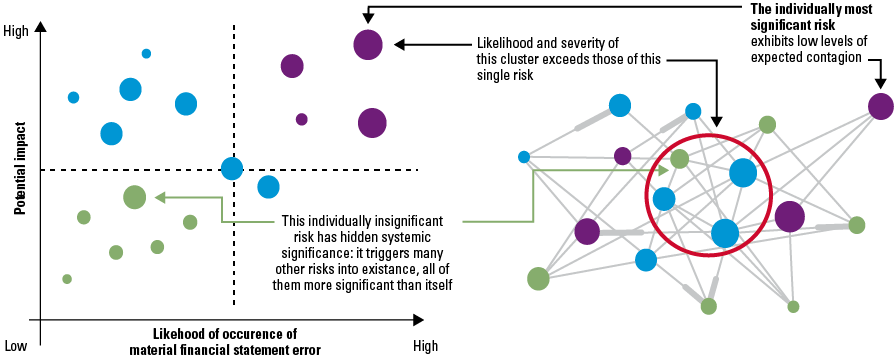
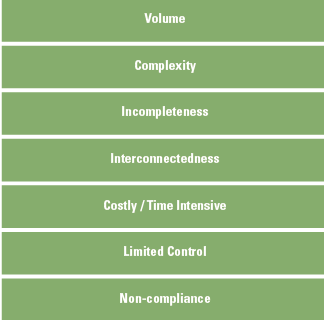
The risks of robo-advice (see Figure 4) are known and have been thoroughly studied by numerous institutions and supervisors ([ESAs18], [BEUC18]). In these reports, the most immediate risk that keeps coming up relates directly to the actual advice as provided by the system.

Robo-advice is perceived by the client to be highly personalized and suitable. Although the quality of automated recommendations has been improving steadily over the years, it remains highly dependent on the availability of the right data and the input provided by the client. An attribute of a recommender model like ‘collaborative filtering’ is that it suffers from ‘cold start’ problems as information regarding other users has not yet been generated. As a consequence, the system may give incorrect or unsuitable advice. Similarly, errors in code or corruption due to a cyberattack may impact the suitability and correctness of robo-advice. Unsuitable advice and prejudice may also be the result of (unintentional) biases in the application itself (see box “Biases”). All in all, advice must allow the recipient to make well-informed decisions and the provider should ensure that the advice is compressible, correct and suitable.

C-2019-4-Voster-04-klein

Figure 4. AI & robo-advice risk. [Click on the image for a larger image]

A continuing concern of robo-advice is the possible abuse of user data. Robo-advice makes use of personal data, i.e. information that can be used to identify an individual, that is often combined and aggregated within the system. The more this happens, the more difficult is becomes to de-identify the data to preserve the privacy of the users. Data privacy and data access are closely linked risks. Any access to personal data should be highly restricted in such a way that only those authorized and qualified to do so can have access. On the other hand, access to personal data is a fundamental right for any user, addressed in data protection regulations such as the GDPR. Therefore, any design of a recommender system should include support for this fundamental user right.

One of the risks increased by the use of AI techniques is the explainability of the advice; the ability to explain the decision-making process. In general, the better the AI algorithm, the blacker the box, the more difficult it is to find out why something has happened inside the box. However, as with data access, meaningful information about the logic involved, as well as the significance and consequences of user data is an essential right that must be catered for by the system (GDPR Art.22). Any recommendation made by the robo-advice application must be explainable and auditable.

Biases

Bias in, bias out. AI systems are brilliant at analyzing vast quantities of data and delivering solutions. But there is one major problem: they are bad at understanding how inherent biases in that data might affect their decisions. As a result, a series of headline-hitting cases are drawing attention to the ‘white guy’ problem, where systems make decisions that discriminate unfairly against certain groups ([KPMG17]).

How can companies mitigate the risks of robo-advice?

Many arrangements required to eliminate or significantly reduce the robo-advice risks are already known and common practices in the market. Supervisors also agree that additional legislation to cover any robo-advice risks are currently not required ([ESAs18]). Instead, supervisors state that the complexity of existing applicable regulation, such as MiFID II, IDD, GDPR, PRIIP, is a regulatory barrier preventing the development of automation in the financial sector ([ESAs18]).

A menu of possible arrangements to control robo-advice risk based on best practices and current regulatory obligations allocates the measures to either client/product related activities on the one hand and algorithm related activities on the other hand.

Client/product risk mitigation

In order to mitigate the client and product risks identified in the previous section, companies should introduce measures for product governance, client onboarding, disclosure design, cost transparency and suitability statement (see Figure 5).

Product governance

Companies should develop, approve and review their product for use within robo-advice. This should include the critical identification and assessment of both new and existing products, including their business and operational aspects, with all relevant stakeholders. The critical assessment should include a clear description of each product in scope, its target market including the knowledge and experience required by the potential clients to understand the product, the suitability of the product with the target market’s risk profile, a definition of the risk category and suitability to cover the target market’s financial objectives and needs. Every product should be explicitly approved by the robo-advice service.

Client onboarding

Companies should implement arrangements to identify a client’s knowledge and experience, its financial position, its ability to bear losses, its financial (investment) objectives and its risk profile. Where applicable, a client should be allocated to a client category, e.g. retail or professional. Companies should explicitly identify if robo-advice is suitable for the client before offering the client the possibility to receive advice.

Disclosure design

Companies should pay attention to the disclosure of information, both regarding the actual robo-advice application as well as the use of personal data by the application and the presentation of the recommendations. Behavioral insights into the presentation of disclosures should be used to optimize the client’s understanding of essential information and resulting behavior ([IOSC19]). Companies should use design features, such as layout and warnings to assist clients in making informed decisions.

C-2019-4-Voster-05-klein

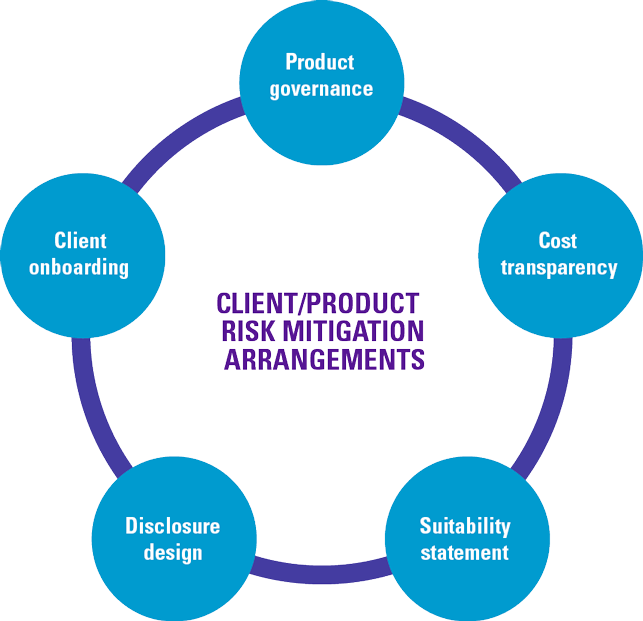
Figure 5. Client/product risk mitigation. [Click on the image for a larger image]

Cost transparency

Before a client uses any service, companies should share any costs and charges with the client. If the client uses robo-advice, companies should provide the client with a complete overview of all possible costs that may occur before the client decides to accept the advice. Companies should provide an overview of the ex-post costs occurred as well. This overview should match the ex-ante information. Any discrepancies should be explained.

Suitability statement

Every advice provided should include a suitability statement. This suitability statement should include an assessment of the clients’ knowledge and experience, financial situation and investment objectives based on information obtained from the client. In addition, the statement should include a reference that the robo-advice systems recommendations will not reduce the responsibility of the company. They may also further include details regarding a periodic assessment of the suitability of the advice given.

Algorithm risk mitigation

In order to mitigate the risks related to the algorithm used by the robo-advice system, companies should introduce measures for controlled Development and Change Management Process, algorithm transparency, pre and post-advice controls, real-time advice monitoring and periodic assessment( see Figure 6).

Controlled Development and Change Management Process

The firm should have a transparent development and deployment process with defined responsibilities. It should ensure the proper functioning and stability of the algorithm by supporting tests to assess the correctness of the software using white and black box methodologies. The change management process should support clear responsibilities and record keeping regarding the time and nature of the change, and who approved the change and subsequent deployment. Access to the development and change management environment should be restricted.

Algorithm transparency

The design of the algorithm should be such that it complies with all applicable regulatory requirements. Documentation of the algorithm should include, but is not limited to: a brief overview; the current status; the date the algorithm was approved and, if appropriate, retired; detail any restrictions placed on the algorithm when approved; a detailed description of its functionality and design such that the firm understands the risks that the algorithm exposes the firm to.

C-2019-4-Voster-06-klein

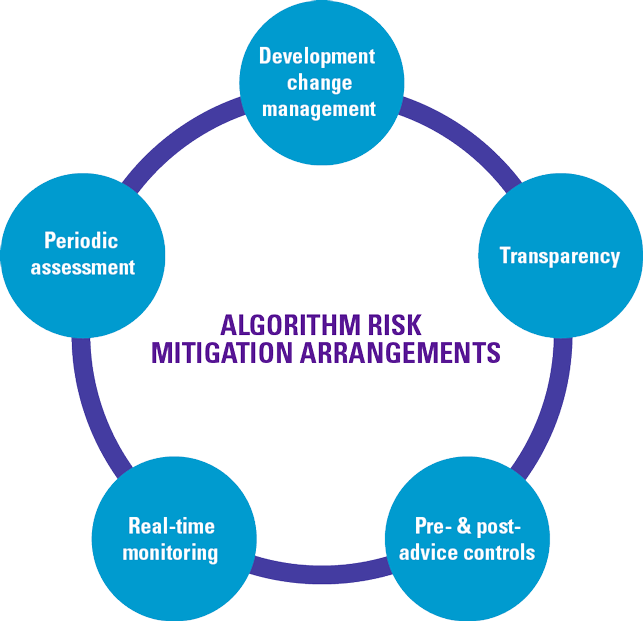
Figure 6. Algorithm risk mitigation. [Click on the image for a larger image]

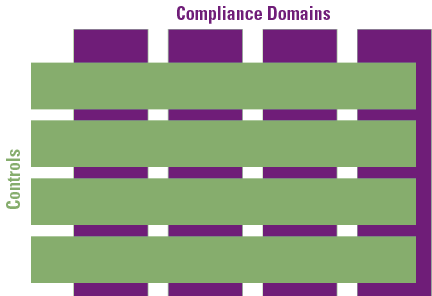
Pre and post-advice controls

Companies should define and implement pre and post-advice controls. Pre-advice controls should include support to control the product group, the target market, the negative target market, risk profiles and the ability to bear losses. Post-advice controls include the availability of a mandatory suitability statement and avoidance of negative target market. Companies should have procedures in place to detect and respond to any pre and post-advice alerts.

Real-time advice monitoring

Firms should implement arrangements to validate confidentiality, integrity and availability of the robo-advice application. The arrangements should support real-time alerts.

Periodic assessment

Companies providing robo-advice should have management in place that reviews the application and algorithm(s) periodically to assess any unintended results (including biases) and their suitability for the profile of the clients and the company. Depending on the integration of AI in the robo-advice application, companies should examine to what extent the application is a responsible one (see Figure 7) in order to assess the use of an AI framework as presented by the Dutch central bank (DNB) in 2019 ([DNB19]).

C-2019-4-Voster-07-klein

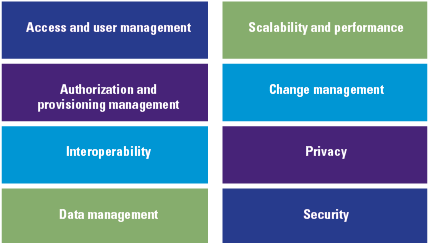
Figure 7. Applicability matrix of DNB AI principles. [Click on the image for a larger image]

Conclusion

By providing robo-advice, companies are able to address a number of challenges: product volume and complexity, personalization, customization, service differentiation and regulatory compliance. Robo-advice provides the client with a suitable recommendation, allowing the client to take a well-informed decision while creating economies of scale for the provider.

The provider should check out any required licenses or registrations, identify related regulations and guidelines, and design its service in such a way that it complies with national and international (European) legislation. Using AI to enhance the quality of a recommender system brings additional advantages, provided the challenges of explainability and transparency are addressed.

Risks related to robo-advice are always present; this article provides guidance in how to control these through mostly existing best practices. Given that regulatory requirements for robo-advice are – for the time being – not more stringent than general finance advice and that specific legislation for robo-advice is not expected to be introduced in the near future, this is the right time to develop an automated advice service.

References

[AFM18] AFM (2018). The AFM’s view on robo-advice. Opportunities, duty of care and points of attention. 15 March 2018.

[BEUC18] BEUC (2018). Automated decision making and artificial intelligence – A consumer perspective. 20 June 2018.

[CESR10] CESR (2010). Question & Answers. Understanding the definition of advice under MiFID. 19 April 2010.

[DNB19] De Nederlandsch Bank (2019). General principles for the use of Artificial Intelligence in the financial sector.

[ESAs15] ESAs Joint Committee (2015). Joint Committee Discussion Paper on automation in financial advice. 4 December 2015.

[ESAs16] ESAs Joint Committee (2018). Joint Committee Report on the results of the monitoring exercise on ‘automation in financial advice’. 5 September 2018.

[EU14] European Parliament (2014). Directive 2014/65/EU of the European Parliament and of the Council of 15 May 2014 on markets in financial instruments and amending Directive 2002/92/EC and Directive 2011/61/EU Directive 2014/65/EU.

[IOSC19] IOSCO (2019). The application of behavioural insights to retail investor protection. OICV-IOSCO, April 2019.

[Koes59] Koestler, A. (1959). The Sleepwalkers. London: Hutchinson.

[KPMG17] KPMG LLP (2017). Advantage AI.

[Ricci11] Ricci, F., Rokach, L. & Shapira, B. (2011). Introduction to Recommender Systems Handbook. In: Ricci, F., Rokach, L., Shapira, B., & Kantor, P. (eds.), Recommender Systems Handbook. Boston: Springer.

[Vost17] Voster, R.J. & Slagter, R. (2017). Autonomous Compliance: Standing on the shoulders of RegTech! Compact 2017/4.

De impact van Robotic Process Automation op de audit

Het toepassen van nieuwe technologieën gericht op verbetering en automatisering van bedrijfsprocessen, neemt in hoog tempo toe. Eind 2019 hebben de meeste corporate en financiële bedrijven reeds Robotic Process Automation (RPA) geïmplementeerd, waarmee handmatige en vaak hoog repeterende activiteiten van medewerkers worden gerobotiseerd. Het implementeren van nieuwe technologieën zoals RPA brengt ook specifieke risico’s met zich mee, zowel vanuit een business- als IT-perspectief. In dit artikel lichten wij toe wat de impact is van RPA op risicomanagement en het auditen van gerobotiseerde processen.

De opkomst van RPA

Vandaag de dag investeren organisaties steeds vaker in nieuwe technologieën zoals RPA, natural language processing (NLP), machine learning (ML) en artificial intelligence (AI). Deze nieuwe manier van automatiseren, met als doel effectievere en efficiëntere bedrijfsprocessen, betere customer experience en kostenbesparingen, heeft grote voordelen laten zien voor organisaties. Softwarerobots zijn flexibel in het uitvoeren van taken (24/7), maken geen menselijke fouten die ontstaan door vermoeidheid of onoplettendheid en kunnen bijdragen aan meer gestandaardiseerde bedrijfsprocessen met minder uitzonderingen.

Wat zijn de voordelen van RPA?

Enkele voordelen van RPA zijn:

  • RPA-implementaties zorgen ervoor dat bedrijfsprocessen opnieuw tegen het licht worden gehouden en dat resulteert in minder uitzonderingen door standaardisatie en versnelt ook de uitvoering van processen.
  • RPA verhoogt de kwaliteit van de uitvoering van processen doordat robots zorgvuldiger en systematischer te werk gaan dan normale medewerkers.
  • RPA is een schaalbare oplossing die het werven van nieuwe fte’s reduceert en/of voorkomt. Nieuwe fte’s zijn in de markt soms niet gemakkelijk te werven, zoals blijkt uit het tekort aan beschikbaar personeel voor bijvoorbeeld Know-Your Customer (KYC)- en Anti Money Laundering (AML)-processen ([Boer19]).
  • RPA zorgt dat de huidige werknemers meer tijd overhebben om waardetoevoegende activiteiten uit te voeren. Investeringskosten en terugverdientijd zijn relatief laag in vergelijking met traditionele automatiseringsprojecten, resulterend in een aantrekkelijke business case.
  • Ook op het gebied van compliance en control heeft het toepassen van RPA zijn voordelen. Alle keuzes en activiteiten die de robot uitvoert, worden gelogd en hiermee kan het bijhouden van een juiste en volledige audit trail tot in detail worden gefaciliteerd.
  • Tot slot is het vanwege de veel grotere beschikbare capaciteit mogelijk om softwarerobots meer en uitgebreidere controles te laten uitvoeren in vergelijking met de beperkte beschikbaarheid en capaciteit van huidige medewerkers. Dit resulteert in een veel grotere scope aan auditwerkzaamheden.

Naast het toepassen van RPA hebben veel bedrijven inmiddels de volgende stap gezet in het verbeteren van bedrijfsprocessen. Hiervoor is slimmere technologie nodig die bijvoorbeeld in staat is ongestructureerde data te verwerken (zoals gesproken tekst met NLP) en zelfstandig beslissingen kan nemen op basis van eerdere transacties en ontvangen feedback (ML en AI). Zie figuur 1 voor een overzicht van de verschillende typen robotiseringsoplossingen met ieder een eigen risicoprofiel. Organisaties zijn druk bezig met het investeren in meer cognitieve technologieën, waardoor uiteindelijk meer processen geschikt zijn voor procesverbetering.

C-2019-4-Pouwer-01-klein

Figuur 1. Drie verschillende vormen van robotisering. [Klik op de afbeelding voor een grotere afbeelding]

Hoe wordt RPA toegepast?

RPA wordt als toepassing vaak gebruikt voor handmatige activiteiten binnen processen met een repeterend karakter en waarbij hoge volumes worden verwerkt. Het is daarom niet onlogisch dat RPA zijn oorsprong kent in de backofficefunctie van grote internationale bedrijven. Inmiddels hebben ook andere afdelingen de voordelen van RPA ervaren en wordt RPA ingezet binnen meerdere organisatieonderdelen. Voorwaarde voor het toepassen van RPA is dat het proces op regels is gebaseerd en dat gebruik wordt gemaakt van gestructureerde data. Gerobotiseerde processen komen bijvoorbeeld voor in de Finance-, HR-, Inkoop- en IT-functie van een bedrijf. Ook binnen afdelingen zoals Supply Chain, Master Data Management ([Hend19]), Internal Control en Internal Audit ([KPMG18]) wordt RPA volop toegepast. Enkele concrete voorbeelden van gerobotiseerde processen zijn: verwerken van facturen in het Enterprise Resource Planning (ERP)-systeem, invoeren van journaalboekingen, opstellen van financiële rapportages vanuit verschillende gegevensbronnen (Finance) en verwerken van indiensttredingsproces van nieuwe medewerkers (HR). RPA wordt in sommige organisaties ook gebruikt als interim-oplossing, voorafgaand aan bijvoorbeeld het implementeren van een nieuw ERP-systeem. Daarnaast zien we combinaties ontstaan tussen bijvoorbeeld RPA en AI, zoals bij AML-processen waarbij RPA de data verzamelt, AI de data analyseert met gebruik van geavanceerde algoritmes en RPA de uitkomsten rapporteert.

Bij het implementeren van RPA is het van belang om in een vroeg stadium na te denken over de impact van robotisering op de organisatie. Het 6×6-robotics-implementatiemodel (zie figuur 2) ondersteunt organisaties met het implementeren van RPA en het beoordelen van de impact op de organisatie, de manier waarop softwarerobots worden ontwikkeld, de relatie met bestaande IT-infrastructuur, risico’s en beheersing en uiteindelijk de impact hiervan op medewerkers ([Jutt18]). Het artikel van [Jutt18] gaat dieper in op de werking van het 6×6-robotics-implementatiemodel. Het vijfde element van dit model, ‘Performance and Risk Management’ focust zich op nieuwe risico’s die zich voordoen bij het implementeren van RPA.

C-2019-4-Pouwer-02-klein

Figuur 2. Het KPMG 6×6-robotics-implementatiemodel. [Klik op de afbeelding voor een grotere afbeelding]

Veelvoorkomende RPA-risico’s

Wie is verantwoordelijk?

Bij aanvang van een RPA-implementatietraject wordt vaak in een vroeg stadium al de vraag gesteld wie de eigenaar moet worden van de gedragingen en uitkomsten van de softwarerobot. In veel gevallen wordt deze vraag als een uitdaging gezien, omdat diverse partijen een bepaalde verantwoordelijkheid dragen bij RPA-implementaties, waaronder de business, IT-afdelingen, Center of Excellences en leveranciers van de RPA-tooling. Vanuit een businessperspectief wordt de softwarerobot gezien als een vervanging of ondersteuning van een normale medewerker en daarom houdt de business zichzelf verantwoordelijk voor de werking van de softwarerobot. Dit argument wordt versterkt doordat de softwarerobot vaak een deel van het proces oppakt en daarna weer overdraagt aan een medewerker. Daarnaast is specifieke proceskennis nodig om een robot te implementeren en beheren en alleen de business bezit deze kennis. Echter, vanuit IT-perspectief wordt de softwarerobot gezien als een applicatie met users en daarom dient IT verantwoordelijkheid te dragen voor de implementatie en het beheer van de robot.

Organisaties gaan verschillend om met het eigenaarschap van de softwarerobots. Vaak wordt een RPA-implementatie-initiatief gestart vanuit de backoffice (Finance) en is de CFO daardoor de direct verantwoorde. Er zijn ook organisaties waar het eigenaarschap komt te vallen onder IT, waardoor de CIO verantwoordelijk is voor de softwarerobots. Voor welke vorm van eigenaarschap van softwarerobots ook wordt gekozen, het is van belang de juiste kennis op te doen en alle stakeholders tijdig te betrekken bij de implementatie om RPA-specifieke risico’s te mitigeren.

Functiescheiding met robotaccounts?

Ook op het gebied van functiescheiding, het vierogenprincipe en het toepassen van robotgebruikersaccounts zijn veel discussies gaande. Op een traditionele Finance-afdeling stelt een medewerker een factuur op en accordeert een tweede medewerker deze in het systeem. Hierdoor kan functiescheiding en juiste autorisatie worden vastgesteld. Wat is het gevolg als dit proces door een robot wordt uitgevoerd? Dienen er dan twee aparte robots te worden gecreëerd voor beide processtappen (bijvoorbeeld Robot_01 en Robot_02) zodat functiescheiding in stand blijft? Of is functiescheiding binnen het proces niet meer relevant? Wat betekent robotisering voor interne controles in het proces? Dit zijn vraagstukken waar de business, riskfuncties en auditors mee te maken hebben bij het beheersen van RPA-risico’s ([Chua18]).

Bovenstaande voorbeelden zijn slechts twee RPA-risico’s waar organisaties in de praktijk tegenaan lopen. Vanuit een breder perspectief denken organisaties na over mogelijke ‘what could go wrong’-scenario’s met de komst van RPA. Figuur 3 geeft een (niet uitputtend) overzicht weer van risicocategorieën met daarbij voorbeelden van risico’s uit de praktijk die zijn geconstateerd bij het auditen van gerobotiseerde processen. Dit betreffen zowel IT- als procesgerelateerde risico’s. Een bekend risico op het gebied van IT is dat robotgebruikersaccounts (bot IDs) onvoldoende worden beveiligd, waardoor deze mogelijk ten onrechte worden gebruikt door medewerkers om transacties te verwerken. Vanuit een procesgedachte bestaat het risico dat bepaalde essentiële controles binnen het proces niet meer worden uitgevoerd, omdat de business het werk overlaat aan de robot. Hierdoor komt het voor dat afwijkingen in het proces niet tijdig worden geconstateerd. Dit kan voor de organisatie resulteren in het ontstaan van nieuwe risico’s. Verder is het van belang om bij het identificeren van risico’s rekening te houden met de gekozen RPA-softwareoplossing. Er bestaan veel verschillen tussen de RPA-softwaretechnologieën in relatie tot hoe zij binnen de softwarepakketten omgaan met specifieke RPA-risico’s.

C-2019-4-Pouwer-03-klein

Figuur 3. Praktijkvoorbeelden van RPA-risico’s per risicocategorie. [Klik op de afbeelding voor een grotere afbeelding]

Beheersing van RPA-risico’s

Nadat een organisatie heeft geïdentificeerd welke risico’s zich mogelijk voordoen bij het robotiseren van bedrijfsprocessen, denken de business, IT en het robotics team (eventueel onderdeel van het Center of Excellence) gezamenlijk na over de beheersing hiervan. In de praktijk blijkt dat vanuit enthousiasme en onbekendheid met de nieuwe technologie deze stap onvoldoende doordacht wordt genomen. Dit kan uiteindelijk leiden tot gerobotiseerde processen waarbij onvoldoende is nagedacht over de nieuw opgetreden risico’s. Daarom zijn beheersmaatregelen nodig wanneer een organisatie overgaat tot het implementeren van RPA. In lijn met de geïdentificeerde risico’s zijn de controls te classificeren in twee categorieën, namelijk (1) General IT Controls (GITCs) en (2) procesgerelateerde controls.

  1. GITCs voor RPA zijn vaak onderdeel van een RPA governance en control framework en onder meer gefocust op de vraag of robots werken zoals vooraf is bedoeld en in hoeverre de juistheid, volledigheid en integriteit van data worden gewaarborgd. Tijdens de ontwerpfase zijn controls nodig voor het ontwikkelen van RPA-scripts bestaande uit bijvoorbeeld RPA-ontwikkelstandaarden, toegangsbeveiliging voor robotaccounts en wachtwoorden, toegangsbeveiliging voor data die de robot nodig heeft om het proces uit te voeren en uitvoerige testen met realistische testscenario’s om de juiste werking van de robot in een testomgeving vast te stellen. Nadat het gerobotiseerde proces in een productieomgeving actief is geworden, is het van belang incidenten omtrent de robot tijdig te constateren en op te volgen. Omdat robots werken via de userinterface van bestaande applicaties, die onderhevig zijn aan veranderingen, kan het voorkomen dat de robot zelf ook aanpassingen behoeft. Hiervoor dient een RPA-change-managementproces te worden nageleefd. Voor een effectieve werking dienen deze beheersmaatregelen voor ieder gerobotiseerd proces consistent te worden toegepast gedurende de gehele solution-developmentlevenscyclus. Zie ook figuur 4 inzake IT-beheersmaatregelen specifiek voor RPA.
  2. Daarnaast is het van belang om voorafgaand aan het robotiseren van processen een risicobeoordeling te maken specifiek per proces. Wanneer organisaties overgaan tot het robotiseren van bijvoorbeeld financieel kritische processen, maar daarbij onvoldoende nadenken over de processpecifieke risico’s, ontbreken de relevante beheersmaatregelen. Het is daarom van belang om voorafgaand aan het robotiseren van een proces een risicoanalyse per proces te verrichten. Uit deze analyse kan bijvoorbeeld blijken of de business verantwoordelijk blijft voor uitvoeren van bepaalde inputcontroles, procesgerelateerde goedkeuringen en afwijkingenanalyses, of dat de robot een deel van deze controles uitvoert. In het laatste geval kunnen deze controles als application controls worden toegevoegd in het ontwerp van het proces. Verder blijft de business (deels) verantwoordelijk voor de performance van de robot en zullen periodieke controles moeten plaatsvinden om vast te stellen of de robot alle transacties inclusief uitzonderingen juist en volledig heeft verwerkt. De risicobeoordeling per proces dient herzien te worden als het proces conform het change-managementproces genoemd bij punt 1 wordt aangepast. Hierbij zal opnieuw een analyse gedaan moeten worden op de risico’s en de bijbehorende mitigerende maatregelen.

Het identificeren, analyseren en beheersen van risico’s van gerobotiseerde processen is een dynamische activiteit waarover niet alleen gedurende de implementatiefase nagedacht moet worden. Het is van belang dat deze activiteiten deel uitmaken van het standaard internal-audit-/controlproces.

Auditen van robots

Nadat organisaties zijn gestart met een proof of concept (waarin de werking van de RPA-technologie is aangetoond) en vervolgens het aantal gerobotiseerde processen toeneemt, komen robots doorgaans in het vizier van auditors. Uiteraard is het van belang bij een audit op RPA een analyse uit te voeren op het risicoprofiel van de gerobotiseerde processen. Echter, wanneer financieel kritische processen worden uitgevoerd door robots en de medewerkers die voorheen het proces uitvoerden niet meer werkzaam zijn bij de organisatie, wordt de vraag of de robot betrouwbaar werk levert, steeds relevanter. Het daadwerkelijk auditen van robots vergt een aanpak die nieuw kan zijn voor auditors. Specifieke kennis over de RPA-softwareoplossing en van de achterliggende geprogrammeerde code is vereist, alsmede kennis van het gerobotiseerde proces. Uit de praktijk blijkt dat het auditen van robots vaak wordt uitgevoerd door een samengesteld team, bestaande uit zowel financial auditors als IT-auditors.

Voor auditteams is het van belang te kunnen steunen op de effectieve werking van de interne beheersmaatregelen rondom de robot. Alvorens een conclusie te kunnen trekken over de betrouwbaarheid van de gerobotiseerde processen, focussen auditteams zich op de volgende stappen:

  • begrip krijgen van de bestaande RPA-governance, inclusief rollen, verantwoordelijkheden, processen, de geïmplementeerde IT-infrastructuur en inzicht in de aanwezige/geregistreerde gerobotiseerde processen middels een RPA-inventory;
  • begrip krijgen van het risicoprofiel van de gerobotiseerde processen (use cases) en inzicht verkrijgen in welke processen op de planning staan om gerobotiseerd te worden in het komende jaar;
  • inzicht krijgen middels walkthrough met het robotics team en de business owner om de risico’s en application controls te bepalen;
  • inzicht krijgen in alle procesgerelateerde informatie omtrent het gerobotiseerde proces, waaronder bot IDs, applicaties waar de robot mee werkt, in- en outputbestanden van de robot, proceseigenaren, technische eigenaren et cetera;
  • op basis van de geïdentificeerde robots en het bijbehorende risicoprofiel analyseren welke robots relevant zijn om auditwerkzaamheden op uit te voeren;
  • overeenkomstig met de eerdergenoemde RPA-risico’s en bijbehorende interne beheersmaatregelen focussen op het vaststellen van de opzet, het bestaan en de effectieve werking van de GITCs, application controls en procesgerelateerde controls.

Net als andere applicaties en infrastructurele componenten dienen ook softwarerobots goed beheerd te worden en dus vanuit IT gezien te vallen onder de IT-beheersmaatregelen. Deze beheersmaatregelen dienen de continuïteit en de juiste werking van de geautomatiseerde processen te waarborgen en te voorkomen dat ongeautoriseerde wijzigingen kunnen plaatsvinden dan wel dat gebruikers zich ongeautoriseerd toegang kunnen verschaffen tot de gerobotiseerde processen en de RPA-tool. In figuur 4 hebben we een aantal beschouwingen opgenomen inzake de algemene IT-beheersmaatregelen specifiek voor RPA.

C-2019-4-Pouwer-04-klein

Figuur 4. IT-beheersmaatregelen voor RPA. [Klik op de afbeelding voor een grotere afbeelding]

Om een duidelijk beeld te krijgen van wat de precieze gedragingen zijn van een robot, kan het zeer nuttig zijn om de verrichte transacties van robotgebruikersaccounts nader te analyseren. Op basis hiervan zijn uitzonderingen in het proces of bijzonderheden gemakkelijker op te merken en is direct duidelijk of de robot geen transacties verwerkt die in de basis niet zijn gerobotiseerd. Middels de technologie van process mining ([Bisc19]) kan het gerobotiseerde proces, inclusief procesuitzonderingen verwerkt door de robot, eenvoudig inzichtelijk worden gemaakt. Het auditteam kan de uitkomsten van deze analyse gebruiken om bijvoorbeeld afwijkende transacties van de robot nader te analyseren.

Klantcasus RPA en internal audit

KPMG is betrokken geweest bij een internal audit op gerobotiseerde processen van een internationale organisatie. Aangezien RPA een automatiseringsoplossing is die zowel business- als IT-kennis vraagt, bestond het internal-auditteam uit teamleden met verschillende disciplines. KPMG heeft de gerobotiseerde processen gecontroleerd op basis van ervaringen met RPA-specifieke risico’s en implementaties van bijbehorende interne beheersmaatregelen. Uit deze audit bleek onder meer dat gerobotiseerde processen in productie werden genomen zonder voldoende te zijn getest en dat gebruikersaccounts van robots werden misbruikt voor het verrichten van transacties buiten de scope van de robot om. Om succesvol nieuwe technologieën zoals RPA te implementeren is het van belang een risico-inschatting te maken van specifieke RPA-risico’s en hier in een vroeg stadium de juiste relevante stakeholders bij te betrekken. Dit zorgt ervoor dat gerobotiseerde processen voldoen aan compliancestandaarden en RPA-risico’s zijn gemitigeerd.

Conclusie

De komst van nieuwe technologieën zoals RPA laat grote voordelen zien voor organisaties. Om uiteindelijk succesvol te zijn in het verbeteren van bedrijfsprocessen, is het van belang om in een vroeg stadium rekening te houden met RPA-specifieke risico’s. Het is essentieel om kritisch na te denken welke interne (IT-)beheersmaatregelen van toepassing zijn bij het implementeren en beheren van gerobotiseerde processen. Uiteindelijk is het voor (internal-)auditteams belangrijk om de juiste disciplines erbij te betrekken, te begrijpen wat deze nieuwe technologie inhoudt en hoe men te werk gaat wanneer de auditklant gerobotiseerde processen heeft binnen de (backoffice)processen.

Referenties

[Bisc19] Di Bisceglie, C., Ramezani Taghiabadi, E., & Aklecha, H. (2019). Data-driven insights to Robotic Process Automation with Process Mining. Compact 2019/3. Geraadpleegd op: https://www.compact.nl/articles/data-driven-insights-to-robotic-process-automation-with-process-mining/.

[Chua18] Chuah, H. & Pouwer, M. (2018). Internal Audit en robotic process automation (RPA). Audit Magazine nr. 4, 2018. Geraadpleegd op: https://www.iia.nl/SiteFiles/AM/AM2018-04/LR_AM4_2018_pg36%20RPA.pdf.

[Boer19] Boer, M. de & Leupen, J. (2019). DNB grijpt in: Rabo moet tienduizenden dossiers opnieuw doorlichten op witwasrisico’s. Financieel Dagblad, 22 november 2019. Geraadpleegd op: https://fd.nl/ondernemen/1325348/rabo-moet-tienduizenden-dossiers-opnieuw-doorlichten-op-witwasrisico-s.

[Hend19] Hendriks, J., Peeters, J., Pouwer, M., & Schmitt Jongbloed, T. (2019). How to enhance Master Data Management through the application of Robotic Process Automation. Compact 2019/3. Geraadpleegd op: https://www.compact.nl/articles/how-to-enhance-master-data-management-through-the-application-of-robotic-process-automation/.

[Jutt18] Juttmann, J. & Doesburg, M. van (2018). Robotic Process Automation: how to move on from the proof of concept phase? Compact 2018/1. Geraadpleegd op: https://www.compact.nl/articles/robotic-process-automation-how-to-move-on-from-the-proof-of-concept-phase/.

[KPMG18] KPMG Nederland (2018). Internal Audit and Robotic Process Automation. KPMG Assets. Geraadpleegd op: https://assets.kpmg/content/dam/kpmg/nl/pdf/2018/advisory/internal-audit-and-robotic-process-automation.pdf.

The lessons learned from did-do analytics on SAP

In addition to the traditional SAP authorization analysis (‘can-do’ analytics), the more enhanced did-do analytics enables you to understand the real risks resulting from Segregation of Duties (SoD) conflicts. There are many reasons to use did-do analytics for your SoD analyses. There are, however, also potential pitfalls to consider when using did-do analytics for your SoD analysis. Therefore, we have summed up the 10 most important lessons learned of did-do analytics.

Introduction

Authorizations in your SAP system enforce which transactions a user can execute, and which reports they can start, but it also determines all the critical transaction codes a user is not allowed to run. As part of the financial statement audit or just as a separate SAP authorization scan, the auditor can analyze the Segregation of Duties (SoD) conflicts and critical access rights – based on the assigned authorizations, making use of various automated tools.

The auditor could also review the statistical data, often referred to as STAD data, and make an analysis of whether the authorized transaction codes have been initiated by end-users. Such an analysis already provides an indication whether the company audited is at risk of SoD conflicts and critical access. However, this statistical data analysis has some significant limitations. First, the statistical data is usually only retained for the last two or three months, if available at all. This omission can be overcome by frequently downloading the statistical data and keeping it in a database in order to extend the look-back possibilities. Another, more important, limitation is the fact that this data is rather meaningless. When an end-user started a transaction code accidently or just out of curiosity, it is already recorded by the STAD data. Also, when the end-user has started the transaction code, it is still unknown what kind of activity this end-user has performed within the SAP program. Some transaction codes are used for both display and maintenance and is some cases the end-user only has used the transaction code for display activities.

In the Compact 2011 Special, an article was published on “Facts to Value” [Lamb11], and how data could be transformed into value-added data through data analytics. Data analytics allows us to see actually breached SoD conflicts by parsing transactional data, such as purchasing documents that contain information about the purchased goods, the user that created the purchase order, date and time stamp and purchase amount. This results in an overview of the financial impact of the access risk.

There are two levels of data analytics that can be applied to perform an authorization analysis. The data analysis can be performed by looking at all the users that have created a SAP document on one side and approved a document on the other side of the SoD conflict. In other words, the analysis doesn’t look for the exact same document that has been created and approved by the same user. The results most probably will contain several false positives; however, it already provides a good understanding of the access risks at stake, as it provides information if there are any users that have created entries for both parts of a SoD conflict.

To go one step further, the data analysis can also use the actual data that has been used or created, resulting in the actual breached access risks for the same purchase order, sales order, etc. The results can be used as input for a detailed analysis to identify whether critical SoDs have been breached and if unauthorized changes to master data and conflicting postings have been made. This information can be used to detect and mitigate the risk of Segregation of Duties conflicts.

C-2019-1-Hallemeesch-01-klein

Table 1. Different types of SoDs explained. [Click on the image for a larger image]

This article focuses on the level 4 did-do authorization analysis where bookings and changes are applied to the same document. There are some important pitfalls to look for and some learned lessons to keep in mind when using these types of analyses.

Why use did-do analytics?

Actually breached SoD analysis results can be used for multiple purposes, such as:

  • updating the SoD ruleset;
  • mitigating access risks;
  • improving the authorization setup;
  • indicating fraud risks.
Updating the SoD ruleset

As will be described in lesson 1, the SoD ruleset used often does not contain all relevant transactions. The output of did-do analytics will provide information on the actual usage of transactions. If there are transactions in your output that are not in the ruleset, the ruleset can be deemed incomplete. By leveraging the output of your analysis to update the ruleset, the quality of SoD monitoring at level 1 will significantly increase.

Mitigating access risks

Can-do SoD monitoring (level 1) can result in high numbers of results, which is then interpreted as a ‘high risk’. For example: “there are 2,000 users that can create a purchase order and a purchase invoice”, every internal or external auditor will probably list this as an audit finding. However, if based on the output of did-do analysis it is found that only one user actually breached the conflict, for only a few documents, the result can be used to mitigate the access risk.

Improving the authorization set-up

A combination of the previous two purposes can be leveraged to further improve the authorization set-up of SAP. When the analysis results show transactions that should not be used or many users that have access they do not really need, the authorization set-up in SAP can be adjusted with that information. The transactions that provide access to a certain activity can be limited and access which users do not use can be revoked. Those users will probably never notice their absence.

Indicating fraud risk

Some SoD conflicts are classic fraud scenarios, e.g. changing the vendor bank account (to a private account) and processing payments to that vendor. The did-do analytics will show the actual values that were processed for each of these scenarios and provide an indication of fraud risk.

Lessons learned (the 10 most valuable tips)

1. The GRC ruleset is not always accurate

The results of the did-do SoD analyses often reveal the transaction code that is used for the specific posting. When comparing the transaction codes included in the GRC ruleset with the transaction codes found in the did-do SoD analysis results, one can sometimes see discrepancies. For instance, custom transaction codes have been developed to post or release specific documents. These custom transaction codes are not always included in the GRC ruleset, leading to false negatives. Did-do SoD analyses deal with these false negatives and show all users that have a SoD conflict.

We also see that many of the actually breached SoD conflicts are caused by communication or system users like WF-BATCH. In this case, further investigation is required as postings might have been made in other applications (like SAP SRM), which stresses the importance to include cross-system Segregation of Duties rules in the ruleset. In other occasions, postings could be made via workflow tools or Fiori apps, where users actually do not have access to the SAP transaction codes to post a document, but are still able to create the relevant documents.

2. The more difficult the analyses, the less probable the SoD

There are organizations that require complex actually breached SoD. The combination between creating or changing purchase requisitions is not allowed to be combined with processing payments. To perform the analysis of actually breached SoDs basically means that multiple transactional tables have to be linked.

Examples include:

  • EBAN (for requisitions);
  • EKKO/EKPO (for purchasing);
  • RBKP and RSEG (for logistic invoices);
  • BKPF/BSEG (for financial postings).

In between these “process steps”, there might be other SoD controls in place, such as:

  • purchase requisitions and release purchase requisitions;
  • purchase order and release purchase orders;
  • purchase orders and invoice entry;
  • invoicing and releasing a blocked invoice (in case of differences);
  • invoicing and payment proposal;
  • invoicing and payment run;
  • payment proposal and payment run.

Data analytics based on all these SAP tables (not mentioning the supporting tables) complicates the analysis. Additionally, the performance of the analysis might be very poor as it makes use of some of the larger tables within SAP. Most people in the field of risk and control would say that the likelihood of the risk occurring would be very low as there are multiple process steps involved and often multiple other controls are implemented within the process. The number of key tables involved in an analysis of actually breached SoD provides an indication of the process steps involved and as such, the likelihood that a critical SoD conflict can occur. Good practice is to just implement actual breached SoD on consecutively steps within a process and on those process steps with direct involvement of master data.

3. Difference between creation and change

Conflicts in the SoD ruleset often involve creation and maintenance of a document at each side of the conflict, e.g. creation or maintenance of vendor master data <> creation or maintenance of vendor invoices. In this case, analyzing the actual breaches of this conflict is not straightforward, as it can be split up in eight different conflicts (see box). All these conflicts use multiple tables which need to be connected in order to retrieve the appropriate results.

Example of conflicts with creation and change of vendor master data

  • creation of vendor master data (tables LFA1/LFB1/LFBK/TIBAN) <> creation of vendor invoices in MM (tables RBKP/RSEG)
  • creation of vendor master data (tables LFA1/LFB1/LFBK/TIBAN) <> maintenance of vendor invoices in MM (tables RBKP/RSEG/CDHDR/CDPOS)
  • maintenance of vendor master data (tables LFA1/LFB1/LFBK/TIBAN/CDHDH/CDPOS) <> creation of vendor invoices in MM (tables RBKP/RSEG)
  • maintenance of vendor master data (tables LFA1/LFB1/LFBK/TIBAN/CDHDH/CDPOS) <> maintenance of vendor invoices in MM (tables RBKP/RSEG/CDHDR/CDPOS)
  • creation of vendor master data (tables LFA1/LFB1/LFBK/TIBAN) <> creation of vendor invoices in FI (tables BKPF/BSEG)
  • creation of vendor master data (tables LFA1/LFB1/LFBK/TIBAN) <> maintenance of vendor invoices in FI (tables BKPF/BSEG/CDHDR/CDPOS)
  • maintenance of vendor master data (tables LFA1/LFB1/LFBK/TIBAN/CDHDH/CDPOS) <> creation of vendor invoices in FI (tables BKPF/BSEG)
  • maintenance of vendor master data (tables LFA1/LFB1/LFBK/TIBAN/CDHDH/CDPOS) <> maintenance of vendor invoices in FI (tables BKPF/BSEG/CDHDR/CDPOS)

The combination of these result sets is the result set for the SoD conflict.

Furthermore, when analyzing SoD conflicts with a ‘maintenance’ element, it is important to only check for updates (changes) in the records. Inserts (creation) of documents are already covered in the analyses with a ‘create’ element. Moreover, for the analysis with a ‘maintenance’ element, it could be beneficial to check which fields are changed. If the address of a vendor is changed the risk is low, whereas a change of the bank account is high-risk.

4. Fine-tuning (do not report all output)

The output of analyses of actually breached SoDs can be lengthy lists with (potential) conflict results. These lists need to be fine-tuned further to identify possible relevant items that need to be further investigated. Fine-tuning can be tailored in various ways. For example, by looking at the combination between vendor master data and purchase order entry. Are all changes made to vendor master data applicable when entering a purchase order? Should the actually breached SoD analysis only show results when key fields in master data, like the vendor bank account number or the payment terms have been changed. Even though there was a SoD conflict (a user can maintain a vendor and raise a purchase order), in many cases the changes to a vendor master data are related to adjusting an address or contact details, which are less relevant for the SoD conflicts.

The same logic could be relevant for purchase order entry and goods receipt entry. In case purchase orders are subject to a release procedure, the risk level could be lowered. (If the purchase order release is actually performing adequate checks on the purchase order, the vendor used, and the purchasing conditions applied.) Fine-tuning or categorizing the results of an actually breached SoD analysis is a good way to process and analyze the results of these analytics. It will allow a company to focus on critical activities that have occurred without effective SoDs in place.

5. Materiality, what is the value of the output?

The question behind each thorough analysis is: who is the audience for the results? If the audience is the authorization and security team, the perfect analysis result might be technical of nature, with details such as the transaction code used, the posting key, and some organizational values, such as company code and plant location. However, when the targeted audience is business-focused, these details might not be of interest to them at all. When ‘the business’ is the target audience for the results of did-do analytics, there are two main focal points:

  1. How many times was the SoD breached?
  2. What is the (financial) value that was at risk?

In other words, likelihood and impact. If a conflict has occurred 1,000 times, but the total amount that was affected in these 1,000 conflicts is only 1,000 euro as well, the conflict becomes irrelevant. On the contrary, if a conflict occurred once, but the transaction amount was one million euros, the conflict is very serious and further investigation will need to be conducted. Adding a monetary value to the results can help your audience to understand the output and take quick action.

Caution: when assigning a value to your SoD analysis, it is important to document the considerations. If the conflict is purchase orders vs. purchase invoices, there might be a higher value in one of the two. In that case, a decision needs to be made which value is reported and why. Moreover, if a part of the analysis involves creation and maintenance, duplicate documents might occur on the list. In such cases, the unique document value should be reported.

6. Master data is maintained beyond financial years

Did-do analytics enables interception of all master data changes performed in combination with all the transactions that result in a SoD conflict by any user. A common mistake is the selection of the period for which the data is downloaded and analyzed. For instance, only data maintained or changed in January is downloaded, because this reflects the scope for the analysis. However, master data could have been maintained or changed prior to this period. Therefore, it is good practice to download the changes to the master data for at least the last three months or even the entire previous year. To limit the file size of the download, a filter could be applied to only retrieve those changes that have a financial impact, such as bank details for customers and vendors and pricing for materials.

All in all, it is paramount to prevent false negatives in a did-do analysis. It is therefore important not to just download and analyze the period in scope, but also before and after this period.

7. Transactional data is entered beyond financial years

Besides master data, transactional data is also a very important element of each SoD conflict. Like master data when performing a did-do analysis, for instance for the month June, it is better practice to also download and analyze the data entered and maintained prior to the specific month in scope. For example, when analyzing the SoD conflict of entering a vendor invoice on one side and approving the same vendor invoice on the other side. Both activities could have taken place in the same month. However, it is also possible that the invoice is approved one or more months after the vendor invoice has been entered. Therefore, when analyzing just a single month (specific month in scope), one could end up with false negatives by not reporting the real risks.

8. Reconciling data with the source data is very important

For data analytics in general, it is always important to ensure your data is complete and accurate. To prove, reconciling the data with the source is crucial. There are several questions to be asked up-front:

  1. Is the period in which the data was downloaded closed or is it a moving target?
  2. Does the download contain a value (e.g. purchase orders) or is it data without value (e.g. master data)?
  3. Is the SAP-system setup to use old G/L (table GLT0) or new G/L (FAGLFLEXT)?

To verify completeness, the easiest way is to make row counts of the table you are downloading and then comparing them with your analysis environment (e.g. SQL Server or SAP HANA) once you have uploaded the data. However, if the system you are downloading from is a moving target, it might be necessary to make a row count before and after the download to ensure your download falls in between. E.g. if the table has 100 records before the download and 102 after the download, the 101 records in your data indicate that you are reasonably complete, provided that the target is moving.

Tip: for some tables in SAP, it is difficult to perform row counts as they are too big, and would cause the application to time out (e.g. CDHDR). In this case, multiple row counts can be performed such as row counts per class. It can also be counted by using transaction SE16H.

Another method which is often used to ensure accuracy of a data download is reconciling the general ledger tables (BKPF/BSEG in SAP) with the trail balance (GLT0 or FAGLFLEXT table in SAP). If it does not reconcile, it proves the inaccuracy of the data.

Caution: only reconciling your data with the trial balance is not enough, as this only proves the accuracy of the General Ledger tables.

In case the data is automatically interfaced to the analysis environment (i.e. SLT for an SAP HANA database), the completeness and accuracy can be ensured by properly governing the interfaces between the source system (e.g. SAP) and the analysis environment (e.g. SAP HANA).

9. Not everything is fraud, not everything is unauthorized

Performing a did-do analysis provides very interesting information about conflicting activities that have been performed by a user. However, these activities should not immediately be classified as fraudulent user activities in a system. Consider that the organization has provided the authorization to perform these activities. These users might even have been trained in performing both activities, and might not even be aware that they are performing activities that are qualified as SoD conflicts and a risk when performed by a single person. Also, there are many examples where the local finance department only consists of a few staff members, and consequently, makes it impossible to properly separate duties at all. In these smaller locations, other controls (manual or procedural controls) might be in place that mitigate the risk. The analytics on actually breached SoDs can also be used to provide input to determine mitigating actions.

10. Level 3 analytics is good input for remediation

When looking at level 3 did-do analytics, the analysis is not tracking the same document, but performs the analysis from a user perspective. For example, which users have created a document and also approved a document? The results might contain false positives for obvious reasons, as the user did not breach the SoD for the same document. Nevertheless, there is a real risk. Often, if a user can break through the level 3 SoD, the user is also able to break it for the same document, and therefore level 4. Level 3 did-do analytics are less labor-intensive and less complex than level 4 analyses, as there is no mapping required on the document numbers. This makes the results of a level 3 best suitable to initiate remediation activities to resolve authorization issues and access risks in your SAP system.

Bonus: Do not overestimate the performance of your analysis system

As most of the did-do analyses involve a large amount of data from different source tables, the analysis environments performance will be impacted. Therefore, it is important to consider system performance in every sub step of creating the analyses. The following guiding principles can be helpful:

  • use inner joins where possible, these are faster than left joins;
  • create indexes on the key fields in each table used in the analysis;
  • start with creating basic views which only contain the bare minimum fields and add additional fields (e.g. document names) in the output view only;
  • avoid nested queries (and cursors);
  • avoid using calculated fields in the JOIN and WHERE clause.

In some cases, performance might still be poor. For those special occasions, it can be beneficial to first perform a level 3 analysis and find out which users potentially have a did-do conflict. These users can then be placed in the WHERE statement of the analysis, in order to limit the result set and increase performance.

Conclusion

Did-do analytics are of added value compared to the traditional authorization audits that only focus on the authorization objects and values within your SAP system. The did-do analytics shows the real risk in terms of (financial) value that is at stake. We have summed up 11 lessons to get the most out of your did-do analytics.

Did-do analytics can be used to update your SoD ruleset; add transaction codes which are part of the did-do output to your SoD ruleset to improve the level 1 SoD results. Second, did-do analytics can be used as mitigating control for the outcome of level 1 SoD results; if a user has access to certain SoD, it doesn’t mean that this user actually breached this conflict. Third, the combination of the first two purposes can be a trigger and input for a redesign of the SAP authorization concept; to assign or remove certain authorization based on the did-do outcome. Lastly, did-do analytics shows the actually breached SoDs, including the value of the risk.

References

[Lamb11] Drs. G.J.L. Lamberiks RE, Drs. P.C.J. van Toledo RE RA, Q. Rijnders MSc RA, Facts to Value: Transforming data into added value, Compact 2011/0, https://www.compact.nl/articles/facts-to-value/, 2011.

[Veld14] M.A.P. op het Veld MSc RE, Drs. B. Coolen RE, Data & Analytics, Compact 2014/2, https://www.compact.nl/articles/maurice-op-het-veld-en-bram-coolen-over-data-analytics/, 2014.

IoTT: Internet of Trusted Things?

The value of trust in data and information has increased with the adoption of new technologies such as the Internet of Things (IoT). In terms of control, experts often mention security measures of the devices, but forgo advising measures to control the data flowing between these devices. In this article we will highlight the importance of controlling data and give concrete examples along six dimensions of control on how to increase your trust in your IoT applications.

Introduction

Until recently, most big data initiatives focused on combining large internal and external datasets. For instance, an organization that sees a reduction in sales to customers under thirty, but have difficulty pin-pointing the reasons for this decline. Insights distilled from the combination of their internal customer data with external sentiment analysis based on social media then shows that this specific customer group has a strong preference for sustainability when purchasing products. The organization can respond to this insight by launching a new product or specific marketing campaign. Such initiatives are typically born as proof-of-concepts, but are gradually developing into more frequently used analytical insights. Some organizations are already moving towards transforming these (ad-hoc) insights into more business-as-usual reporting. The transformation from proof-of-concept to business-as-usual leads to the necessity of processing controls, consistent quality and a solid understanding of the content, its potential use and the definitions used in both systems as well as reports. This means that for the above-mentioned analytics on customer data and social media data, it is necessary to be certain that the data is correct. Data might need to be anonymized (for example for GDPR – data privacy requirements). It has to be validated that the data is not outdated. And the meaning of the data must be consistent between systems and analysis. The need for control, quality and consistency of data & analytics is growing, both from a user perspective, wanting to be certain about the value of your report, as well as from a regulatory perspective. So, it’s critical to demonstrate your data & analytics is in control, especially when the data is collected from and applied to highly scalable and automated systems, as is the case for the Internet of Things.

Awareness of the value of data in control

Whether it is a report owner, a user of Self-Service-BI, a data scientist or an external supervisory authority, all require insight into the trustworthiness of their data. As said, this process of bringing analytical efforts further under control is a recent development. Initially, organizations were more focused on the analytical part than on the controlling part. But more importantly, controlling data the entire journey from source to analysis is usually complex and requires a specific approach for acquiring, combining, processing and analyzing data. So, although companies are increasingly proven in control, this progress is typically rather slow. The primary reason is that obtaining this level of control is challenging due to the complexity of the system landscape, i.e. the amount of application systems, the built-in complexity in (legacy) systems and the extensive amount of non-documented interfaces between those systems. In most cases, the underlying data models as well as the ingestion (input) and exgestion (output) interfaces are not based on (international) standards. This makes data exchange and processing from source to report complex and increases the time it takes to achieve desired levels of control. Organizations are currently crawling towards these desired levels of control, although we expect this pace to pick up soon: all because of the Internet of Things.

Wikipedia [WIKI18] defines the Internet of Things (or IoT) as: “the network of devices, vehicles, and home appliances that contain electronics, software, actuators, and connectivity which allows these things to connect, interact and exchange data.” Or simply: IoT connects physical objects to the digital world.

IoT seems as much a buzzword as big data was a few years ago ([Corl15]). The amount of publications on the topic of IoT and IoT-related pilots and proof-of-concept projects is rapidly increasing. What is it about? An often-used example is the smart fridge, the physical fridge that places a replacement order via the internet at an online grocery store when the owner of the fridge takes out the last bottle of milk. While the example of the refrigerator is recognizable and (maybe) appealing, most of these sensors is far simpler and has much higher potential due to its scale for organizations than merely automating grocery shopping.

A practical IoT example of sensor data used in a very practical manner is developed in the agricultural sector. Dairy farmers have large herds that roam grasslands. Nowadays, cows in these herds are being fitted with sensors to track their movement patterns, temperature and other health-related indicators. These sensors enable the dairy farmers to pin-point cows in heat within the optimal 8-30-hour window, increasing the chance the cow will become pregnant and therefore optimize the milk production.

For organizations, IoT provides the opportunity to significantly increase operating efficiency and effectiveness. It can mitigate costs, for instance when used to enable preventive maintenance which reduces the downtime of machines – sometimes even by days. Sensor data can be derived from smart (electricity) meters and smart thermostats at your homes, the fitness tracker around your wrist. But similarly, also from the connected switches within railroads, smart grid power breakers or humidity sensors within large agricultural projects to fine-tune irrigation. All these devices and sensors collect and analyze data continuously to improve customer response, process efficiency and product quality.

Given this potential, it is expected that more and more companies are setting up initiatives to understand how IoT can benefit their business. We predict that the IoT will be commonplace within the next five years. The effect is that due to the number of sensors and continuous monitoring, the data volume will grow exponentially, much faster than the current growth rate. This means that the level of control, quality and consistency required will grow at least at the same rate. At the same time, IoT data requires more control than ‘traditional’ data. Why? IoT has its owns specifics, best illustrated by the two examples.

Example 1: smart home & fitness trackers

For both smart home devices and fitness trackers, it’s typically the case that if the data stays on the device, controlling the data is mostly limited to the coding of the device itself. If the device is connected to an internal corporate system, control measures such as understanding where the device is located (e.g. is the device in an office or in a laboratory) must be added. And once the data is then exchanged with external servers, additional technical controls need to be in place to receive and process the data. Examples include security controls such as regular security keys rotation, penetration testing and access management. Furthermore, when tracking information on consumers that either reside in a house or wear a fitness tracker, privacy regulation increases the level control required for using data from these devices. This requires additional anonymization measures for example.

Example 2: Industrial IoT (IIoT)

Although, consumers are gaining understanding of the value of their data and require organizations to take good care of it, the industrial application of IoT is also growing. Companies in the oil and gas, utilities and agricultural industries are applying IIoT in their operations;We do believe there is an important role for the industry (manufacturers, platform operators, trade associations, etc.) to ensure that their products and services offer security by design and would come ‘out of the box’ with security measures in terms of encryption, random passwords, etc. ([Luca16]).

For example, imagine a hacker targeting a switch on the point of failure in an attempt to derail a train.

Understanding where risks lie, how reliable insights are and what impact false negatives or false positives have is therefore essential to embedding IIoT in the organization in a sustainable manner.

The platform economy1

We see the sheer volume of IoT data, the fact that captured data needs to be processed (near) real-time and the amount of controls as the main drivers for the development and growth of so-called ‘IoT platforms’. An IoT platform is the combination of software and hardware that connects everything within an IoT ecosystem – such an ecosystem enables an entity (smartphone, tablet, etc.) that functions as a remote to send a command or request for information over the network to an IoT device. In this way, it provides an environment that connects all types of devices. It also can gather, process and store the device data. To be able to do that in a proven and controlled manner, the platform should contain the required controls. Examples include having an anonymization function, the ability to set up access controls and having data quality checks when data is captured by the platform. And lastly, the platform allows the data to be either used for analytical insights or transferred to another platform or server. In some cases, the data generates so much value by itself that it is not shared but sold ([Verh17]). The platform than act as a market space where data can be traded. This is called ‘data monetization’ and its growth mirrors the IoT platform growth.

Controlling your data – a continuous effort

Being in control of your data from source to analysis is not an easy effort. As mentioned, controlling data is complex due to differences within and between (IoT) devices or systems that capture data. The fact that data is exchanged within organizations, where there is a consistent use of data, is usually a challenge. But also, with external parties, which usually leads to even bigger differences between data, data quality and data definitions. Both internal and external data exchange therefore increase the need for e.g. data quality insights, data delivery agreements and SLAs). This is further increased by the growing regulatory requirement for data & analytics contributes. GDPR has been mentioned earlier in the article. Yet there are other less well-known regulations, such as specific financial regulations like Anacredit or PSD2. Yet, complex doesn’t automatically mean that it is impossible. The solution is having a standard set of controls in place. This set needs to be consistently used within and between systems – including the IoT platform. To illustrate: when the data enters the IoT platform, the data quality must be clear and verified, the owner of the data must be identified and the potential (restrictions for) usage of the data must be validated. The continuous monitoring of and adhering to these controls means that organizations are perfectly capable of being in control.

In short, controlling the data from the device to usage means that different measures need to be in place of the data flow. These measures are related to different data management topics,2 as visualized in Figure 1.

C-2018-4-Verhoeven-01-klein

Figure 1. The six dimensions considered of most influence to managing IoT data. [Click on the image for a larger image]

Ad 1

To ensure that changes to the infrastructure, requirements from sensors or processing and changes to the application of the data are adopted within the processing pipeline and throughout the organization, decent data governance measures should be in place. For instance, a data owner needs to be identified to ensure consistent data quality. This will facilitate reaching agreements and involve the people required to address changes in a structured manner.

Ad 2

The consistency of data is to be ensured by metadata: the information providing meaning or context to the data. Relevant metadata types such as data definitions, a consistent data model, consent to use the data as well as corresponding metadata management processes need to be in place. The need for robust and reliable metadata about IoT data in terms of defining its applicability in data analysis became painfully clear in a case we recently observed at an organization where data from multiple versions of an industrial appliance was blended without sufficiently understanding the difference between these versions. In this case, the manner of which an electricity metering value was stored in the previous version was with a 16-bit integer (a maximum value of 6553,5 kWh), while the metering value in the most recent version was stored with a 32-bit integer (a maximum value of 429.496.729,5 kWh). Since the values observed easily exceed 6553,5 kWh, the organization had implemented a solution to count the number of times the meter had hit 6553,5 and returned to 0 kWh. Their solution was simple: a mere addition of 6553,5 kWh to a separately tracked total for each of their devices. This however, had caused spikes in the results that seemed unexplainable to business users and caused confusion with their end customers.

Ad 3

Data security measures should be in place such as access and authentication management, documented consent of the data owner to let the data be used for a specific purpose, regular penetration testing and a complete audit-trail for traceability of the data ([Luca16], [Verh18]). Awareness of this topic is growing due to a stream of recent examples of breached security through IoT devices, such as the hacking of an SUV and a casino’s aquarium ([Will18]).

We do believe there is an important role for the industry (manufacturers, platform operators, trade associations, etc.) to ensure that their products and services offer security by design and would come ‘out of the box’ with security measures in terms of encryption, random passwords, etc. ([Luca16]).

Ad 4

For decent interoperability of data between sensor, processing nodes and the end user, exchange protocols to move the data need to be specified and documented, preferably based on international standards when available, such as ISO 20022 (standard for exchanging financial information between financial institutions, such as payment and settlement transactions). Important to consider are the physical constraints that traditional data processing don’t often pose. In the case of the dairy farm, the farmer places a limited number of communication nodes on his fields. This means that the cows won’t be in range of these nodes continuously. Furthermore, these field nodes are connected wirelessly to a processing node on the farm, which, in turn, is connected to the cloud infrastructure in which information of all cows worldwide is processed.

Ad 5

Even if the sensors, processing nodes and infrastructure are reliable, a good deal of attention should be paid to identifying to which data quality criteria these components should be measured against. In the case of IoT, the question is very much focused on what is important for a specific use case. For cases in which the information of interest is dependent on averages, such as body temperature or dimensions, such as distance travelled, missing out on 5 to 10% of potential measurements doesn’t pose an enormous risk. On the other hand, in a scenario in which anomalies are to be detected obtaining complete data is essential. Examples include response times of train switches and security sensors. In other cases, the currency (or: timeliness) of the measurements is much more important when immediate action is required, such as in the case of dairy cows showing signs of heat stress. Determining which quality dimensions should be monitored and prioritized must be decided on a use case by use case basis.

Ad 6

Examples of data operations include storage replication, purging redundant, obsolete and trivial data, enforcing data retention policy requirements, archiving data, etc. Like data quality, organizations should start by identifying which specific data operations aspects should be considered. The best method to address this is through use cases, as these aspects are important for use cases that, for example, rely on time series analysis, (historic) pattern detection or other retrospective analyses.

Conclusion

Increasing control of Internet of Things applications is necessary to apply trusted insights in (automated) decision-making. In practice, trusted insights derived by Internet of Things applications data often turns out to be a challenge. This challenge is best faced by not only focusing this control from a system or application point of view. Controlling secure access and usage, or the application of the insights from a privacy point of view is a good start for trusted IoT insights. But it also requires a fundamental reliance on the insights received, quality of data and the applicability of data per defined use case. This means that the total set of required measures and controls is extensive. When you increase the controls and measures, the trustworthiness of IoT insights increases. But it also important not to drown in unnecessary measures and controls. Better safe than sorry is never the best idea due to its complexity and volume. By using a sufficient framework, such as the KPMG Advanced Data Management framework, organizations know the total amount of required measures and controls – which mitigates the impulse to be over complete. And at the same time by having a complete framework, an implementation timeline for controls and measures can be derived based on a risk-based approach.

Notes

  1. For the sake of this article, we limit our consideration of the IoT platforms to their data management functionalities.
  2. The topics mentioned are part of the KPMG Advanced Data Management framework that embodies key data management dimensions that are important for an organization. For the sake of this article, we have limited the scope of our considerations to the topics most applicable for practically managing IoT data. A comprehensive overview of data management topics can be found here: https://home.kpmg.com/nl/nl/home/services/advisory/technology/data-and-analytics/enterprise-data-management.html

References

[Corl15] G. Corlis and V. Duvvuri, Unleasing the internet of everything, Compact 15/2, https://www.compact.nl/en/articles/unleashing-the-internet-of-everything/, 2015.

[Luca16] O. Lucas, What are you doing to keep my data safe?, Compact 16/3, https://www.compact.nl/en/articles/what-are-you-doing-to-keep-my-data-safe/, 2016.

[Verh17] R. Verhoeven, Capitalizing on external data is not only an outside in concept, Compact 17/1, https://www.compact.nl/articles/capitalizing-on-external-data-is-not-only-an-outside-in-concept/, 2017.

[Verh18] R. Verhoeven, M. Voorhout and R. van der Ham, Trusted analytics is more than trust in algorithms and data quality, Compact 18/3, http://www.compact.nl/articles/trusted-analytics-is-more-than-trust-in-algorithms-and-data-quality/, 2018.

[WIKI18] Wikipedia, Internet of things, Wikipedia.org, https://en.wikipedia.org/wiki/Internet_of_things, accessed on 01-12-2018.

[Will18] O. Williams-Grut, Hackers once stole a casino’s high-roller database through a thermometer in the lobby fish tank, Business Insider, https://www.businessinsider.com/hackers-stole-a-casinos-database-through-a-thermometer-in-the-lobby-fish-tank-2018-4?international=true&r=US&IR=T, April 15, 2018.

CuRVe – Analyzing Regulatory Reporting

Financial institutions are required to comply with regulatory reporting according the Capital Requirements Directive (CRD IV). This set of regulations and directives obliges financial institutions to report (among others) on the borne credit risk and the capital requirements. Examples of regulatory reporting include COREP and FINREP. In this article we discuss the CuRVe tool that eases the analyses of such reports and helps grasp the essence of the reported figures.

Introduction

Regulators, e.g., The Dutch Central Bank (DNB) and The European Central Bank (ECB), have been paying more and more attention to regulatory reporting, i.e., prudential reporting, such as COREP. Consequently, the bank’s management needs to be well informed about the reported figures, for them to be able to discuss these figures more effectively with the regulators. To assist banks (or credit institutions in general) in this process, CuRVe has been developed to facilitate in the following matters:

  • validating the reports based on the European Banking Authority (EBA) and DNB validation rules;
  • providing a dashboard, including results of diverse sets of Data Analytics, trend analyses and visualizations, which enables the user to quickly grasp essential figures and anomalies;
  • the detection of outliers and discrepancies between several (subsequent) reporting periods.

CuRVe

The CRD IV package instructs the European Banking Authority (EBA) to request both capital and financial information from European banks (more generally European credit institutions and investment firms). To obtain this information, the EBA has developed reporting frameworks, which include among others the following:

  • COmmon REPorting (COREP) in which capital information needs to be reported. This covers for example credit risk, market risk, operational risk and own funds.
  • FINancial REPorting (FINREP) in which the financial information needs to be specified. The FINREP is based on international financial reporting standards (IAS/IFRS).

Generating this type of regulatory reports has proven to be a cumbersome process. Not only due to the technical issues that may rise during the conversion of such reports into the mandatory reporting format (XBRL), but also due to the complexity of business rules which the reports must adhere to. In addition, more complexity is involved in the process, as the required data may be sourced from many different locations and systems. Furthermore, a lack of resources to generate and review the reports on a timely basis has also proven to be a burden for banks. As a result, getting the reports ready and submitting them in time may become a primary goal, while being in control and comprehending the reported figures may diminish. To remedy this trend, it has become vital to be able to perform analytics on such reports, in order to be able to easily and fully comprehend the reported figures.

Towards this end, the CuRVe tool first transforms the CRD IV report (which is in XBRL format) into tabular data and subsequently applies the EBA validation rules to the report, to validate its internal consistency and in general its compliance with the EBA standards (for more information, see the box about “Data Point Model and XBRL”). Then, the report is subjected to several analytics, of which the results are visualized through an interactive (web-based) dashboard. The dashboard includes filters that can be applied to slice and dice or drill down into the data, allowing for visual inspection of the templates within the reports in a more intuitive way.

CuRVe Validation

CuRVe enables users to easily identify issues within the CRD IV reports, before submitting these to the ECB or other local authority. The CuRVe engine validates the reports based on the EBA validation rules. These rules are issued by EBA and test the validity, consistency and plausibility of the reported figures. Dutch banks must submit their CRD IV reports through “het Digitaal Loket Rapportage” (DLR), after which these reports will be subject to the EBA validation rules and additional DNB data quality checks. If any validation rule results in a blocking error, the report will be rejected by the DNB.

A basic validation rule as shown in Table 1, compares two values on the C 01.00 template of a COREP report. The formula states that the reported value in row 720 in column 10 should be equal to the negative of the value reported on row 970 in column 10. A failed validation will be reported in a standardized validation report.

C-2018-4-Morabit-t01-klein

Table 1. Basic EBA validation rule. [Click on the image for a larger image]

The list of validation rules, as published by the EBA (currently version 2.7.0.1) contains 4.527 rules distributed across all CRD IV reports. These validation rules can result in more than one test, as one rule may apply to many rows and columns within a single report. Consequently, this can result in tens of thousands of validation tests. CuRVe includes a methodology to automatically test all the applicable rules for a CRD IV report and generates an overview of the failed validations. The CuRVe validation engine can process all EBA validation rules – from basic formulae to the more complex ones. Table 2 shows several validation rules along with the severity of the rule.

C-2018-4-Morabit-t02-klein

Table 2. EBA validation formulae examples. [Click on the image for a larger image]

CuRVe Analytics

The analytics reflect experience and insights gained over the years regarding the assessments of regulatory reporting. KPMG’s Risk & Regulatory specialists have used their in-depth knowledge to enhance the various analytics. The analyses show multiple cross sections of the reports and give insights in trends for key parameters on a quarterly basis. In this manner, irregularities and outliers may easily be detected in several parts of the reports. CuRVe allows the stakeholders, such as the bank’s management and auditors, to understand the CRD IV reports better and ask or answer relevant questions. In the past years, CuRVe has already proven its added value within the KPMG audit practice. The results of the tool have been frequently used to perform risk assessments and analytical procedures on the reports, as part of the audit process.

Figure 1 depicts an example from the set of analytics which is included in CuRVe. One of the COREP requirements is to classify each exposure into a certain exposure class (depending on the features of the underlying instrument). This analysis shows the distribution and the development of the exposure classes over time. Exposure classes that tend to be too large compared to one another or to the previous reporting period might indicate for instance an increased concentration risk. The drill-down functionality allows further examination of the exposure classes, by inspecting the included risk weights (which are used to calculate the required capital that the bank must hold) and how these have developed over time.

C-2018-4-Morabit-01-klein

Figure 1. Development over time of the exposures per exposure class and the risk weights that are represented in these exposure classes. [Click on the image for a larger image]

Another example of an analysis that is performed within CuRVe relates to compliance with regulation. This shows the (standardized) risk weight per exposure class against benchmark risk weight bandwidths based on the regulation. A screenshot of such an analysis is shown in Figure 2. The expectation is that the risk weights (corresponding to the various exposure classes) fall within the defined bandwidth. When this is not the case, the dots will turn red instead of green, which might indicate an erroneous risk weight. Each dot corresponds to the lowest/average/highest risk weight (depending on the filter set) of a reporting period.

C-2018-4-Morabit-02-klein

Figure 2. Visualization of standardized risk weight per exposure class relative to regulation. [Click on the image for a larger image]

A final example (Figure 3) of an analysis that is executed within CuRVe concerns the graphical breakdown of exposure. The higher the exposure amount in a country, the darker the color of the country in the dashboard. Filters can be applied to further customize the analysis. Additionally, it is possible to further drill down, to see for example the various applicable exposure classes within a certain country.

C-2018-4-Morabit-03-klein

Figure 3. Geographical breakdown of exposures amounts. [Click on the image for a larger image]

Next to the discussed analyses, the CuRVe dashboard includes sixteen other analyses that provide valuable insights. By doing so, multiple cross sections of the reports are visualized and anomalies, trends and possible discrepancies between the sequential reporting periods are spotted. Finally, CuRVe also leaves room to include models that reflect the Single Supervisory Mechanism (SSM) principles. These principles represent the holistic approach of the regulators to assess the bank’s risk and capital position. The regulators use among others the governance, information relating to the bank’s business model and Key Risk Indicators (KRIs), which quantify risk areas (such as market risk, liquidity risk, credit risk, etc.) to perform a risk assessment. The KRIs may easily be calculated/obtained from the CRD IV reporting, i.e., COREP, LCR (Liquidity Coverage Ratio), etc. This type of information is therefore already included in CuRVe. The additional information relating to the governance and the bank’s business model will, for this reason, allow assessments that will be more in line with the regulators’ risk assessment of the bank.

Data Point Model and XBRL

At first sight, an XBRL1 file looks like an XML2 file which has been encrypted, combined with a lot of complex codes. And due to the way of recording the reported values in an XBRL file, the size of the file is significantly bigger than probably expected for recording only a couple of thousand values, which are reported in a regulatory report. For example: it is no exception that a report consisting of 350 values may lead to an XBRL file of 2.300 rows with ‘encrypted code’. In this example, less than 15% of the number of rows in the XBRL file contains the reported value itself.

To understand which information is included in an XBRL file, or to import the data from an XBRL file into a database to perform data analytics, the EBA Data Point Model (DPM), published and maintained by the EBA, is required. By combining the data in the XBRL file and the DPM, you can find the corresponding coordinate (template, row, column) in the regulatory report for each reported value in the XBRL.

The content of the DPM, and how to associate the XBRL with the DPM, is not a straightforward process. This will be clear when analyzing the DPM, an Access Database of 500 MB containing almost 80 tables, which is just the DPM framework. Some of these tables have hundreds to thousands of rows, and one table counts more than a million rows. The tables in the DPM contain information with respect to the current version of the DPM, but also with respect to all other older versions (taxonomies).

CuRVe is a tool that can convert each XBRL file (see Figure 4 for an example) regarding COREP, FINREP, Large Exposure, LCR and NSFR into a ‘regular’ table, i.e. a table in which the reported value and the corresponding template, row and column are stored in just a single row. All taxonomies in the DPM are imported in CuRVe, so CuRVe can import XBRL files from years ago with older taxonomies, and XBRL files which are based on the newest taxonomy.

Once the XBRL report has been converted to a flat table, the next step is to validate the report based on the EBA business rules.

C-2018-4-Morabit-04-klein

Figure 4. COREP reporting in XBRL format. [Click on the image for a larger image]

Conclusion

This article deals with how different regulatory reporting schedules may be converted to tabular data, validated and analyzed using CuRVe. This allows the CuRVe users such as analysts, the bank’s management or auditors to quickly review and gain valuable insights into the banks’ regulatory compliance, reported figures, data quality, completeness and accuracy of the report using easy-accessible (web-based) dashboards.

As a result, CuRVe may contribute in reducing the regulatory burden – for instance, through preventing re-submissions to the regulator (due to errors in the report) and preparing the management for any (report-related) queries from the regulator. In addition, (internal/external) auditors may exploit CuRVe to prepare risk assessments, perform analytical procedures and challenge the reported figures as part of their regulatory reporting audit program.

Notes

  1. For more information about XBRL, see: https://nl.wikipedia.org/wiki/XBRL.
  2. For more information about XML, see: https://nl.wikipedia.org/wiki/Extensible_Markup_Language.

Trusted analytics is more than trust in algorithms and data quality

Trusting data for analytics provides challenges and opportunities for organizations. Companies are addressing data quality within source systems, but most are not yet taking sufficient steps to get the data used for analytics under control. In this article we will take a closer look at how the more traditional data management functions can support the dynamic and exploratory environment of data science and predictive analytics. We look at existing customer challenges in relation to these topics as well as the growing need for trusted data.

Verify your trust in your data & analytics

Organizations become increasingly dependent on data and results of analytics. For more traditional purposes such as Business Intelligence or reporting, there is an increasing awareness of the value of good data quality. This awareness is also in place for organization which focus on innovation, they have developed detailed analyses to understand customers better, which has led to made-to-measure products, pricing and services for their clients. Next to that, data-driven regulation is fast expanding, which also relies heavily on good data quality. The well-known GDPR (data privacy) is an example of such data driven regulation, but also BCBS#239 (collecting data on risk aggregation for Banks) and Solvency II (proving in control data for insurers) for financial services as well as data requirements for EU food regulations. In order to be able to keep up with all these – quite fast-changing – developments, organizations increase their usage of data and analytics for their reporting, better understanding and servicing their customers and to comply with regulation.

As the value of data & analytics increases, so is the awareness of users of associated products, e.g. report owners, management, board members as well as (external) supervisory authorities. And with that increasing awareness comes the growing need to rely on trusted data and analytics. These users are therefore looking for insights that ensure trustworthy data and analytics ([KPMG16]). For instance, understanding that the data they use is correct. Or from an analytics perspective that analyses are done in accordance with ethical requirements and meet the company’s information requirements. Trustworthy data quality is not a new topic; in the last decade, organizations have focused on data quality, yet mostly in source systems.

With the further maturing of these analytics initiatives, many organizations now want to extend data quality from source systems to reporting and analytics. One of the side effects of this development is that the analytics pilots and initiatives organizations have in place, are now also examined on how to further mature them, moving from pilots for analytics to sustainable solutions. In short, the relevance of trustworthiness of both data and analytics is increasing. Which requires data quality to provide complete, accurate, consistent and timely insights, and of algorithms used for analytics which are repeatable, traceable, demonstrable and of consistent analytics – in accordance with ethics and privacy requirements ([Pato17]).

This trustworthiness in practice can be challenging for organizations. Although organizations have invested in improving the quality of their data – still the data quality and data definitions are not yet always consistent throughout the entire organization. And as most organization are still at the pilot level for establishing their analytics environment, building trust in analytical algorithms is even more complex.

A good starting point to increase the trust in both data and analytics is a so-called data and analytics platform – for instance in the shape of a “data lake”. In this context, a data platform can be considered as the collection of data storage, quality management, servers, data standardization, data management, data engineering, business intelligence, reporting and data science utilities. While in the recent past data platforms have not always delivered what they promised (in some cases turning the data lake into a data swamp – where data is untraceable and not standardized) ([Scho17]). With that knowledge, organizations already or are currently implementing data-driven initiatives and data & analytics platforms ([GART17]) are now focusing to build a controlled and robust data and analytics platform. A controlled platform can function as the initial step for trusted data and analytics.

Virtual salvation or virtual swamps?

To bring trustworthiness to data & analytics, new technologies such as data virtualization ([FORB17]) are currently being explored. These offerings promise the speed of computation and diversity of integration of a data platform without having to physically store a copy of your original data on a separate environment. Virtualization also offers optimization, scalability and connectivity options with faster access to data. From some perspectives, this sounds even more promising than a data lake. But this increased potential comes with a risk. If a solution that is even more easily “filled” with data is left uncontrolled, the risk of drowning in a “virtual swamp” might be even higher. In general, we see that a trusted data & analytics framework is consistent in bringing trust to ever-developing technology.

Next to the case for trustworthy data & analytics there are several cases which a data platform typically solves:

  • reduction of complexity within reporting infrastructure (such as lower replication costs and associated manual extraction efforts);
  • increased insights in available data;
  • reduction of complexity and dependencies between source applications (by decoupling systems vendor lock-in is reduced when a system change can be absorbed with standard data models and customizable system connections (APIs) in the data platform infrastructure).

Given the potential values of the data platform, it is essential that the risk of turning the prized data platform in a swamp (see box “Virtual salvation or virtual swamps?”) is mitigated. In the following section we present a control framework that will keep the beast at bay and will allow a healthy combination of data exploration to coincide with a data platform under control.

Data platform under control

For decades, data warehouses have supported reporting and BI insights. They applied a so-called “schema on write” approach, which simply means that the user is required to predefine the structure of a table (called “schema” in technical terms) to be able to load (or “to write”), use and process data. Having a predefined structure and extraction, transformation and loading processes developed specifically for your data set ensures predictability and repeatability. However, the structure that the data is written into is typically created for a pre-defined purpose (a report, an interface, etc.). Furthermore, the process of defining, and even more so combining these schemas, is usually time consuming and diminishes flexibility, a crucial aspect in fast-changing environments.

Data platforms bring the flexibility that changing environments require. They offer an alternative “schema on read” approach that allows a user to load data onto the platform without caring for which schema it is loaded into. The platform technology simply takes the data as-is and makes it available to the user as-is. This decreases the time spent on defining schemas or complicated modelling efforts and allows the user more time and flexibility to apply the data. This approach is already taking place: companies have on-boarded as much of data as possible into a data platform, making investments in the expectation that merely making this data available to an user base will kick-start their data-driven business.

As always, the reality is more complex, caused by the fact that the user base is ill-defined, a lack of quality and semantic agreements and context of the available data. This results in data overload that will refer users back to the traditional environments (such as, data warehouses, traditional BI tools or even Excel spreadsheets) and will limit existing users to the data (sets) they know. Furthermore, with the enforcement of the General Data Protection Regulation (GDPR) in place since 25 May 2018, on-boarding sensitive (personal) data onto a platform where many users can access this data without proper access controls and data protection controls (incl. logging and monitoring), exposes the organization to large compliance risks, such as fines.

In the following paragraphs, we opt for an approach to on-board data sets that combines a blended approach of measures for both data and analytics, controlling the ingestion of data sets sufficiently to support compliance, while still enabling innovative data exploration initiatives. The following steps are defined within this blended approach; setting preconditions, deliver prepared data, standardize the data, exposing ready-to-use data, enable traceable analytics and keep monitoring. Figure 1 visualizes these steps.

C-2018-3-Verhoeven-01-klein

Figure 1. The KPMG Data Platform Under Control framework with relevant preconditions and 5 steps for practical trust in analytics. [Click on the image for a larger image]

Step 0: Set up the platform

Setting up a data platform is typically perceived as a technology solution. Considering the challenges indicated in the previous paragraph however, the technical implementation of a platform and its interfaces to source systems should go hand-in-hand with the creation of reference documentation, agreement on standard operating procedures and implementation of a data governance framework.

Sufficiently detailed reference documentation should at least be partially in place. We can distinguish three main categories: enterprise IT and data architecture, a data catalogue and an overview of tooling used throughout the data lifecycle. These documents should be easily available and automated in such a way that users can quickly find the information they are looking for during on-boarding or development activities.

Standard operating procedures should be in place, providing guidance for data processing processes and procedures within the data platform. Examples include: on-boarding of new data sets, data remediation activities, how to deal with changes, incident and limitation procedures. These procedures go hand-in-hand with the data governance framework, which consists of a list of roles involved within these processes and procedures and their corresponding responsibilities. Key critical roles within this governance framework are the user community (data scientists, data engineers), the data operations staff (data stewards, data maintainers) as well as the roles that have accountability over a data source such as a data owner. Ownership should also be considered before the data delivery is started. It encompasses involving the right functions, responsible for the data in the source system and connecting them to the persons responsible for building the data platform. Establishing end-to-end ownership can be a goal, but of primary importance is the focus on agreements on data delivery service levels and the division of responsibilities throughout the data delivery processes at first, so that aspects like sensitivity or intellectual property loss or privacy are given the proper attention and the usability of the data set is tailored to the end-user.

Step 1: Control the data delivery

Data delivery is the correct transfer of data from source systems to the data platform. For data on-boarded on the platform, clear provenance (understanding the origin of the data) must be available. This provenance must also contain the source owner, definitions, quality controls as well as which access rights should be applied. These access rights should specifically be in place to fulfil the increasing demands of privacy regulations such as the GDPR or e-Privacy. After all, the data delivered might contain personal identifiable information details – this needs to be identified when the data is delivered to the data platform and protected by design ([GDPR18]).

Furthermore, when on-boarding data on the platform, the context for data usage must be predefined and the data platform should have controls in place to regulate the usage of data within this context. Next, several measurements should be done to measure the type and quality of the data loaded for use. Of course, the integrity of the data should be ensured throughout the whole delivery process.

Step 2: Standardize the data

Data from different sources are loaded into the platform. This means data will differ in format, definitions, technical & functional requirements and sensitivity. In addition to the access controls of step one, the sensitive data needs to be anonymizatized or pseudonymized ([Koor15]), making it impossible to trace individuals based on their data within the data platform.

After the anonymization, the data is standardized. To be able to perform data analysis, consistent values are required and functional names need to be uniform across different data sets and definitions need to be consistent. Why are definitions important? For example, to do proper marketing analyses, different types of customers need to be distinguished, such as potential customers, customers with an invoice, customers with an account and recurring customers. In case of disagreement between units on these definitions, analyses or decision-making mistakes can be easily made.

Lastly, data quality improvements (or: data remediation) must be applied at this stage to bring the data to its desired quality level to be able support the usage of this data in reports and algorithms ([Jonk12]).

These steps – anonymization, standardization, remediation – occur in this fixed order to realize the data processing procedure. Documenting these activities in a standardized way also ensures the users’ understanding of the data in the data platform (see Step 4). This document contains the followed steps and primarily increases readability and therefore understanding with users and secondarily enables easier integration of processing routines of multiple users of the same data set. Figure 2 shows an example.

C-2018-3-Verhoeven-02-klein

Figure 2. An example of why standardized data processing makes collaboration between scientists easier; a standardized processing procedure allows easier reuse of code, standards and rules. [Click on the image for a larger image]

Step 3: Delivery ready-to-use data

After standardization, anonymization and data quality improvement, the data is in fact ready to be used for analysis purposes. The data has reached ready-to-use status when it can meet the needs of the users, that the user knows what the source is, knows how to interpret the data, trusts the data quality of the data and can obtain formal agreement from the data owner for their intended analysis.

Step 4: Enable sustainable analytics

The previous steps are all focused on controlling the data. However, trusted data & analytics also require controlled usage and analysis activities. Algorithm design should be documented and governed in a similar way to implementing business rules for data quality improvement, with the additional requirements for documentation of versioning, ethical considerations and validation that the working of the algorithm should match its intended goal. By documenting the algorithm including its complete lifecycle (from design to usage to write-off) enhances its sustainability. After all, having a complete overview of the algorithms lifecycle, produces traceable and repeatable analytics.

On a practical note; to keep track of all the activities performed on the data platform an audit trail should be kept. Luckily, many data platforms offer this functionality out of the box. Documenting analyses can be done in specialized software that also enables analyses such as Alteryx, Databricks, SAS, etc. This ensures that the documentation is close to the place where analysts use the data and reduces the effort to maintain separate functional documentation.

Step 5: Keep monitoring

Effectiveness of the extent of control of your platform can be verified through continuous monitoring. Monitoring of effectiveness is an essential part but should be proportional to the size, goal, importance and usage of the data controlled on the platform. Through consistent and fit to measure monitoring it is possible to demonstrate and improve the process steps as described above, the related control framework and quality of an information product once provided to a user from the data platform. Insights provided through monitoring will be used to determine compliance with the current control framework and ultimately to evaluate and refine the data platform controls (e.g. modify data quality rules).

With the increasing the development of data platforms, the development of trusted data & analytics is also a recent phenomenon. It all coincides with the rising need of repeatable and sustainable analytics, as well as examples of previous data platforms have turned into the dreaded data swamp. Therefore, this approach has been adopted across sectors, for instance by an international tier-1 bank, an innovation center and a Dutch energy and utilities company. The level of acceptance of this new way of working differs. Where increased compliance is required, this trusted environment helps to support and resolve complex regulatory requirements. However, from a data science / data analytics perspective, analysts in general perceive this control as interfering in their way of working as they were used to a large degree of freedom roaming around in all data available. It is important to align all stakeholders in the new way of “trusted” working, optimally supporting compliance whilst leaving room for freedom to be able to indeed create (new) insights. This balance maintains progress in the acceptance of trusted data and analytics.

Capture the trust

How do you demonstrate that controls exist and are effectively working after they have been put in place? The evidence for these controls is captured in a so-called “data & analytics way-bill”. It contains the documented activities and results as described above in step 1-5, for example the name of the data set, the owner, where the original data resides, for which purpose it may be used, the level of standardization, etc. etc. This way-bill document ideally automatically captures the output of all controls and measures the controlled on-boarding and usage of a specific data set. Furthermore, it connects the tooling used within an organization to support data governance, capture data lineage, measure data quality, keep a backlog of to be implemented business rules, standards and algorithms, etc.

In order to provide trust in data for analytics, the way-bill has proven to be a valuable device to demonstrate the effectiveness of all controls during the entire process the data set is subjected to; from source through the on-boarding and ultimate usage of data within the platform. This overview does not only provide trust in the data itself, but also in the algorithms used, underlying data quality and supportive technology and architecture.

Conclusion

As outlined in this article, trusted data for analytics consist of a step-by-step approach to realize relevant controls in a data platform to support a compliant, dynamic and an exploratory environment of data science and predictive analytics. Our blended approach combines lessons learned from controlling traditional systems (e.g. pre-defined data structures, data management controls, data definitions, governance and compliance) with the benefits of a dynamic and exploratory data platform (e.g. data lake). With a data platform under control, organizations are able to deal with data in a faster, cheaper and more flexible way. Controlled and ready-to-use data for data science and advanced analytics purposes also offers possibilities for flexible, fast and innovative insights and analyses.

References

[FORB17] Forbes, The expanding Enterprise Data Virtualization Market, Forbes.com, https://www.forbes.com/sites/forbescommunicationscouncil/2017/12/12/the-expanding-enterprise-data-virtualization-market/#10a39dfd40ca, 2017.

[GART17] Gartner, Gartner Survey Reveals That 73 Percent of Organizations Have Invested or Plan to Invest in Big Data in the Next Two Years, Gartner.com, http://www.gartner.com/newsroom/id/2848718, 2016.

[GDPR18] GDPR, Art. 25 GDPR Data protection by design and by default https://gdpr-info.eu/art-25-gdpr/, 2018.

[Jonk12] R.A. Jonker, Data Quality Assessment, Compact 2012/2, https://www.compact.nl/en/articles/data-quality-assessment/?zoom_highlight=data+quality.

[Koor15] R.F. Koorn, A. van Kerckhoven, C. Kypreos, D. Rotman, K. Hijikata, J.R. Bholasing, S. Cumming, S. Pipes and T. Manchu, Big data analytics & privacy: how to resolve this paradox?, Compact 2015/4, https://www.compact.nl/articles/big-data-analytics-privacy-how-to-resolve-this-paradox/.

[KPMG16] KPMG, Building trust in analytics, https://home.kpmg.com/xx/en/home/insights/2016/10/building-trust-in-analytics.html, 2016.

[Pato17] J. Paton and M.A.P. op het Veld, Trusted Analytics, Mind the Gap, Compact 2017/2, https://www.compact.nl/articles/trusted-analytics/.

[Shol17] D. Sholler, Data lake vs Data swamp: pushing the analogy, Colibra website, https://www.collibra.com/blog/blogdata-lake-vs-data-swamp-pushing-the-analogy/, 2017.

Software Asset Management

Een belangrijke voorwaarde om vertrouwen te hebben in een IT-omgeving zijn gedocumenteerde processen rondom softwaregebruik, inclusief bijbehorende licentievoorwaarden. Software Asset Management (SAM) stelt organisaties in staat om op een slimme en effectieve wijze hun softwarerechten te beheren, vanaf het moment van aanschaf tot aan de vervanging ervan. De nieuwste editie van de ISO-norm, ISO/IEC 19770:2017, biedt organisaties handvatten om de gekozen doelstellingen van SAM te realiseren. In dit artikel wordt naast de facetten van de ISO-norm ook ingegaan op de voordelen van SAM, en op welke wijze dit geïntegreerd kan worden binnen een organisatie.

Inleiding

‘SAP claimt 600 miljoen dollar van AB Inbev’, ‘Mars daagt Oracle voor de rechter’ en ‘Nike en Quest verwikkeld in juridisch gevecht’: koppen in de media die allemaal te maken hebben met het gebruik van software en de interpretatie van licentieovereenkomsten.

Op vrijwel alle software rust een intellectueel eigendomsrecht. Applicaties moeten worden ontwikkeld en aangepast aan nieuwe technologieën en continu wijzigende wensen van de afnemers. Softwareleveranciers die softwarepakketten ontwikkelen en verkopen, beogen hun gemaakte investeringen via de exploitatie van de software terug te verdienen. Dit kan door uiteenlopende voorwaarden op te stellen voor de gebruikers van de programmatuur. Door middel van een licentie wordt het gebruiksrecht verschaft, waarin beperkingen kunnen worden gesteld aan het gebruik van de software in bijvoorbeeld een bepaalde gebruiksomgeving, het aantal apparaten, geautoriseerde gebruikers of de rekenkracht van de server. Complexe meeteenheden kunnen voor organisaties desastreuse gevolgen hebben, wanneer de kennis en kunde om deze software op de juiste wijze in te zetten ontbreekt. Meer dan eens ontstaan er problemen met software die op gevirtualiseerd niveau is ingekocht, en vervolgens op fysiek niveau wordt geïnstalleerd.

Softwareleveranciers nemen in hun overeenkomsten vaak clausules op die hen het recht geven om licentieaudits uit te voeren bij hun klanten. Tijdens een dergelijke audit wordt in kaart gebracht of de aangeschafte licenties overeenkomen met de software die daadwerkelijk is geïnstalleerd, of op andere wijze beschikbaar is gesteld aan de gebruikers. Na het vaststellen van de licentiepositie volgen geregeld discussies tussen de klant en leverancier om de geconstateerde licentietekorten op te lossen. Als uitkomst hiervan worden vaak – door gebrek aan inzicht, juridische druk of angst voor boetes – extra softwarelicenties aangeschaft. Meer dan eens betreft dit licenties voor geïnstalleerde software die de organisatie bij nader inzien helemaal niet nodig blijkt te hebben. Zo kan software per abuis worden geïnstalleerd, per ongeluk worden verwijderd, of op onjuiste wijze worden ontsloten, waardoor meer gebruikers toegang hebben dan de bedoeling was (en waarop werd ingekocht). Het kan aanzienlijke negatieve, financiële consequenties voor een organisatie hebben wanneer deze tekorten worden geconstateerd tijdens een licentieaudit. Naast de financiële risico’s zijn er diverse andere risico’s die het gebruik van software en beheer van licenties met zich meebrengt; denk hierbij aan beveiligingsrisico’s, reputatieschade en slecht functionerende software. Zo kan onbeheerde software beveiligingsrisico’s met zich meebrengen. Wanneer het installeren van updates en patches niet op geautomatiseerde wijze plaatsvindt, kan onbeheerde software verouderen, en daarmee een potentieel beveiligingsrisico voor de organisatie vormen. Denk hierbij aan de wereldwijde WannaCry-aanval. Bovendien kunnen security-incidenten en/of negatieve uitkomsten van licentieaudits resulteren in aanzienlijke reputatieschade voor een organisatie. Dergelijke problemen zijn schadelijk voor het vertrouwen van een organisatie in de IT-omgeving. Software Asset Management (hierna SAM) is ontwikkeld om aan deze operationele, financiële en compliance-risico’s tegemoet te komen.

De IT Infrastructure Library (ITIL) ([Rudd09]) omschrijft SAM als alle infrastructuur en processen die noodzakelijk zijn voor het effectief managen, controleren en beschermen van softwarebezittingen binnen een organisatie. Oftewel: het totale proces rondom het beheer en de optimalisatie van de planning, inkoop, implementatie, onderhoud en uitfasering van software assets binnen een organisatie. SAM kan bijdragen aan het ontwikkelen van effectieve processen en waarborgt de continuïteit van de IT-omgeving, waarmee uiteindelijk het vertrouwen in IT wordt vergroot.

In dit artikel wordt, naast een algemene inleiding over Software Asset Management en het toepassingsgebied, ingegaan op de nieuwste ISO-norm: ISO/IEC 19770:2017. Verder worden de volwassenheidsniveaus van organisaties ten aanzien van SAM (uitgedrukt in Tiers binnen ISO 19770) behandeld. Tot slot wordt inzicht gegeven in de integratie met andere bedrijfsprocessen.

Software Asset Management

ISO 19770-ontwikkeling

ISO 19770:2017 is ontwikkeld om organisaties concrete handvatten te bieden om ‘in control’ te zijn ten aanzien van software assets. Het betreft inmiddels de derde grote uitgave van norm 19770 binnen twaalf jaar. De eerste versie uit 2006 beschreef SAM-processen en bevatte harde standaarden om controle uit te oefenen ten aanzien van software assets. In 2012 werden hier enkele nuances in aangebracht, en werd onderscheid gemaakt tussen vier verschillende volwassenheidsniveaus van SAM, ook wel aangeduid als Tiers. Deze Tiers waren respectievelijk ‘Trustworthy Data’, ‘Practical Management’, ‘Operational Integration’ en ‘Full ISO/IEC SAM Conformance’. Het ambitieniveau van deze laatste en hoogste Tier is achteraf bezien wellicht wat onrealistisch gebleken, aangezien voor zover bekend geen enkele organisatie dit niveau heeft weten te bereiken. Mede daarom is in 2017 het aantal Tiers teruggebracht van vier naar drie. Organisaties worden weliswaar handvatten geboden, maar het is aan de organisatie zelf om te bepalen welke activiteiten van belang zijn om haar doelstellingen te bereiken. De drie Tiers zullen later in dit artikel uitvoeriger aan bod komen.

De scope van SAM omvat uiteindelijk elk type software en de gerelateerde assets, ongeacht wat voor type software het betreft en op welke wijze het aan de gebruikers ter beschikking wordt gesteld. Zo kan het bijvoorbeeld gaan om uitvoerende software (zoals een operating system), niet-uitvoerende software (een woordenboek, verschillende lettertypen in een programma, et cetera) of software die niet na een installatie gebruikt wordt, maar bijvoorbeeld op connectie gebaseerd is, of software as a service. Hierbij kan gedacht worden aan het gebruik van software via smartphones, cloud-based software of hosted software.

In veel organisaties is door de jaren heen een wildgroei aan applicaties ontstaan, waarbij gebruikers zelf over rechten beschikken om software te installeren. De oplossing hiervoor is een organisatie-breed uitgerold SAM-beleid, waarbij software centraal beschikbaar wordt gesteld aan gebruikers, en er niets lokaal geïnstalleerd kan worden. Dit is echter niet mogelijk bij BYOD, waar gebruikers uiteraard wel zelf software kunnen installeren. Organisaties kunnen hieraan tegemoetkomen door een beleid te hanteren waarbij duidelijk is wie verantwoordelijk is voor de software op het betreffende apparaat.

Het toepassingsgebied van SAM voor wat betreft het type organisatie varieert bovendien ook. Zo kan een SAM-programma binnen multinationals of in kleinere (MKB)-organisaties worden opgezet, gecentraliseerd of gedecentraliseerd worden opgezet, of worden geoutsourcet ([ISO17-1]).

Aanvullende controls nodig bij verwerking software assets in asset management-systeem

Om de nieuwste versie overzichtelijker en makkelijker te kunnen integreren, is in de versie van ISO 19770 uit 2017 aansluiting gezocht met ISO 55001 over Asset Management. In ISO 55001 zijn standaarden bepaald ten aanzien van het opzetten, implementeren, onderhouden en verbeteren van een managementsysteem voor asset management. ISO 19770 (hierna ISO) bevat ten opzichte van 55001 aanvullende eisen, daar waar het gebruik van software specifieke eisen met zich meebrengt, die bij het ‘traditionele’ asset management niet van toepassing zijn. Deze norm omvat onder andere eisen met betrekking tot:

  • controls ten aanzien van softwaredistributie, -duplicatie en -modificatie, met de nadruk op toegankelijkheid en integriteitsmaatregelen;
  • het creëren van audit trails ten aanzien van toegekende autorisaties en aanpassingen die gemaakt worden aan IT-assets;
  • controls ten aanzien van licensing, onder- en overlicensing, en compliancy ten aanzien van licentievoorwaarden;
  • controls ten aanzien van situaties waarin sprake is van ‘mixed ownership’ en verantwoordelijkheden, zoals bij cloud computing of BYOD-toepassingen;
  • de reconciliatie en integratie van IT-asset management data van bijvoorbeeld financiële systemen ([ISO17-2]).

Voordelen en doelstellingen van SAM

In ISO wordt onderscheid gemaakt tussen twee categorieën voordelen die met SAM gerealiseerd kunnen worden om de bovengenoemde risico’s te mitigeren. Dit zijn enerzijds voordelen op het gebied van kostenbeheersing, anderzijds de realisatie van een hoger niveau van risicomanagement ([ISO17-1]).

Kostenbeheersing

Een asset is iets wat mogelijk of daadwerkelijk waarde heeft voor een organisatie ([ISO14]). Deze waarde kan zowel positief als negatief zijn, afhankelijk van de fase van de levenscyclus waarin de asset verkeert.

Naast de waarde van een (IT-)asset, en daarmee dus ook een software asset, kent de aanschaf van licentierechten in veel gevallen een hoog kostenplaatje. Aan de hand van een verrichte enquête concludeert Spiceworks ([Spic18]) dat doorgaans 26 procent van het totale IT-budget wordt besteed aan de aanschaf en het jaarlijks terugkerend onderhoud van software. In 2017 gaf Gartner ([Gart17]) hiervoor een bandbreedte aan van 18 tot 26 procent. Hoewel het daadwerkelijke percentage per organisatie zal verschillen, kan wel worden gesteld dat de kosten aanzienlijk zijn.

Het beheersen van deze kosten, en daarmee de waarde van een asset vergroten, is een van de belangrijkste doelstellingen die is opgenomen in ISO. Op diverse procesgebieden van SAM kunnen kosten worden bespaard. Bij het onderhandelen over contracten met softwareleveranciers kunnen betere prijzen gerealiseerd worden, wanneer er een scherp beeld bestaat van de behoefte van de organisatie, en welke huidige contracten er afgesloten zijn. Een voorwaarde is wel dat de organisatie beschikt over betrouwbare data, zoals hiervoor beschreven. Niet zelden komt het voor dat organisaties licenties aanschaffen waar ze via een reeds afgesloten contract al recht op hebben. Ook zullen de onderhandelingen met leveranciers minder tijdrovend zijn, als er een duidelijk beeld van de huidige licentiepositie (en behoefte) vanuit de organisatie wordt geschetst. Bovendien kan er zo accurater gebudgetteerd en begroot worden.

Kwalitatief hoogwaardige SAM-processen brengen bovendien met zich mee dat software op efficiëntere wijze wordt ontsloten aan de gebruikers en software beschikbaar wordt gesteld op basis van behoefte, en niet omdat het kan. De beheerskosten en licentie-uitgaven worden hiermee beperkt. Ten slotte stellen monitoring tools de organisaties in staat om nog niet-geïdentificeerde softwarecomponenten te identificeren ([ISO17-1]).

Het managen van verschillende soorten risico’s

Naast de wens, of soms zelfs noodzaak, van directe kostenbeheersing is er bij het gebruik van IT-assets altijd sprake van risico’s. Deze risico’s zijn verschillend van aard, bijvoorbeeld:

  • operationeel (disruptie van IT-beschikbaarheid of verminderde kwaliteit hiervan);
  •  security (autorisatiemechanismen, herkenning van niet-geautoriseerde software en het ontwikkelen van een update- en patchproces);
  • non-compliance (licentie non-compliance, reputatieschade, persoonsgegevens en bijbehorende privacyrisico’s).

De risicocategorieën kennen wel een gemene deler. Niet of verkeerd gemanagede risico’s kunnen leiden tot financiële schade. Dit kan resulteren in directe schade in de vorm van boetes of onnodige extra uitgaven, maar ook in indirecte schade in de vorm van gemiste inkomsten door reputatieschade. Met het implementeren van SAM-processen kunnen deze risico’s deels worden geminimaliseerd.

Het implementeren van alle beschreven operationele processen is, ook volgens ISO, niet voor elke organisatie een realistische optie. Er zal dan ook een weloverwogen keuze voor een acceptabel geacht risiconiveau moeten worden gemaakt. Zo kent bijvoorbeeld kostbare software – met een licentie per processor core in een gevirtualiseerde omgeving – een hoger risico op non-compliance dan een fysiek werkstation, waarop goedkope software is geïnstalleerd die per installatie een licentie vereist. In dit geval helpt SAM om deze software en de waarde ervan in kaart te brengen, op basis waarvan vervolgens een risico-inschatting kan worden gemaakt. Het maken van zo’n risico-inschatting is een onderdeel van het risicomanagement.

ISO schrijft voor dat, op basis van een risico-inventarisatie, verschillende plannen en processen geformuleerd moeten worden om:

  1. risico’s en kansen ten aanzien van IT-assets te identificeren;
  2. veranderingen ten aanzien van eerdere geïdentificeerde risico’s tijdig op te merken;
  3. criteria vast te stellen waarop risico’s beoordeeld worden;
  4. criteria vast te stellen voor welk risico acceptabel is;
  5. eigenaren van risico’s aan te wijzen;
  6. prioriteiten te stellen voor welke risico’s eerder behandeld moeten worden.

Iedere organisatie dient zelf af te wegen welke risico’s acceptabel zijn. Voor IT-assets is gedegen onderzoek naar de mogelijke risico’s geen overbodige luxe. Dit geldt in het bijzonder voor software assets. Het creëren van processen voor het beheer van softwareassets, die ook gemonitord en bijgehouden moeten worden, kan door de veelheid aan producten een onmogelijke opgave worden. Aan de hand van verschillende criteria kan een selectie worden gemaakt van de software assets met de hoogste prioriteit.

Gezien de continue dynamiek van IT-landschappen is het identificeren van risico’s en het bijhouden van de veranderingen ten opzichte van reeds bekende risico’s onontbeerlijk. De bewustwording ([ISO17-2]) van eventuele risico’s aangaande IT-assets bij alle betrokkenen binnen een organisatie wordt steeds belangrijker. In het verleden was een IT-organisatie redelijk goed in staat om het gebruik van IT-assets te beperken of af te schermen. Technologische ontwikkelingen stellen gebruikers echter in staat om steeds meer zelf te doen op het gebied van IT. Dit uit zich onder meer via BYOD en bijvoorbeeld cloud-oplossingen, die rechtstreeks door de gebruiker worden afgenomen en gevuld met data. Deze nieuwe vormen van IT maken het identificeren van risico’s een stuk complexer.

Kortom, het prioriteren van risico’s binnen een organisatie is sterk afhankelijk van de mate waarin deze bepaalde risico’s acceptabel acht.

IT Asset Management Tiers

De processen ten aanzien van het management van IT assets worden gegroepeerd in Tiers, waarmee het volwassenheidsniveau van het door de organisatie geïmplementeerde SAM en de IT asset managementprocessen wordt aangegeven. De Tiers zijn ontwikkeld om tegemoet te komen aan de behoefte van de markt. Het bleek voor veel, met name kleinere organisaties namelijk niet realistisch (of zelfs onmogelijk) om alle processen volledig te implementeren. Tegelijkertijd bleef de behoefte aan zekerheid en licentie-compliance wel bestaan. Dit heeft geleid tot de volgende cumulatieve categorisering, die bijdraagt aan het vertrouwen van een juiste inzet van IT(-assets):

Tier 1: Betrouwbare data

Het bereiken van deze Tier houdt in dat een organisatie ‘weet wat het heeft’, en zodoende besluiten kan nemen op basis van adequate informatie. Een organisatie beschikt in deze Tier over redelijke zekerheid ten aanzien van compliance.

Tier 2: Lifecycle-integratie

Met het bereiken van deze Tier wordt meer efficiency gerealiseerd en worden kostenbesparende maatregelen met betrekking tot de IT-software-lifecycle getroffen.

Tier 3: Optimalisatie

In de derde Tier wordt nog meer efficiency en effectiviteit gerealiseerd, door de nadruk te leggen op diverse functionele managementgebieden, zoals relatie- en contractmanagement, financieel management en servicelevel-management).

C-2018-3-Huijsman-01-klein

Figuur 1. SAM Tiers en procesgebieden – detailbeschrijvingen van de onderdelen van elke Tier zijn terug te vinden in het kader. [Klik op de afbeelding voor een grotere afbeelding]

Procesgebieden van functioneel management van IT-assets (waaronder software assets)

De Tiers van SAM zijn gebaseerd op verschillende functionele IT-asset-procesgebieden. Zoals te zien is in Figuur 1 zijn deze gekoppeld aan de eerste en derde Tier ([ISO17-2]). Per Tier zullen hieronder de elementen worden toegelicht.

Tier 1: Trustworthy Data

Change management

Dit betreft het gecontroleerd plannen van veranderingen, inclusief het rekening houden met en reageren op onverwachte wijzigingen (en het beperken van onbedoelde gevolgen daarvan).

Datamanagement

Proces om ervoor zorg te dragen dat alle IT-assets gedurende de gehele lifecycle op een juiste wijze zijn geregistreerd en geverifieerd. Dit proces is een cruciale voorwaarde voor het hebben van betrouwbare data, en vormt hiermee een noodzakelijk uitgangspunt voor de effectiviteit van andere bedrijfsprocessen. Het verifiëren van data is hierbij een essentieel onderdeel om aan de voorwaarde van betrouwbaarheid te kunnen voldoen.

Licentiemanagement

Dit omvat het proces om een accurate licentiepositie te bewerkstelligen, oftewel: waar heeft de organisatie recht op, en wat is er in gebruik? Binnen dit proces worden periodiek reconciliaties uitgevoerd tussen het actuele gebruik en de beschikbare licenties. Afhankelijk van de gekozen scope van licentiemanagement kunnen rechten aangaande digitale content ook onder licentiemanagement vallen.

Securitymanagement

Proces voor effectieve en gecontroleerde beveiligingsmaatregelen voor IT-assets. Deze maatregelen omvatten toegangs- en integriteitscontrole van de assets in scope en assets die informatie bevatten over IT-assets.

Wanneer de doelstellingen van de bovenstaande vier procesgebieden gerealiseerd worden, is voldaan aan de eerste Tier.

Het managen van de processen in de levenscyclus van IT-assets

Binnen Tier 2 ligt de focus primair op de softwarelevenscyclus (zie Figuur 1) en de doelstellingen binnen deze processen.

Tier 2: Lifecycle Integration

Specificatie

Het proces voor het inventariseren van de behoefte binnen een organisatie en het beoordelen van mogelijke alternatieve scenario’s in relatie tot de aanschaf van IT-assets.

Acquisitie

Proces dat erop toeziet dat de aanschaf van IT-assets op gecontroleerde wijze plaatsvindt en op deugdelijke wijze wordt vastgelegd.

Ontwikkeling

Specifiek gericht op het hebben van een proces op het gebied van software-ontwikkeling en het voldoen aan de eisen die voortvloeien uit IT-asset management.

Ontsluiting / operationele inzet

Proces dat erop toeziet dat het vrijgeven van IT-assets volgens planning en op correcte (geautoriseerde) wijze wordt uitgevoerd.

Uitrol

Proces dat op het inzetten van IT-assets toeziet en tevens hergebruik mogelijk maakt.

Beheer

Proces voor het juist gebruiken van IT-assets. Dit omvat onder andere het monitoren, optimaliseren en verbeteren van de prestaties van de IT-assets. De reeds aangehaalde functionele managementprocessen dienen te integreren met dit proces. Denk bijvoorbeeld aan licentiemanagement, waarmee de operationele inzet van software geoptimaliseerd wordt. Daarnaast vallen de huishoudelijke taken als back-up en opschoning onder beheer.

Inname en herbestemming

Proces voor het verwijderen van IT-assets, inclusief eventueel hergebruik in overeenstemming met dataretentie/-vernietiging-verplichtingen.

Verdieping en optimalisatie van de procesgebieden van functioneel management van IT-assets

Tier 3: Optimization

Nadat de doelstellingen van Tier 2 zijn gerealiseerd (zie hierboven) kan een organisatie besluiten de voordelen van SAM ten volle te benutten, en zich richten op de laatste Tier. Tier 3 bestaat uit de volgende procesgebieden:

Relatie- en contractmanagement

Het effectief managen van de interne en externe relaties aangaande IT-assets. Dit is inclusief de verificatie van het naleven van contractuele verplichtingen, bovenop de verplichting van licentiemanagement.

Financieel management

Proces om de kosten en waarde van IT-assets te monitoren en beheren, inclusief zicht op de kosteneffectiviteit.

Service Level Management

Proces om vitale niveaus van service te definiëren, vastleggen en managen voor geselecteerde IT-assets. Dit proces omvat ook het verifiëren van informatie, wat het daadwerkelijke niveau van service bevestigt.

Overig risicomanagement

Proces om eventuele andere risico’s, die niet onder de andere processen vallen, te identificeren en managen. Het bepalen van de effectiviteit van geïmplementeerde risicomanagementprocessen valt onder (maar is niet gelimiteerd tot) dit proces.

ISO legt bij de beschrijving van deze Tiers veel verbindingen met processen die betrekking hebben op IT Asset Management in het algemeen. Software assets zijn in enkele gevallen ook direct verbonden met fysieke IT-assets. Gezien deze verbindingen kan het aansluiten op reeds bestaande processen een uitgangspunt zijn, waarmee de software assets op een efficiënte wijze kunnen worden beheerd.

SAM in uw organisatie

Een organisatie met een SAM-functie, waarin aandacht wordt besteed aan de beschreven procesgebieden, zal raakvlakken hebben en geïntegreerd zijn met uiteenlopende processen en/of afdelingen binnen een organisatie, die zijn weergegeven in Figuur 2. Hierin wordt schematisch weergegeven welke activiteiten en afdelingen betrokken kunnen zijn bij Tier 1 of 2, en ten slotte bij een optimale inrichting van het SAM, zoals beschreven is in Tier 3. Duidelijk wordt dat de verwevenheid van het SAM met de organisatie toeneemt naarmate een hogere Tier wordt gerealiseerd.

C-2018-3-Huijsman-02-klein

Figuur 2. De SAM-functie binnen een organisatie.

Legenda: donkergroen = personen/afdelingen; groen = Tier 1; lichtblauw = Tier 2; geel = Tier 3. [Klik op de afbeelding voor een grotere afbeelding]

De inkoopafdeling is in deze organisatie verantwoordelijk voor het inventariseren van de behoefte aan software en het contact met de diverse softwareleveranciers. Het betrekken van de afdeling Inkoop is een voorwaarde voor het hebben van betrouwbare data, en daarmee een typisch ‘Tier 1-proces’. Dit geldt ook voor de juridische afdeling, die bij een contractonderhandeling erop toeziet dat er geen verplichtingen worden aangegaan die strijdig zijn met de (interne) compliance.

HR-informatie wordt gebruikt als actuele informatiebron voor de hoeveelheid gebruikers en het ter beschikking stellen van richtlijnen ten aanzien van softwaregebruik binnen de organisatie. Bovendien is het user-lifecycle-management via HR geregeld, en vindt derhalve ook het beschikbaar stellen van de software aan de medewerkers plaats. Wanneer een medewerker weer uit dienst gaat, of een andere functie krijgt, dienen zijn of haar toegewezen licenties weer ingetrokken te worden, zodat deze kunnen worden hergebruikt. Een dergelijke integratie van het SAM met andere bedrijfsprocessen is een voorbeeld van een doelstelling in Tier 2.

Vanuit de afdeling Finance wordt aan de afdeling Inkoop een budget beschikbaar gesteld om te voldoen aan de behoeftes van de organisatie en nieuwe contracten af te sluiten. Finance is verder betrokken bij het uitvoeren van kostenanalyses en de allocatie van het softwarebudget binnen de organisatie. Met name het uitvoeren van kostenanalyses is een voorbeeld van optimalisatie, zoals bedoeld in Tier 3. Een ander voorbeeld van optimalisatie in Tier 3 kan de internal audit–afdeling zijn, die periodiek een audit initieert om na te gaan of de SAM-processen op efficiënte wijze worden uitgevoerd, en wat bijvoorbeeld de compliance-positie per leverancier is.

Het SAM-team coördineert deze processen en draagt zorg voor de realisatie van de doelstellingen, zoals vastgelegd in de drie Tiers. Een SAM-team kan, afhankelijk van de omvang van de diverse softwareportefeuilles, een of meerdere licentie-experts hebben. Gezien de complexiteit van licentiemetrieken (denk bijvoorbeeld aan metrieken als ‘authorized user single install’, of per ‘processor value unit’) vergt deze functie noodzakelijke vakkennis om compliant te blijven. Zo hebben met name de grotere organisaties bijvoorbeeld een IBM-, Microsoft-, Oracle-, of SAP-licentie-expert in dienst; niet alleen om compliant te blijven, maar ook om licentieaudits af te handelen, die vanuit de leveranciers periodiek uitgevoerd worden.

Conclusie

Uiteindelijk is het aan de organisatie zelf om het ambitieniveau ten aanzien van SAM te bepalen. De nieuwste ISO biedt organisaties meer vrijheid om zelf hun ambities vast te stellen, en dit zal niet voor elke organisatie de hoogste Tier betreffen. Voor de ene organisatie zal het realiseren van Tier 1 voldoende zijn: het beschikken over betrouwbare data. Van andere organisaties, met grotere softwareportefeuilles en een grote afhankelijkheid van IT, mag men verwachten dat het ambitieniveau hoger gelegd wordt, door SAM-processen te integreren met overige bedrijfsprocessen, en zodoende meer doelstellingen van SAM te realiseren. Door aan te sluiten bij de IT-asset management-norm biedt ISO enkele handvatten om deze procesintegratie soepeler te laten verlopen. Gezien de intrede van cloud-omgevingen naast de bestaande IT-infrastructuur neemt de complexiteit alleen maar toe. Wil een organisatie intern, maar ook naar buiten toe, het vertrouwen uitdragen dat alles onder controle is, zal elke organisatie ambities op het gebied van SAM moeten hebben. Continue aandacht voor softwarelicentie-vraagstukken en -gebruik levert kostenbesparingen op, minimaliseert bedrijfsrisico’s en vergroot daarmee het vertrouwen in de IT-omgeving.

Literatuur

[GART17] Gartner, Gartner IT Budget: Enterprise Comparison Tool, Gartner.com, http://www.gartner.com/downloads/public/explore/metricsAndTools/ITBudget_Sample_2012.pdf, 2017.

[ISO14] ISO/IEC, ISO/IEC 55000: 2014. Asset management – Overview, principles and terminology, 2014, par. 3.2.1.

[ISO17-1] ISO/IEC, ISO/IEC 19770-5: 2017. Information technology – IT Asset Management – Part 5: Overview and vocabulary, 2017, p. 11.

[ISO17-2] ISO/IEC, ISO/IEC 19770-1: 2017: Information technology – IT Asset Management – Part 1: IT asset management systems – Requirements (ISO/IEC 19770-1:2017, IDT), 2017, p. vi., p.9, 10,19, 27-30.

[Rudd09] C. Rudd, ITIL V3 Guide to Software Asset Management, The Stationary Office, 2009, p. 4.

[SPIC18] Spiceworks, The 2018 State of IT, Spiceworks.com, https://www.spiceworks.com/marketing/state-of-it/report/, 2018.

A practical perspective on the EBA ICT Risk Assessment Guidelines

The European Banking Authority (EBA) has issued guidelines for the assessment of the ICT risk at large banks which became effective as of January 1st, 2018. In this article we elaborate on the background and content of these guidelines, the impact for banks, the comparison of these guidelines in relation to other regulatory requirements on ICT and how banks can provide an answer to the EBA guidelines based on IT tooling. The EBA asked the large banks to fill out an ICT questionnaire at the beginning of 2018. The expectation is that on a yearly basis this request will be made towards the banks and the scope will be expanded to other banks in the future. KPMG developed a tool that facilitates this yearly process of submission of the assessment to the EBA.

Introduction

If we take a look at banks in the current environment, we cannot deny the fact that banks turned more and more into IT-driven companies with banking licenses. In the operation of its business for customers, IT plays a pivotal role. This results in the fact that banks are highly dependable on their IT, and increasingly place their trust in their IT systems to carry out daily operations. As a consequence, it is not surprising that regulators, and in this case, the European Banking Authority (EBA), are also interested in how banks address the dependency on IT in its operations and addresses related information and communication technology (ICT) risks. With this in mind we do see that regulators have a high interest in how the ICT risks are managed and how trust in IT is achieved and maintained. A diversity of guidelines and regulations has been issued over time on the topic of ICT. The EBA guidelines on ICT Risk Assessment under the Supervisory Review and Evaluation process (SREP) is one of many, and will certainly not be the last one. However, one can argue how all of these guidelines and requirements relate to each other, and whether there is an overlap between them. This article provides insight into the EBA ICT risk assessment guidelines and gives an impact analysis in terms of how to comply, where will it go to, how to address overlap, and how to efficiently address the requirements e.g. by means of tooling.

C-2018-3-Beugelaar-01-klein

Figure 1. Timeline release of ICT related regulation by European Banking Authority (EBA). [Click on the image for a larger image]

Background of the EBA ICT risk assessment guidelines

Technological innovation plays a crucial role in the banking sector from a strategic standpoint, as a source of competitive advantage, as it is a fundamental tool to compete in the financial market with new products, as well as through facilitating the restructuring and optimization of the value chain. Due to this, banks are forced to depend on their IT systems and consequently place their trust into it. A number of trends are a result of the increasing importance of ICT in the banking industry, two of these trends include:

  1. the emergence of (new) cyber risks, together with the increased potential for cybercrime and the appearance of cyber terrorism ([AD17], [WSJ17]);
  2. the increasing reliance on outsourced ICT services and third-party products, often in the form of diverse packaged solutions, resulting in manifold dependencies and potential constraints and new concentration risks ([CIO15], [CoWe14]).

Acknowledging the growing importance of ICT systems, and therefore the increasing potential adverse prudential impact of failures on an institution and on the sector as a whole (due to the cross-border nature of this risk), the EBA launched the Guidelines on Information and Communication Technology (ICT) Risk Assessment under the SREP to enhance the existing SREP Guidelines, establishing common practice and application by National Competent Authorities in ICT risk assessment and strengthening prudential supervision ([EBA17-1]).

The guidelines aim to ensure the convergence of supervisory practices and achieve uniformity in the assessment of the ICT risk under the SREP, and are further specified in the EBA Guidelines on common procedures and methodologies for the SREP. The topics that are being covered in the guidelines address the mentioned trends and include the background and scope addressed in Table 1.

C-2018-3-Beugelaar-t01-klein

Table 1. Topics addressed in the EBA ICT Risk Assessment Guidelines. [Click on the image for a larger image]

When considering the topics in Table 1, an overlap with other (existing) regulations appears at first glance. Concerning ICT security risks, the Dutch Central Bank issued the Self-Assessment for Information Security based on the Cobit 4.1 framework [(DNB17]) and PSD2 Guidelines on the security measures for operational and security risks of payment services ([EBA17-2]).

On the topic of ICT outsourcing risks, requirements were issued in the past by both the Dutch Central Bank as well as the European Central Bank (ECB). In 2006 the ECB published their guidelines on outsourcing ([CEBS06]), explaining that in context of outsourcing, ultimate responsibility for daily management and management of risk lies with the financial institution and cannot be delegated to the outsourced party. Recently, as of December 2017, the ECB expanded these guidelines by also including recommendations on the use of cloud service providers by financial institutions ([EBA17-3]). The Dutch Central Bank followed a similar approach in the past: the requirements for outsourcing in general and cloud computing in specific were launched simultaneously ([DNB14a], [DNB14b]).

ICT data integrity risk requirements have an overlap with the BCBS239 principles for effective risk data aggregation and risk reporting ([BCBS13]), Anacredit ([ECB16]) and General Data Protection Regulation ([EUPA16]). For a full overview, please see the comparative analysis further on.

Impact analysis: what is the practical impact on banks?

As for the practical impact on banks, these guidelines require banks to make an inventory on how they address the topics in the ICT risk guidelines (i.e. by formulating internal controls), to be able to demonstrate compliance if the ECB asks for further elaboration and substantiation. Overlap with other IT regulations increase the importance of having insight into what is already addressed via other regulations. Having this overview helps banks in efficiently and effectively addressing new requirements on ICT risk, and prevent any duplication in answering to requests of regulators. The use of for instance GRC systems will help gain the total overview. In the next paragraph we elaborate on how to determine potential gaps in compliance with guidelines.

The overlap between the EBA ICT risk guidelines and previous regulations creates a need for banks to clearly identify the sources of ICT risks in the EBA guidelines, that are not (fully) addressed by prior regulations. For these “potential gaps”, banks will need to take measures (varying from preventative to detective in nature) in order to mitigate these unaddressed sources of ICT risk.

Table 2 provides a comparative analysis between the guidelines and other IT regulations, through a high-level mapping of the different ICT risk topics of the EBA guidelines to existing regulations. This is needed to identify the extent of overlap and gaps, so that banks can take action and fulfill their compliance with the EBA ICT risk guidelines.

C-2018-3-Beugelaar-t02-klein

Table 2. Comparison of EBA ICT Risk Guidelines vs. existing regulations. [Click on the image for a larger image]

Based on Table 2, we see that the EBA ICT risk Guidelines overlap with the DNB Information Security Framework and Payment Service Directive 2 (PSD2) guidelines for the specific ICT risk topics. For DNB Information Security Framework, the main gaps lie in the ICT data integrity risk, whereas in PSD2 ICT Change, risks are not discussed at all. Furthermore, the DNB Information Security Framework does not address the exception of the handling process of ICT data integrity, and the risk reporting and data aggregation capabilities in the context of the BCBS239 regulation.

There are also gaps in the domains of ICT security risks and ICT change risks, as the DNB Information Security Framework does not sufficiently cover aspects of regular and proactive threat assessments for ICT security, security and vulnerability screening of changes and source code control. A possible explanation for the mentioned gaps is that DNB based its Information Security Framework on the COBIT4.1 framework, which dates back to 2007 ([ITGI07]). It is – to some extent – plausible to say that eleven years ago, ICT security, ICT change and ICT data integrity risks were not as prevalent in the banking sector and pervasive in nature as they are today. PSD2 does address security in the Guidelines, but focuses more on security in the context of payment processing.

ICT outsourcing risk is a topic that is addressed by multiple regulations on Dutch Central Bank level, as well as EBA level.

Apart from the smaller gaps mentioned above, the main point of attention for banks is the ICT Governance and Strategy domain of the EBA Guidelines, as it represents the largest gap in terms of coverage with the existing regulations. The guidelines in this domain are – among others – directed towards alignment between the ICT and business strategy, involvement of senior management bodies, assignment of roles and responsibilities for the implementation of ICT programs. These topics are not incorporated into any ICT related regulation. They are, however, discussed in the COBIT4.1 control framework ([ITGI07]), which can form a starting point for potential implementation. Only the aspect of positioning the ICT risk in the risk management framework of the banks is addressed in the DNB Information Security Framework and PSD2 Guidelines. Furthermore, the impact on banks of not being able to comply with the guidelines ICT Governance and Strategy is high, as the ICT Governance and Strategy is at the basis of a secure and in-control IT organization.

IT tooling for EBA ICT Risk Assessment

In order to address the gaps as discussed previously and measure the level of compliance with the EBA ICT Risk Guidelines, KPMG has developed an IT tool (the KPMG EBA ICT Risk Assessment Tool). This tool incorporates the EBA ICT risk assessment guidelines by formulating a set of questions for each of the ICT topics and ranks the answers on a scale of 1 to 4, 1 being no discernible risk and 4 representing a high level of risk.

The tool is designed to allow maximum adaptation to the banks in scope. First of all, it allows the banks to assess the compliance bank-wide or on a subsection of the bank (international subsidiaries to business lines within one country branch). This places the correct focus and enables comparison and benchmarking between locations and/or business lines. Secondly, it gives the choice between a quick scan and detailed assessment depending on the level of exposure of the bank to ICT risks. Whereas the former option only allows evaluation of the most significant points in the EBA ICT Risk Guidelines, the latter covers all aspects of the guidelines.

C-2018-3-Beugelaar-02-klein

Figure 2. Main screen assessment tool. [Click on the image for a larger image]

Thirdly, the user is able to scope the applicable ICT risks and exclude irrelevant ICT risks. For instance, in the case that the bank executes and manages all their ICT in-house, ICT outsourcing risk becomes obsolete.

C-2018-3-Beugelaar-03-klein

Figure 3. Scoping of Assessment. [Click on the image for a larger image]

To tailor the results of the tool the user is requested to provide qualitative and quantitative information. This information forms input for qualitative rating of the risk exposure for each ICT risk type defined by the EBA and for benchmarking purposes.

C-2018-3-Beugelaar-04-klein

Figure 4. Entity Identification. [Click on the image for a larger image]

Each assessment of the risks consists of questions on sub-topics ranging from “Policies and Procedures” to “Preventive measures”. The questions are either multiple choice (as many answers as necessary may be selected), single choice (only one can be selected) and dichotomous being yes or no.

C-2018-3-Beugelaar-05-klein

Figure 5. Example questions on ICT Availability and Continuity Risk. [Click on the image for a larger image]

When the assessment is completed, three reports are generated being: 1) ICT Score Heat Map, 2) Operational Risk Homologation, and 3) Urgency Reports.

ICT Score Heat Map

The ICT Score Heat Map provides the average score of the questions per section combined with the criticality level of the ICT risks. Based on Figure 6, “Controls for managing material ICT Data Integrity risks” has an average score of 3,5, and ICT Data Integrity risk is highly critical.

In this way, a high score in the “Low” row has less impact in the general ICT Risk of the institution than a high score in the “High” row due to its low criticality.

The last row displays the average of all of the questions of each section, giving the user the ability to see a general score for every section defined in the EBA ICT Risk Guidelines, along with the weighted average of the scores and arithmetic average score obtained in each section of the questionnaire. See Figure 6.

C-2018-3-Beugelaar-06-klein

Figure 6. ICT Score Heat Map. [Click on the image for a larger image]

Operational Risk Homologation

This report displays every question and allows the user to link each question and score to the relevant operational risk loss event or strategy area, enabling the user to view the vulnerability of each area of operational risk and possible impact in the context of ICT Risk in a potential cause and effect structure. Furthermore, it increases the link between the assessment with the SREP and the configuration set up in the guidelines by the EBA (see Figures 7 and 8).

C-2018-3-Beugelaar-07-klein

Figure 7. Operational Risk Homologation Report Business Model & Governance. [Click on the image for a larger image]

C-2018-3-Beugelaar-08-klein

Figure 8. Operational Risk Homologation Report Operational Risk Loss Events. [Click on the image for a larger image]

The Operational Risk Homologation is divided in two parts:

  1. Business Model & Governance. This pertains to the assessment sections regarding the ICT Strategy and Governance, ICT Risk profile and Controls to Mitigate ICT risks. Results in these sections may impact the Business Model and Internal Governance and Control and require follow-up.
  2. Operational Risk Loss Events. This links the different types of ICT risks to a number of operational risk loss events. The tool has the following operational risk loss events in scope: Internal Fraud, External Fraud, Workplace Safety, Clients, Products & Business Practices, Damage to Physical Assets, Business Disruption and System Failures and Execution, Delivery & Process Management.

For instance, the tool links the lack of business continuity plans and continuity planning to operational risk loss events related to “Business Disruption and System Failures”.

Urgency Reports

The Urgency Report displays only those questions in which the user has obtained a “bad score”, which by default is 3. This report enables the user to highlight the most critical issues. The “bad score” can be changed per the user’s wishes and risk appetite.

This screen displays every question that exceeds the set threshold and provides the extract of the regulation on which the question is based. This way the user can identify the exact guidance and improve current issues in order to reduce the exposure or improve internal controls.

Conclusion

The EBA ICT Risk Assessment Guidelines form a new set of guidelines that banks are required to comply with as of this year. These guidelines require banks to think about how they will approach these and make the implementation tangible and demonstrable to the ECB. However, the content of these guidelines is not very new or unknown to the banks. Due to the nature of these guidelines, previous regulations to some extent cover or touch upon the content of the EBA ICT Risk Guidelines, enabling banks to focus on the areas that require major efforts for compliance and achieve quick compliance on recurring topics. Advanced IT tooling developed by KPMG can assist banks by creating insight into their level of compliance with the EBA ICT Risk Guidelines. This is done by filling in a questionnaire for each ICT risk area in scope. This exercise results in a risk heat map and homologation report, pointing out the ICT risk areas of attention and linking these to possible operational risk loss event categories that could be impacted in case of a negative score.

References

[AD17] AD, Financiële instellingen steeds vaker gehackt, Algemeen Dagblad, https://www.ad.nl/economie/financieneuml-le-instellingen-steeds-vaker-gehackt~a180d6a7, November 23, 2017.

[BCBS13] Basel Committee of Banking Supervision, Principles for effective risk data aggegration and risk reporting, Basel Committee of Banking Supervision, 2013.

[CEBS06] Committee of European Banking Supervisors, Guidelines on Outsourcing, Committee of European Banking Supervisors, 2006.

[CIO15] CIO, Big banks, big applications, big outsourcing, CIO from IDG, https://www.cio.com/article/3096125/outsourcing/big-banks-big-applications-big-outsourcing.html, July 1, 2015.

[CoWe14] ComputerWeekly, Why IT outsourcing is increasingly blamed for IT failures at banks, ComputerWeekly.com, https://www.computerweekly.com/news/2240214081/Why-IT-outsourcing-is-increasingly-fingered-for-IT-failures-at-banks, February 11, 2014.

[DNB14a] DNB, Cloud computing, De Nederlandsche Bank, http://www.toezicht.dnb.nl/2/5/50-230433.jsp, May 15, 2014.

[DNB14b] DNB, Governance: Uitbesteding, De Nederlandsche Bank, http://www.toezicht.dnb.nl/2/5/50-230431.jsp, May 15, 2014.

[DNB17] DNB, Assessment Framework for DNB Information Security Examination 2017, De Nederlandsche Bank, http://www.toezicht.dnb.nl/en/3/51-203304.jsp, April 21, 2017.

[EBA17-1] European Banking Authority, Guidelines on ICT Risk Assessment under the Supervisory Review, European Banking Authority, 2017.

[EBA17-2] European Banking Authority, Guidelines on the security measures for operational and security risks of payment services under Directive (EU) 2015/2366 (PSD2), European Banking Authority, 2017.

[EBA17-3] European Banking Authority, Recommendations on outsourcing to cloud service providers, European Banking Authority, 2017.

[ECB16] European Central Bank, Regulation (EU) 2016/867 of the European Central Bank of 18 May 2016 on the collection of granular credit and credit risk data (ECB/2016/13), Official Journal of the European Union, 2016.

[EUPA16] European Parliament, Regulation (EU) 2016/679 of the European Parliament and of the Council of 27 April 2016 on the protection of natural persons with regard to the processing of personal data and on the free movement of such data, and repealing Directive 95/46/EC (GDPR), Official Journal of the European Union, 2016.

[ITGI07] The IT Governance Institute, Cobit 4.1 Framework, Control Objectives, Management Guidelines and Maturity Models. Rolling Meadows, 2007.

[WSJ17] WSJ, Regulators See Cybersecurity as Top Financial Industry Risk, The Wall Street Journal, https://www.wsj.com/articles/regulators-see-cybersecurity-as-top-financial-industry-risk-1513288542, December 14, 2017.

Data driven challenges of the General Data Protection Regulation

On 25 May 2018 the GDPR will be in full effect within the European Union. Organizations are struggling to implement all the GDPR requirements in a timely manner and are finding themselves in a swamp of technical and data-driven challenges that come along with the GDPR. Organizations are for example required to document where all their personal data is stored, what it is processed for and who it is being transferred to. The level of detail that is required is very hard to produce in a short timeframe and without the proper tools nearly impossible. Indica, in collaboration with KPMG, has developed a tool that can help organizations overcome a large part of the technical challenges that they are faced with when addressing these technical and data-driven GDPR requirements.

Introduction

In 1995 we were living quite differently. We ordered our products from big paper catalogues, television commercials or through the telephone. We arranged our bank transactions by actually going to a bank. We went to the post office to send a letter or a postcard. To sell our own personnel things, we used the bulletin board at the local grocery store. Life in 1995 was quite different than life as we know it in 2018. Why outline 1995 you might think? In 1995 the European Directive 95/46 was ratified by the European Commission and laid the foundation for data protection within the European Union. To date this is still the foundation of many locally implemented privacy laws within the European Union. This piece of legislation was drafted and ratified in a time period where Facebook and Google did not yet exist and less than one percent of the world population had access to the internet, which only contained very basic information.

During the last twenty years a lot has changed in the way we communicate and in how we do business. The internet, mobile telephony and computers have developed substantially over the past two decades, providing us more and more possibilities in every way imaginable. These aforementioned developments have also had a huge impact on the amount of data that it is now being processed. This data also includes a lot of personal information that has been captured during those two decades. And the further we have integrated our life with the digital highway, the more personal data has become available for (commercial) organizations. The legislation that was drafted in 1995 did not foresee such a rapid change in our society and therefore a change was obviously required in order to protect European citizens. This updated piece of legislation has now arrived and is known as the General Data Protection Regulation.

GDPR at a Glance

On 16 April 2016 the European Commission ratified the long awaited General Data Protection Regulation. The regulation was ratified after four years of designing, discussing and negotiating its contents and applies to all organizations that are processing personal information. The new legislation came into effect as of 16 April 2016, but will be enforced from 25 May 2018. The legislation will cause quite some changes with regard to the current privacy legislation that was implemented based on the 1995 directive.

The main changes involve two general aspects: firstly, create more accountability for the organizations that are processing personal information and secondly, put more control in the hands of the data subjects – the individuals of whom the data is being processed.

C-2018-2-Idema-01-klein

Figure 1. Timeline regarding data privacy regulations. [Click on the image for a larger image]

Accountability

The European Commission wants organizations to be able to demonstrate their level of compliance with privacy regulations. This means that organizations must be able to show that they have control over their processing of personal data. A few examples in the regulation are the data processing inventory, executing privacy impact assessments and appointing a formal data privacy officer. The regulation will also force organizations to have legal contracts with their third-party data processors. Organization must implement these processes and activities before 25 May 2018.

Data Subject Rights

Along with the accountability, the European Commission wanted to give data subjects more control over their personal data. This can be achieved by providing them with more tools and rights that they can execute against organizations that process their personal information. The 1995 directive already had a few of these rights embedded in the legal structure, such as the right to access and the right to correct personal information. The GDPR adds a few additional rights for the data subject, such as the right to erasure, in case the subject wants all his personal data removed and the right to data portability, to name but two.

Most new legislative requirements are administrative activities or process-related activities that organizations need to implement before 25 May 2018. Implementing such processes and activities may be a time-consuming process, but they are not necessarily complicated or of a sophisticated nature and therefore not difficult to implement within the organization. There are however also a few requirements in the new legislation, especially for larger organizations, that require a complicated data driven exercise to become fully compliant with. These requirements include for example the data processing inventory (art. 30 GDPR), and being able to comply with data-subject rights (art. 15 till 19 GDPR). Both of these challenges have one thing in common, which is that they both require a deep understanding of and control over the (personal) data within the systems and applications in the organization, let alone unstructured data files.

GDPR Challenges from a data perspective

Data privacy is about being in control of your personal data processing activities. If you do not have insight into which personal data is being processed within the organization, where this processing is taking place, where the data is stored and for what reason this data is being processed, then it will be hard for a company to demonstrate that it is in control of its personal data processing. Without such insight, it will also be quite a challenge to assess privacy risks within the organization and to control them accordingly.

Article 30 of the GDPR states:

  1. Each controller and, where applicable, the controller’s representative, shall maintain a record of processing activities under its responsibility. That record shall contain all of the following information:
    1. Name and Contact Details of the Controller;
    2. Purpose of data processing;
    3. Categories of Data Subjects and Categories of Personal Data;
    4. Categories of recipients to whom personal data will be disclosed;
    5. Data transfers to third countries or international organization;
    6. (Optional) – Data retention schemes for the erasure of the data;
    7. (Optional) – A general description of taken measures and safeguards with regards to the data protection.

To answer the above challenge, the European Commission has implemented article 30 in the GDPR. Article 30 obliges organizations to implement a processing inventory for personal data.

Building such an inventory from scratch will be quite a challenge for organizations that have never initiated such a process in the first place. The data processing inventory applies to both structured and unstructured data sources that are being used in the business processes. Detailed information about data processing may be readily available at hand for some key systems or applications within the organization, but this may not be the case for smaller applications or less frequently used systems, let alone for unstructured data sources on file servers or in e-mail attachments.

Structured data sources

Structures data sources such as the HRM, Finance, and CRM systems are the main key information systems containing personal data that will have to be documented in the data processing inventory. The challenge however is to get a complete overview of all applications and systems within the organization that process personal information. Then the associated processes that use this data will have to be identified to determine the purpose of processing and if any third parties are involved in this process. Gathering this information can be quite an extensive task if this has never been performed before. Things will become even more challenging if the various information systems interface with each other and transfer or duplicate data. These flows also have to be documented in the data inventory.

Unstructured data

Creating an inventory from structured data seems to be quite a challenge, but once all data fields and attributes are identified, the full dataset should be covered. For unstructured data this is not quite the case, since the data is obviously not structured in a database or table format. Personal data could be scattered all over the document and also in open text data fields.

Unstructured data are documents such as PDFs, Excel files, lists of names, etc. These files can be stored on a file server, can reside in e-mail attachments or are attachments in CRM systems or other systems HRM. Open text fields in a database can also constitute unstructured data. Some of this data is automatically ‘searchable’, some data, such as PDF documents are sometimes not. This makes it more complicated to determine if any personal information is involved or not.

Data Subject Rights

One of the two key pillars of the GDPR, given the continuous growth in processing of personal data, is to protect EU citizens against the further processing of their personal information and that their personal data is handled with due care. To enforce such a due care treatment, the EU wants to give the data subjects more tools or legal grounds to gain more control over their personal data. This control has been given a place in the GDPR under articles 15 to 19, where the data-subject rights have been documented. There are several different rights that a data subject can exercise, which have been summarized in the text box.

The right to access and the right to erasure might become quite a challenge for organizations who process personal data in a lot of different systems. A data inventory may help in identifying which systems are actually relevant with respect to extracting or removing data, but identifying the exact records of the data subject who is making the request is another story. It is also challenging to demonstrate that a complete set of records of this data subject have been given access to or have been removed within the organization.

Overview of data subject rights

  • right to access: the data subject has the right to gain insight into what data is being processed by the personal data controller;
  • right to rectification: the data subject has the right to correct his personal data in case there is an error;
  • right to erasure: the data subject has the right to have all his personal data removed;
  • right of data portability: the data subject has the right to transport his data to another service provider;
  • right to restriction of processing: the data subject can demand restrictions on the processing of his personal data;
  • right to object: the data subject has the right to subject against automated processing of personal data.

Another problematic issue is that the GDPR also obliges an organization to respond to the request in a timely manner without delay. In practice this means that the request should be handled within approximately four weeks. When an organization only gets a handful of such requests during a year it might still be very possible to answer these in a timely manner, but probably very inefficiently. But in some sectors where a lot of consumer data is being processed for marketing related activities, it may become a trend that more and more data subjects will execute their right of erasure or access to their data within your organization. When the requests pile up, it will become quite a challenge to adhere to the timelines specified by the GDPR. This will then certainly become a big risk, since not adhering to subject-access rights will be a violation of GDPR compliance that will fall in category 2 of the sanctions provisions of the GDPR.

Indica GDPR – a tool for data driven GDPR Challenges

As identified in the previous paragraph, organizations will face two key data driven challenges when implementing the GDPR: subject access rights and data inventory requirements. Life would be a lot easier if there would be continuous insight into all data that is being stored within the organization. It would be even better if this stored data would be easily searchable so that relevant documents can be found with little to no effort.

Indica eSearch

Indica eSearch is an enterprise search tool that enables organizations to index their data, documents and other digital files and enables them to search through the data pile effectively and efficiently. This search engine and tool that has been built to answer the demand for business search applications formed the basis for developing the Indica GDPR module.

Indica eSearch is an agentless tool that can be installed in one day. Indica runs either in the cloud or on a standalone virtual machine in the IT infrastructure. Indica gets read-only access to the data by giving it access as a user on the database, active directory or file server directly. The Indica account will then read the data it has access to and create an index of the identified data. This includes standard databases as part of ERP systems, CRM systems or other applications that run on a database layer. Indica can also index office files such as Word, Access, Excel, etc. PDF files can also be read and if required they can be OCRed to make them ‘readable’. After the files have been indexed, the Indica search algorithm enables users to find their documents by using a key-word search.

The Indica eSearch forms the foundation for the GDPR Module. The GDPR Module uses the Indica indexing technology and search algorithm to identify Personal Identifiable Information (PII). By using logical expressions, artificial intelligence and intelligent search strings, the Indica GDPR module is capable of identifying numerous PII data attributes in the indexed data.

About Indica and the partnership with KPMG

Indica was founded in 2013 by a small group of IT professionals who were looking for an answer to customer needs with regard to the exponentially growing data volumes and the challenges that come along with it. They decided to develop a tool to address these challenges and built a unique correlation algorithm which allows organizations to manage and index their data sources and enables them to locate their knowledge and information swiftly. This patented technology became the core of the future product which was highly appreciated on the market. Indica soon grew into a team of professionals with great competence in the areas of IT, data science, law, risk and compliance, and economics.

In 2014 KPMG Netherlands recognized the potential of Indica as an eDiscovery and Compliance tool, Indica and KPMG Netherlands established a sales and technological partnership and started jointly to develop eDiscovery and Risk & Compliance solutions. KPMG and Indica developed the Indica GDPR module as part of this partnership.

Indica for Data Subject Access Rights

When enterprise data is searchable and PII attributes can be identified, a tool such as Indica is going to greatly assist organizations in dealing with data subject requests from individuals. The subject access rights that have been discussed previously and are deemed to have a strong data-driven component are the right to access and the right to be forgotten (as outlined in the text box).

Simply typing in the name of the individual that is requesting information or is requesting deletion of his information is enough to provide the request handler with all the data that is stored about that individual within the organization. All documents, records and e-mails related to that individual will be shown in the Indica interface, because Indica will link the identified person to all the other records that belong to that person. The handler can extract the document and record overview and share them with the system owners and/or privacy officer to start gathering the information or start deleting the information.

Indica for Data Inventory

The article 30 requirement for a data inventory is another data-driven challenge that comes from the GDPR. Indica is capable of identifying PII data in the indexed data sources of an organization. Indica also categorizes this data in the related PII attribute, such as name, telephone number, bank account number, social security number, credit number, and so on. With this algorithm, Indica will tell you for each information system that is connected to Indica, what personal information is stored, how much data is stored and who has access to this data. This information provides the data privacy officer with the basis for an art. 30 data inventory. Indica will provide the DPO with which PII data is being processed for each information system and can document the findings in the data inventory. The next step is to have a business owner of the information system verify the information and make sure the inventory is accurate and complete. Indica will not create the inventory autonomously, but will provide the person responsible for the register with the information that he requires to set up such a register.

Apart from data processing activities that are captured in information systems, it is also possible that data processing activities are stored in unstructured documents, such as PDF files, Excel lists or other unstructured data formats. These data types pose a greater risk and challenge for the DPO, because there is usually a far lower level of control on these types of files. Indica can index fileservers or Sharepoint sites to identify PII data from these sources and can help the DPO to determine whether or not these identified documents should be reported in the data inventory, because they are an integral part of a process, or that these documents need to be removed from the file source.

Indica as a DPO Risk Management Tool / Monitoring Tool

Apart from providing an indexing mechanism, a search algorithm and a PII identification algorithm, the GDPR Module of Indica also has an advanced dashboard and workflow management system. These additional tools enable a data privacy officer to monitor the compliance of company data with GDPR requirements, to mitigate new potential data risks and to identify and reject false positives. In the example case below we will illustrate the added value of the Indica dashboard and workflow system. See Figure 2 for an overview of the Indica Dashboard.

C-2018-2-Idema-02-klein

Figure 2. One of the Indica GDPR dashboards that will help privacy officers to mitigate privacy risks regarding unstructured data. [Click on the image for a larger image]

Below I will describe a real-life case where Indica has proven it’s added value with regards to the detection of GDPR risks for a company in the financial sector.

Indica real-life case

A medium sized organization, operating in the financial sector requested a proof of concept for Indica to identify potential risks in their unstructured data sources with regard to GDPR. Indica, together with KPMG set up an environment with the client to connect the data sources to the Indica GDPR platform. Indica indexed the data sources and identified personal information by using both pre-programmed PII tokens as well as industry specific keywords that were defined by KPMG.

In total approximately 100 gigabytes of data was indexed with Indica, containing approximately 400,000 files / data records. Of these 400,000 records of data, about 50% contained some personal information. Along with names and telephone numbers, more sensitive data was also discovered, such as medical records, passport data and even information about sexual preferences.

Of the approximately 200,000 files with PII, only 1200 records required further validations. After validation by a KPMG privacy professional, a total of 1090 files were deemed to be non-compliant with GDPR regulations, because no legal grounds for processing this information was present. The client has been advised on how to mitigate these findings most effectively by KPMG privacy professionals.

The client is currently working on better work instructions and the awareness of their employees with regards to privacy compliance.

Concluding Remarks

The GDPR exposes organizations to several new risks and challenges with regard to the management of their (personal) data, obviously with good reason. The volume of data keeps growing year after year and this creates more layers of complexity because organizations also want to do more with this data. A regulation such as the GDPR will now force organizations to gain more control over the processing of this data. Without any automated means it will be quite impossible to manage all these data flows, structures and archives. Indica provides such automated means for organizations that are having difficulty in achieving a good level of control over their (personal) data. Going forward such tooling will be a prerequisite in order to be able to demonstrate to the authorities that you are in fact in control of your data, and that you are fully aware of what data is being processed for what purpose. GDPR compliance will no longer be a case of ‘tell me’, but more a case of ‘show me’. A tool as Indica will enable you to show control and compliance of your data with regard to GDPR. Of course, Indica will not provide a solution for all your GDPR challenges, but will surely enable you to tackle most of the practical implications with regard to personal information and the compliance thereof.

eDiscovery-spierballentest

Door de wildgroei van digitale gegevens binnen organisaties vormen eDiscovery applicaties een essentieel onderdeel voor het doen van waarheidsvinding. Uit onze ervaring zien wij dat gebruikers van eDiscovery applicaties ervan uitgaan dat iedere applicatie doorgaans een vergelijkbare werking en resultaten levert, maar is dat wel zo? Er bestaat voor deze applicaties en de achterliggende programmatuur namelijk geen (ISO-)certificering. Om die reden hebben wij voor dit artikel op de Nederlandse markt beschikbare eDiscovery applicaties naast elkaar gezet in een ‘spierballentest’. Tot verbazing van velen zien wij als uitkomst van dit onderzoek dat deze applicaties vrijwel op alle aspecten van elkaar verschillen.

Introductie

In onze dagelijkse werkzaamheden maken wij als forensisch onderzoekers veelvuldig gebruik van eDiscovery-tooling. In een wereld waarin datavolumes exponentieel blijven groeien, is waarheidsvinding binnen omvangrijke datasets zonder de inzet van adequate eDiscovery-tooling simpelweg niet meer efficiënt uitvoerbaar. ‘eDiscovery’ wordt in de praktijk vaak geassocieerd met een zoekmachine waarbij elektronisch opgeslagen informatie wordt klaargezet om op basis van voorgeprogrammeerde algoritmes doorzoekbaar te maken. Met ‘tooling’ doelen wij op de verschillende eDiscovery-applicaties die op de markt worden aangeboden door verschillende aanbieders. Inmiddels zijn er tientallen eDiscovery-aanbieders op de markt actief, waarbij de kwaliteit, data-integriteit en functionaliteit van de verschillende elektronische zoekmachines onderling sterk verschillen. Het is niet ongebruikelijk dat eDiscovery-onderzoeken mislopen, simpelweg omdat onderzoekers ongeschikte zoekmachines gebruiken en/of de technische implicaties van de gebruikte zoekmachine onvoldoende doorgronden. Met alle onderzoekstechnische en juridische consequenties van dien.

Wij kiezen in de uitvoering van onze werkzaamheden niet voor één specifieke eDiscovery-applicatie, maar laten de besluitvorming rondom de in te zetten applicatie afhangen van een aantal factoren, waaronder de uiteindelijke informatiebehoefte van onze opdrachtgevers. Het onderlinge verschil tussen de tientallen eDiscovery-applicaties is namelijk GIGAgroot. Wij vonden het dan ook de hoogste tijd om als eDiscovery-ervaringsdeskundigen het ‘kaf van het koren’ te scheiden met een spreekwoordelijke ‘elektronische spierballentest’.

Dit artikel verstrekt, naast een mooie inkijk in de uitdagingen voor besluitvormers en gebruikers van eDiscovery-toepassingen (met behulp van ‘echte’ uitkomsten, van vier verschillende eDiscovery-applicaties op precies dezelfde datasets), natuurlijk ook praktische aspecten die relevant zijn om in ogenschouw te nemen bij de selectie van de eDiscovery-applicatie. Alvorens in te gaan op de uitkomsten van onze spierballentest een korte introductie van wat het eDiscovery-proces nu eigenlijk is aan de hand van het Electronic Discovery Reference Model (hierna: EDRM Model). Met behulp van dit model zullen wij de Babylonische spraakverwarring tussen de verschillende mogelijkheden van de eDiscovery-applicaties inzichtelijk proberen te maken.

eDiscovery-proces

Het EDRM Model fungeert als de marktstandaard en biedt een conceptuele weergave van de eDiscovery-processtappen die doorlopen (behoren) te worden, afhankelijk van de context en doelstelling waarbinnen de waarheidsvinding plaatsvindt. Met andere woorden, niet voor alle vormen van waarheidsvinding is het doorlopen van alle stappen binnen het EDRM Model vereist.

C-2018-2-Eijken-01-klein

Figuur 1. Visuele weergave van het EDRM Model ([EDRM18]). [Klik op de afbeelding voor een grotere afbeelding]

De processtappen binnen het EDRM Model behelzen niet alleen technische functionaliteiten, maar omvatten ook menselijke handelingen. Dit model start bij de identificatie van de beschikbare data bij het onderzoeksobject, hetgeen altijd een menselijke handeling betreft, direct gevolgd door een aantal technische processtappen. De diverse eDiscovery-applicaties starten binnen het EDRM Model feitelijk op verschillende processtappen. De ene applicatie biedt naast ‘processing’- en ‘review’-mogelijkheden ook ‘collectie’-mogelijkheden, terwijl een andere applicatie alleen maar ‘review’-mogelijkheden biedt. Om deze reden zijn de verschillende eDiscovery-applicaties ook niet zonder meer vergelijkbaar. Afhankelijk van de onderzoeksvraag is niet elke applicatie geschikt en mogelijk is een combinatie van applicaties vereist. Geen enkele eDiscovery-applicatie op de markt heeft op dit moment alle technische stappen binnen het EDRM Model inbegrepen.

Voor onze spierballentest hebben wij eDiscovery-applicaties geselecteerd die de technische processtappen ná ‘collectie’ en ‘preservatie’ van de data ondervangen.

Selectie eDiscovery-tooling

Wij zien dat het aantal verschillende eDiscovery-applicaties de afgelopen jaren enorm is toegenomen. Het actuele aantal eDiscovery-applicaties is volgens een vergelijkingssite 1 op dit moment 78 (en dit aantal neemt toe). Belangrijk is om te vermelden dat deze producten niet allemaal de vereiste functionaliteit of eigenschappen hebben om een eDiscovery-applicatie adequaat bij een forensisch onderzoek in te kunnen zetten. Van deze 78 applicaties zijn er 40 die alle functionaliteiten bieden voor de EDRM-fases ná collectie. Hiervan worden er slechts 20 ook buiten de VS aangeboden. Op basis van deze beschikbare eDiscovery-aanbieders hebben wij, mede ingegeven door onze praktijkervaring, een representatieve selectie gemaakt van vier eDiscovery-toepassingen ter vergelijking. De betrokken eDiscovery-applicaties zijn voor dit artikel geanonimiseerd.

  1. marktleider A: een applicatie die bekendstaat als allrounder en al langere tijd meegaat;
  2. marktleider B: een applicatie die bekendstaat om zijn goede analyse- en reviewmogelijkheden;
  3. marktleider C: een applicatie die bekendstaat om zijn processingkracht en een breed spectrum aan bestandstypen accepteert;
  4. startup: een nieuwkomer in de markt die op papier vergelijkbare dienstverlening biedt als de marktleiders.

Selectie datasets

In de praktijk te onderzoeken datasets bevatten een diversiteit aan bestandstypen en -grootten. Voor onze spierballentest hebben wij drie verschillende datasets samengesteld die deze diversiteit op een goede wijze weerspiegelen. Aangezien het belangrijk is om reproduceerbare resultaten te publiceren, is gebruikgemaakt van publiekelijk beschikbare datasets. Deze datasets zijn alle afkomstig van de EDRM-website [EDRM18], een community van eDiscovery-en juridische professionals, die praktische middelen creëren om eDiscovery en informatiebeheer te verbeteren. Hieronder zijn de gebruikte datasets kort toegelicht.

Dataset 1: EDRM Enron e-mail

De eerste dataset bestaat uit 190 PST-bestanden (mailboxen) en heeft een totale omvang van 53,0 gigabyte. Dit is de Enron e-maildataset, bekend van het boekhoudschandaal, die al jaren als industriestandaard wordt gezien om te gebruiken voor eDiscovery-training en -testen. De Enron dataset is geselecteerd omdat deze relatief groot in omvang is en over een grote diversiteit aan e-maildocumenten en bijlagen beschikt.

Dataset 2: EDRM forensische kopie

De tweede dataset betreft een ‘evidence’-bestand, namelijk het gestandaardiseerde .E01-formaat. Een dergelijk formaat wordt doorgaans gebruikt bij het maken van een forensische kopie van bijvoorbeeld een harde schijf. De totale omvang van het bestand is 3,0 gigabyte. Forensische kopieën zijn een belangrijk startpunt in het kader van waarheidsvinding en daarom is dit type dataset meegenomen in dit onderzoek. In vergelijking met dataset 1 bevat deze dataset veel meer verschillende bestandstypen, zoals deze in een kopie van een computer aangetroffen kunnen worden.

Dataset 3: EDRM bestandsdiversiteit-set

Deze laatste dataset betreft een collectie van 4036 bestandsformaten die mogelijk binnen een organisatie aangetroffen kunnen worden en bruikbare informatie kunnen bevatten ten behoeve van waarheidsvinding. Deze dataset omvat een grote diversiteit aan bestandstypen waarvan wij ons afvroegen in welke mate deze, in de door ons onderzochte eDiscovery-toolings, ondersteund zouden worden. Deze dataset is een samenvoeging van drie datasets (File Format Data Set, Internationalization Data Set en de Public Micro Data Set) op de EDRM-website [EDRM18].

Bovengenoemde datasets zijn op dezelfde wijze in de vier door ons betrokken eDiscovery-applicaties ingeladen. Dit vertrekpunt staat als basis voor het uitvoeren van de tests die in het volgende hoofdstuk op hoofdlijnen beschreven staan.

eDiscovery-spierballentests

De eDiscovery-applicaties zijn door ons op 47 aspecten met elkaar vergeleken, die in de ondergenoemde categorieën ingedeeld kunnen worden.

  • Preliminair – Overwegingen op basis van de doelstelling van de gebruiker en het beschikbare budget. Het gaat hierbij om elementen zoals prijs, toegangsmogelijkheden en de ondersteuning van besturingssystemen.
  • Algemeen – Beschikbare technische en functionele kenmerken van de applicatie, zoals de tijd die nodig is om de toepassing te installeren of de schaalbaarheid van de applicatie voor grotere datasets.
  • Verwerking van data – Mogelijkheden en prestaties op het gebied van het verwerken van de data, zoals het uitvoeren van ‘Optical Character Recognition’, de-duplicatie van bestanden en snelheid.
  • Review – Veelzijdigheid en robuustheid van de applicatie met betrekking tot het zoeken en reviewen tijdens een digitaal onderzoek, zoals zoekfunctionaliteiten, aanpasbaarheid van de reviewomgeving en gebruiksgemak.
  • Productie – Geschiktheid van de applicatie om documenten te produceren als resultaat van het onderzoek, waaronder de diversiteit van exportformaten en redactiemogelijkheden.
  • Projectmanagement – De functionaliteiten op het gebied van projectmanagement door middel van het genereren van rapportages om voortgang en kwaliteit te kunnen bewaken en granulariteit van toegangsbeperking.

In figuur 2 zijn van de 47 onderzochte aspecten de veertien meest relevante aspecten weergegeven, verdeeld over de zes hiervoor beschreven categorieën.

C-2018-2-Eijken-02-klein

Figuur 2. Informatieve illustratie van de uitkomsten van de eDiscovery-spierballentest ([KPMG18]). [Klik op de afbeelding voor een grotere afbeelding]

Deze informatieve illustratie geeft onze uitkomsten in een vierpuntsschaal weer, waarbij één pictogram, relatief gezien, de laagste uitkomst representeert en vier pictogrammen de hoogst mogelijke uitkomst voorstelt. De afbeelding C-2018-2-Eijken-03-klein

geeft aan dat de betreffende functionaliteit nog in ontwikkeling is.

Onderzoeksresultaten in vogelvlucht

Preliminair

Om te beginnen is het kostenplaatje dat aan de verschillende eDiscovery-toepassingen hangt uiteenlopend. Dit is niet eenduidig in dit artikel uiteen te zetten, omdat de afrekenmethodiek per eDiscovery-applicatie afhankelijk is van de afspraken die gemaakt zijn per afnemer. Doorgaans zijn de kosten voor de applicaties van de marktleiders aanzienlijk hoger dan voor de applicatie van de startup. Tussen de verschillende marktleiders zijn kostentechnisch eveneens verschillen zichtbaar. Alle vier de applicaties kunnen op de technische infrastructuur van de gebruiker worden gehost. De gebruiker is dan verantwoordelijk voor de hosting en het uitvoeren van updates. Voor twee van de vier eDiscovery-applicaties biedt de leverancier eveneens de mogelijkheid om de applicatie voor de gebruiker in de cloud te hosten.

Algemeen

Ten aanzien van de setup-tijd die benodigd is per applicatie zijn grote verschillen waarneembaar. Waar je met de startup-applicatie binnen 48 uur al aan de slag kunt met indexeren en reviewen van de digitale documenten, duurt de setup-tijd van de verschillende marktleiders minstens één à twee weken. Deze setup-tijd wordt grotendeels bepaald door de infrastructuur die hiervoor benodigd is. Daarnaast wordt de setup-tijd ook beïnvloed door de mate van expertise die benodigd is. Indien snelheid geboden is, kan de keuze van applicatie in aanvangstijd een groot verschil maken.

De gebruiksvriendelijkheid, die door ons is ingeschat op basis van eigen waarneming, laat eveneens grote verschillen zien. Waar marktleider B en de startup grotendeels intuïtief zijn ingeregeld voor de reviewer, is de benodigde technische kennis voor het gebruik van de eDiscovery-applicatie C aanzienlijk hoger. Dit komt onder andere tot uiting in de hoeveelheid opties die de reviewer wordt aangeboden in het reviewscherm, het aantal benodigde ‘clicks’ om een document te reviewen en de eenvoud van het zoeken en vinden van documenten.

Verwerking van data

Als wij vervolgens kijken naar de processingcapaciteit, die feitelijk als de ‘core-functionaliteit’ van een eDiscovery-applicatie beschouwd zou kunnen worden, dan zijn de verschillen niet anders dan (zeer) groot te noemen. Dit komt tot uiting in het aantal documenten dat verwerkt wordt door de verschillende oplossingen met betrekking tot de drie verschillende datasets en daarmee directe impact heeft op de documenten die door de onderzoeker doorzocht kunnen worden. Marktleider C haalt op alle fronten – in termen van processing – de beste resultaten, omdat deze applicatie het grootste aantal bestanden kan detecteren. Deze uitkomsten zijn vervolgens door ons als norm gebruikt om de processingcapaciteit van de andere applicaties te kunnen vaststellen. De 99% representeert derhalve de beste benadering van het aantal te detecteren bestanden op basis van de vier door ons betrokken applicaties. Daarbij is het van belang om te realiseren dat alles wat niet gedetecteerd wordt bij het processen van de data, feitelijk niet verwerkt wordt en daarmee niet doorzoekbaar is of kan worden gemaakt.

Als wij vervolgens dieper naar de percentages kijken ten opzichte van de drie datasets, kunnen wij onderstaande observaties plaatsen:

  • Bij dataset 1 merken wij op dat met name marktleider A achterblijft bij het aantal .pst-bestanden dat verwerkt is in vergelijking met de andere applicaties.
  • Bij dataset 2 zien wij dat alle andere applicaties sterk achterblijven op marktleider C. Bij marktleider A constateren wij zelfs een 0%-score, wat verklaard kan worden door het feit dat het alomvattende ‘evidence’-bestand (.e01) niet ondersteund wordt. Hierdoor kunnen de bestanden binnen het ‘evidence’-bestand ook niet worden verwerkt.
  • Bij dataset 3 constateren wij dat met name de startup veel bestanden niet verwerkt en marktleider A tevens fors achterblijft op marktleiders B en C. Zoals eerder aangegeven, bevat deze dataset een grote diversiteit aan bestandsformaten die met de applicaties van de startup en markleider A niet geheel betrokken kunnen worden in het onderzoek.

Om te voorkomen dat onderzoekers meerdere malen naar hetzelfde document hoeven te kijken, voeren de eDiscovery-applicaties een de-duplicatie op de bestanden uit. Met de-duplicatie worden de dubbelingen uit de dataset verwijderd. De percentages representeren het gedeelte van dataset 1 waarvan de applicatie heeft vastgesteld dat deze duplicaten zijn. In deze resultaten zijn net als bij de processingcapaciteit verschillen tussen de applicaties zichtbaar, waarbij het de-duplicatiepercentage van marktleider C het hoogst is en dus de meeste duplicaten in de dataset voor de gebruiker elimineert voor review. Daarnaast is een goede afhandeling van mogelijke foutmeldingen tijdens de verwerking van de gegevens essentieel om te borgen dat er geen informatie ontbreekt. Marktleider B biedt de meest uitgebreide en gestroomlijnde workflow om deze foutmeldingen in te kunnen zien en op te kunnen volgen.

Review

De ‘review’-functionaliteit in eDiscovery-applicaties wordt gebruikt door onderzoekers om de bestanden te doorzoeken en de resultaten van deze zoekslagen te beoordelen op relevantie voor het doel van de waarheidsvinding. Om een vastlegging te kunnen maken van deze beoordeling wordt in de praktijk gebruikgemaakt van ‘tagging’. Daarnaast bieden eDiscovery-applicaties steeds vaker een ‘predictive coding’-functionaliteit, waarmee de applicatie op basis van machine-learningalgoritmen de relevantie van documenten voorspelt aan de hand van keuzes die de gebruiker eerder heeft gemaakt. Ons onderzoek wijst uit dat de eDiscovery-applicaties verschillende zoekresultaten opleveren bij het toepassen van dezelfde zoektermen. Dit is enerzijds gerelateerd aan het feit dat iedere applicatie een ander percentage van de dataset geïndexeerd heeft. Anderzijds merken wij tevens op dat de zoekalgoritmen bij de eDiscovery-tools een verschillende werking hebben op de datasets. Daarnaast ondervinden wij dat de ‘tagging’-functionaliteit onder de marktleiders relatief uitgebreider is dan de mogelijkheden die door de startup geboden worden. Tot slot bieden alleen de marktleiders op dit moment de ‘predictive coding’-functionaliteit, maar zijn de mogelijkheden voor toepassing hiervan uitgebreider bij marktleider B ten opzichte van marktleiders A en C.

Productie

Zodra een onderzoek naar waarheidsvinding is afgerond, dient er vaak een export gemaakt te worden van de resultaten. Daarbij is het voor juridische producties soms van belang om specifieke gegevens (zoals persoonsgegevens) te redigeren. Hiertoe wordt binnen eDiscovery gebruikgemaakt van de ‘redaction’-functionaliteit waarin je stukken tekst in documenten onleesbaar kan maken alvorens deze te exporteren.

Wij zien dat marktleider C de meest uitgebreide mogelijkheden biedt ten aanzien van het aantal formaten waarin de resultaten geëxporteerd kunnen worden. Daarnaast bieden alleen de marktleiders redaction-functionaliteit, die het meest uitgebreid is bij marktleider B.

Projectmanagement

Aangezien het uitvoeren van een onderzoek met behulp van een eDiscovery-applicatie veelomvattend kan zijn en er veelal met meerdere onderzoekers tegelijkertijd aan wordt gewerkt, is de projectmanagement-functionaliteit van belang om zicht te houden op de voortgang en kwaliteit van het onderzoek. Wij merken op dat marktleider A de meest uitgebreide monitoring dashboards en rapportages biedt voor het inzichtelijk maken van de voortgang van de review. Daarnaast biedt marktleider B de meest uitgebreide mogelijkheden om de rapportages in de applicatie naar eigen wens te kunnen aanpassen.

Resumerend

Het algemene beeld is dat er geen eDiscovery-applicatie hetzelfde is. De eDiscovery-toepassingen zijn niet alleen op het gebied van kosten, setup en architectuur verschillend, maar juist ook op het gebied van processen, de-dupliceren, indexeren en zoeken. Er bestaat voor deze applicaties en de achterliggende programmatuur geen (ISO-)certificering of algemene instantie die test of een eDiscovery-toepassing ‘werkt’.

Zo scoort marktleider B op de meeste onderzochte aspecten het best van de vier applicaties. Het gebruik van deze applicatie vereist echter een forse investering en opstarttijd, waardoor deze met name geschikt lijkt voor grote en complexe trajecten. Bij minder complexe trajecten kan men mogelijk uit de voeten met de applicatie van de startup, waarbij de investering en opstarttijd vele malen lager respectievelijk korter is, maar men zich bewust dient te zijn van de beperkingen en de gevolgen daarvan voor de waarheidsvinding.

Bij de keuze en het gebruik van een eDiscovery-applicatie is het daarom van belang om de in dit artikel opgenomen aspecten in het achterhoofd te houden om te voorkomen dat ‘in het land der blinden eenoog koning wordt’. Objectieve en onafhankelijke ondersteuning ten aanzien van de selectie en toepassing van een of meerdere eDiscovery-applicatie(s) is daarmee elementair voor het doen van gedegen elektronisch onderzoek.

Noten

  1. Op de website [CAPT18] staan op het moment van schrijven 78 applicaties.

Referenties

[CAPT18] CAPTERRA, eDiscovery Software, Capterra.com, https://www.capterra.com/electronic-discovery-software/, 2018.

[EDRM18] EDRM, EDRM Model, EDRM.net, https://www.edrm.net/frameworks-and-standards/edrm-model/, 2018.

[KPMG18] KPMG, KPMG eDiscovery Spierballentest 2018, KPMG, 2018.

Dynamic Risk Assessment

The traditional risk assessment models, which assess risks based on their individual impact or likelihood have been widely applied by many organizations. The existing models, however, fail to recognize the interconnections among the risks which may reveal enhanced assessment dimensions and more pertinent risk mitigating actions. In response to this, the Dynamic Risk Assessment (DRA) has been developed based on proven scientific modeling, expert elicitation, and advanced data analytics. DRA enables organizations to gain a deeper understanding into how risks impact the different parts of the firm and, subsequently, to design more effective and efficient risk mitigating measures.

Introduction

One of the main things learned in risk management since the new millennium is the previously unobserved levels of correlation. We have since learnt that volatility itself is volatile, an attribute for which most financial mathematical models make insufficient allowance. It re-introduced the question of whether structural breaks in the system exist and how to allow for their presence in modeling, impairment assessments and other financial valuation techniques.

The above developments pose ominous warnings for risk and financial managers alike as they infer that risk assessments and asset valuations can drift to levels that, in certain cases, grossly underestimate risks and can cause valuations to gyrate violently.

Unless business, academic institutions and regulators get better at managing these cycles and corrections, businesses will be subjected to ever increasing public scrutiny, more intrusive regulation and regulators, new-found antagonistic behavior from the public, reduced market capitalization and greater friction costs in doing business.

Whilst this plays to a populist agenda, it does little to improve economic growth, which we have now seen constitutes the tide that most lifts most personal wealth boats. Risk management has a crucial role to fulfill: not only within the business, but also for its immediate and wider stakeholders.

The Dynamic Risk Assessment Approach

In response KPMG has developed an innovative approach referred to as ‘Dynamic Risk Assessment’ (DRA). DRA is based on the science of expert elicitation, invented by the US military in the 1950s. At the time it faced the challenge of remaining ahead of Soviet military developments that were taking place behind an impenetrable iron curtain. The military, similar to risk managers today, faced a future that could not be credibly modeled by traditional means. They quickly learned that expert elicitation is a helpful alternative, to the point where it aided the US military not only to match covert Soviet developments, but to stay abreast throughout the Cold War and thereafter.

More specifically, the US military discovered that, by (1) identifying experts scientifically and (2) conducting scientifically structured individual and group interviews, a credible future threat/risk landscape could be generated. DRA capitalizes on these insights and extends them into a third and fourth dimension: the experts are requested to provide their individual perspectives on how the risks can be expected to trigger or exacerbate each other, and the velocity with which they can affect the organization. With these risk perspectives an organization-specific risk network can be constructed to obtain key insights into the organization’s systemic risk landscape.

These insights are presented back to the experts to obtain their views on the consequences and the opportunities available to the organization, whereupon it is circulated to Those Charged With Governance to enrich their risk mitigation decision-making.

C-2018-2-Bolt-01-klein

Figure 1. The four steps of Dynamic Risk Assessment. [Click on the image for a larger image]

Dynamic Risk Assessment explained

Clustering of risks

Traditional risk models assess the prioritization of risks on individual impact or likelihood. Although these assessments are useful, the traditional model (Figure 2) fails to recognize the interconnections between risks (Figure 3) or the effect of clustering risks. As illustrated in Figure 4, a seemingly low ‘risk of failure to attract talent’ could potentially form part of a high severity risk cluster, that of operational risks.

C-2018-2-Bolt-02-klein

Figure 2. Traditional depiction of risks (illustrative). [Click on the image for a larger image]

C-2018-2-Bolt-03-klein

Figure 3. Individual risks in a risk neural network, with clusters (illustrative). [Click on the image for a larger image]

C-2018-2-Bolt-04-klein

Figure 4. Aggregated likelihood and severity of a cluster of risks (illustrative). [Click on the image for a larger image]

Risk Influences

DRA also calculates influences between risks, i.e. to what extent will the occurrence of one risk trigger the occurrence of other risks, and vice versa. In this manner the three most influential risks can be identified (Figure 5). These are the risks that, when they occur, will trigger most of the other risks – across the network.

C-2018-2-Bolt-05-klein

Figure 5. The systemically most influential risks in the network (illustrative). [Click on the image for a larger image]

Similarly, the three most vulnerable risks can be identified (Figure 6). These risks are the risks most likely to occur following the occurrence of any other risks in the network.

C-2018-2-Bolt-06-klein

Figure 6. The systemically most vulnerable risks in the network (illustrative). [Click on the image for a larger image]

Knowing the contagion forces between risks is important in a) selecting the key risks to focus on, and b) selecting the appropriate controls (in type and strength) to mitigate them. For example, since the most influential risks can trigger other risks, mitigation of the organization’s systemic risks should commence with these risks. For the most vulnerable risks, preventive controls should be preferred over detective controls.

Figure 7 depicts a consolidated view of individual risks, risk clusters, most influential and most vulnerable risks. Based on this view, we can design risk mitigating activities and assign related governance responsibilities.

C-2018-2-Bolt-07-klein

Figure 7. Putting it together (illustrative). [Click on the image for a larger image]

Risk mitigation

Risk mitigation is aimed at addressing how a particular risk should be optimally responded to. Within DRA, mitigation is accomplished through the application of bow ties. The first step for risk mitigation therefore begins with determining the clusters and calculating their aggregate severities (Figure 4). This process is followed by the identification of the most influential and most vulnerable risks, and thereafter the black swans – risks that display weak links to other risks yet, in aggregate, have catastrophic outcomes. DRA’s mitigation phase identifies the most vulnerable risks as well as risks that could form part of a black swan chain, and assigns these to the CRO as these risks have the gravest systemic consequences.

In identifying the most influential risks, responsibility for monitoring is allocated to the CEO since these risks have the widest systemic reach. The CEO can then be challenged to invert them into competitive advantages. Risks that are individually insignificant and not connected to any significant outcomes are delegated to subordinates.

Data security, for instance, is classified in Figure 7 as a risk that carries a high severity individually, and forms an Operational Risk Cluster with significant aggregate outcomes together with profitability, conduct risk, and failure to attract talent. The risk mitigating measures for data security can subsequently be designed as shown in Figure 8. The diagram shows various related (external and internal) threats, key controls (preventive, detective, and recovery, with their current status of effectiveness) and the risk consequences. For each key control responsibilities can be allocated across the three lines of defense – ownership lies with the first line, supervisory roles with the second line, and evaluations on the third line. The frequency of reporting back to Those Charged With Governance is determined based on the criticality of control and significance of risk.

C-2018-2-Bolt-08-klein

Figure 8. Data security bow tie (illustrative). [Click on the image for a larger image]

Conclusion

Traditional models assess risks based on their individual impact or likelihood, but fail to recognize the interconnections among the risks. In response to this, KPMG designed the Dynamic Risk Assessment based on proven scientific modeling, expert elicitation and advanced data analytics. The Dynamic Risk Assessment enables users to gain a deeper understanding into how risks impact the different parts of the organization and, subsequently, to the design of more effective and efficient risk mitigating measures.

Digitization of Risk Management

In today’s dynamic world full of opportunity and risk, business transformations and increasing regulatory pressure, organizations need to become more agile while still managing their risk. Despite investments in GRC tools, risk and compliance processes in organizations today remain largely manual and siloed, and risk data remains fragmented. Significant improvements in risk management can be obtained when learning from digital business transformations. This article aims to outline the authors’ vision on how to digitize risk management, in-control, and assurance practices.

Introduction

Opportunity Statement

Despite guidance provided by professional bodies, available academic research, and significant investments in GRC tools, risk management practices at most companies remain largely manual and siloed. At the same time, the business environment is becoming more disruptive and demanding:

  • Digital transformations undertaken by many organizations rapidly evolve their IT environment and operating models;
  • Boards and Management are expected to be more transparent on their risk appetite, and how risk appetite is operationalized across the organization;
  • Regulatory pressure is increasing, while the cost and value of compliance activities are being challenged by the C-suite.

In this context, there is a clear opportunity for risk managers to contribute to business agility, quality risk decision making, and to underpin the public trust in their companies.

Our Vision: Integration across five risk dimensions

A value adding (enterprise) risk management function orchestrates integration across the following five dimensions.

1. Integrated workflow across the lines of defense (LOD)

Equipping the business (LOD-1) to effectively own their risks and controls, increasing transparency and efficiency for the risk and compliance function (LOD-2), and enabling continuous assurance for internal and external audits (LOD-3/4).

Most analytics efforts related to controls are today executed as part of assurance activities. As a result, the business is often confronted with insights from compliance or internal audit, and is forced to find reasons for what actually happened months ago. Unnecessary surprises from controls testing in Q3 can be avoided by providing the business with the right analytics insights to be continuously aware and in control of their own processes, and the associated risks and control effectiveness.

C-2018-2-Bautista-01-klein

Figure 1. Workflow across lines of defence. [Click on the image for a larger image]

By providing the business with analytics of their processes in the form of Continuous Control Monitoring (CCM), their ownership naturally increases, and they will more effectively mitigate their risks in a timely fashion. The data generated in these processes will provide LOD-2 with valuable ongoing and comprehensive transparency, and if done well, LOD-3 can rely on the same data, and achieve a form of continuous assurance. This in turn, will reduce the effort and cost required in both LOD-2 and in LOD-3/4.

2. Integration of strategic, tactical and operational risks

Based on tangible risk scenarios and using sound statistical methods.

Today, in most organizations, there is a significant disconnect between the management of operational and enterprise level strategic risks. The enterprise risk management cycle is often an isolated process, largely detached from relevant operational issues and decisions. And risk appetite statements, if articulated at all, do not get effectively deployed in the day-to-day operations, turning these appetite statements into paper exercises.

Managing risks across the enterprise, according to an appetite, in a consistent manner, can provide critical insights for decision making at every level, and ensure that scarce resources are applied in the most impactful areas.

To integrate operational, tactical and strategic (enterprise) risks, a consistent risk hierarchy is required, as well as a mathematically correct aggregation and drill-down of these risks, based on tangible, end-to-end risk scenarios. Risks should be expressed in terms of the type of business impact, and potential business losses should be quantified to provide a solid foundation for a like-for-like comparison of enterprise risks from different risk domains.  

For complex, technical risks, such as cyber, these risk scenarios should be modeled, because manual or spreadsheet-based assessments cannot appropriately represent the critical components of the risk scenarios that determine the potential losses.

C-2018-2-Bautista-02-klein

Figure 2. Loss Exceedance Curves. [Click on the image for a larger image]

It is good practice to use loss distributions, such as Loss Exceedance Curves (LEC: see diagram for example), to discuss risks, rather than using traditional risk heat-maps or risk visuals, because the latter cannot support reliable aggregation and drill-down of the risks.

3. Integrated insights from backward looking, present, and forward-looking data

By leveraging industry data, expert elicitation, and understanding risk interconnections.

The financial crisis has (once more) proven that forming decisions based only on historical data can be misleading. Especially in the current disruptive business environment, a lack of understanding of emerging risks, and how these correlate, can be a costly mistake.

C-2018-2-Bautista-03-klein

Figure 3. Dynamic Risk Assessment. [Click on the image for a larger image]

Understanding company-relevant systemic risk correlations can improve strategic planning in dynamic operating environments. Risks that seem relatively unimportant on their own, can have a major potential impact when risk correlations are considered (see Figure 3 and section C. Dynamic Risk Assessments on page 79).

To derive these correlations, we will need to rely on estimations by experts. While a data-driven approach is generally preferred, research has shown that using elicitation of experts who have followed a calibration training, can provide robust results even if the available company and industry risk data are scarce.

Lessons learned from industry peers are also of value when it comes to risk forecasting. If risk data along the timeline is systematically captured and properly articulated, management can reflect on whether choices taken in the past are future-proof, and take better informed risk decisions.

4. Integrated in-control and compliance domains

Breaking through the functional silos and integrating control frameworks across the enterprise.

Companies often still approach in-control areas and compliance domains in an isolated manner. An example is the new GDPR European privacy regulation. Many companies are creating separate controls and compliance activities for this requirement. As a consequence, we see duplication of effort, misalignment and slow progress.

C-2018-2-Bautista-04-klein

Figure 4. Integrated Control Framework. [Click on the image for a larger image]

Organizations can greatly benefit from having a single center of excellence (CoE) risk and control function (LOD-2) for the entire organization, covering all in-control and compliance domains, and having a strong strategic and operational relationship with the legal function.

Such an LOD-2 organization oversees all controls across the risk and compliance domains, captured in a single integrated control framework (see diagram), and streamlines and orchestrates mitigating and testing efforts.

The Internal Audit function will value the insights provided through this integrated framework to better assess and decide on the level of assurance across the enterprise, rather than having a necessarily light-touch approach for each individual control domain.

5. Integrated risk and control indicators and actions

Enabling the business to take quality and timely decisions based on operationalized risk appetite.

Many indicators are monitored daily in specific parts of the organization, and isolated decisions are being made to address issues. Often, these indicators are not clearly linked to risks and actions taken are unknown to the risk owners. At the same time, through external and internal assessments and audits, findings are produced, and actions defined to address them. Prioritization of actions is mainly based on who found the issue (audit actions generally taking precedence), while this might not be the best way to structurally reduce the risks of the organization.

C-2018-2-Bautista-05-klein

Figure 5. Integrated Indicators and Actions. [Click on the image for a larger image]

Articulating an integrated view of process performance, risk and control indicators, assessment and audit findings, and the associated improvement actions, will not only enrich the quality of management decisions around the adequacy of indicator thresholds (link to risk appetite), pain points, short cuts and deviations, but will also enable an end-to-end view of process issues and allow management to strike the right balance between process agility, controls and early warnings to be embedded in the day-to-day operations.

From a risk perspective, the desired integration can be achieved through the mapping of indicators, issues and actions to process, assets, controls and through that ultimately to the end-end risk scenario’s. Relatively simple changes to existing processes to structurally include such mapping, can enable this integration, and provide a powerful basis for management to more confidently set the appropriate indicator thresholds and priority of remediation activities.

How to Operationalize: Digitization of Risk Management

KPMG has extensive, global experience with implementing traditional GRC tools from all key vendors ([Lamb17]). We have found that only a small portion of the desired integrations of risk management activities which we have specified in the previous section can be achieved with these tools, and even then, this often requires costly customizations with downstream consequences for the sustainability of the solution. In fact, these limitations hamper organizations in achieving the effective digitization of their risk management processes, which is a pre-requisite for the desired integration.

Given the strong pressure on organizations from their business transformations, with new threats and increasing regulatory pressures, and aligned with the industry analysts and with WEF views on the need for risk integration and quantification, we have pursued an alternative way to help organizations to deal with these challenges. We have partnered with Microsoft to develop our own enabling technology to our customers and provide managed risk services: The KPMG Digital Risk Platform.

This platform automates and integrates risk, in-control and assurance processes based on a consistent data flow. The diagram below shows the relevant components of the integrated risk management cycle.

C-2018-2-Bautista-06-klein

Figure 6. Our vision on Integrated Risk Management (as per Gartner’s terminology) ([Kim18]). [Click on the image for a larger image]

Key Enablers for Success

It is not sufficient to just provide a new technology platform to address the challenges which organizations face. It requires us to populate this platform in such a way, with configurations and data, that organizations can use it out-of-the-box with minimum effort on their part. We do this by leveraging our intellectual property, as we explain in the following sections.

A. Continuous Compliance Monitoring (CCM)

Through its audit and assurance activities, KPMG has assembled over the years a unique library of advanced control queries (called Facts-to-Value), which can be deployed by organizations to implement Continuous Control Monitoring with minimum effort and optimal results, using our Digital Risk Platform.

KPMG has a standard method to develop control-by-control business cases for the implementation of CCM, ensuring that effort is directed to achieve maximum value early on. A good understanding of how the use of CCM should be captured in the organization’s control methodology and how the assurance processes have to updated to create a smooth transition are also important.

B. Risk Modeling

For cyber risks, KPMG, together with Doug Hubbard of HDR [Hubb16], has created a quantitative model which is an integrated component of the Digital Risk Platform. KPMG is building up a library of risk scenarios for each industry, which enables benchmarking of risks with other organizations. The model is factored in a way that minimizes the amount of company-specific information required to run the model, and the model can easily be maintained over time. We call this offering Quantification as a Service to contrast its benefits with the isolated and labor intensive alternative solutions.

C. Dynamic Risk Assessments

Since a number of years, KPMG has a method (Dynamic Risk Assessments, DRA) to capture and calculate the implications of risk interconnections, which is being embedded in the Digital Risk Platform. Engagements with clients around the world have fine-tuned the model as well as the protocol to elicit the expert estimates, so that benefits can be obtained without unnecessary effort (see the specific article on Dynamic Risk Assessment starting on page 44 in this edition of Compact).

D. Control Framework Optimization

With our KPMG approach to map controls to processes it is possible to balance process control and agility from a business outcome perspective. What we have found in our client engagements is that organizations may not only have multiple frameworks, leading to a duplication of effort, but are more often than not also over-controlled, hindering the business, and spending too much money on compliance.

It is especially important to simplify and streamline the controls before assessing the benefits of CCM, as otherwise, we may be automating controls that are actually not needed.

E. Integrated Reporting

KPMG has developed a model that structures reporting of risk data, whether these are findings, risk indicators, mitigation progress, quantified risks, maturity or benchmarking data. The model works consistently from the level of the board down to operations. This model, after Tricker [Tric15], enables the board to fulfill its fiduciary duties related to risk management, covering challenging domains such as cyber risk or privacy, in a manner that is defensible in court. This ensures that it addresses the increasing personal liabilities of board members.

As a final remark, it will come as no surprise that integrating and digitizing risk management processes is a journey that, in general, will take a several years for organizations of a significant size. However, this journey consists, if done well, of small, iterative steps, each of which provide immediate and demonstrable benefits. As long as these steps are taken with the end-goal in mind, the value for the organization along this journey will continuously keep increasing.

Summary

There is an opportunity to increase the value of current risk management practices by integrating and automating risk management in organizations across a number of dimensions. This digitization of risk management brings more transparency, better risk decisions, while at the same time, reducing the effort and cost required.

We have learned from digital business transformations, and have set-out to put the power of automation and analytics in the hands of the business, who operate the processes and controls, who own the risks, and who are therefore best positioned to ensure risks are indeed mitigated.

We have a strong vision on how to digitize risk management, and, in the absence of strong alternatives in the market, we have partnered with Microsoft to develop an Azure cloud-based platform, the KPMG Digital Risk Platform, which it offers as a managed service.

Most importantly, this Digital Risk Platform harnesses many years of globally developed KPMG intellectual property on risk management, and makes this IP available for clients in way that requires minimal effort, while ensuring early and sustained benefits.

Masterclass DRM for Financials

Tilburg University and KPMG have taken the initiative to provide organizations and individuals with the necessary knowledge in the field of digital risks. Our program focuses on the three dimensions which are important in digital risk management: processes, data and organization. For more information and registering for the master class (in Dutch only), go to www.tilburguniversity.edu/drm.

References

[Hubb16] Douglas W. Hubbard, Richard Seiersen, Daniel E. Geer Jr. and Stuart McClure, How to measure anything in cybersecurity risk, Hoboken, New Jersey: John Wiley & Sons, 2016.

[Kim18] Elizabeth Kim and John A. Wheeler, Competitive Landscape: Integrated risk management solutions, Gartner Report, 2018.

[Lamb17] G.J.L. Lamberiks, I.S. de Wit and S.J. Wouterse, Trending topics in GRC Tooling, Compact 2017/3, https://www.compact.nl/en/articles/trending-topics-in-grc-tooling/, 2017.

[Tric15] Bob Tricker, Corporate Governance: Principles, Policies and Practices, Oxford: Oxford University Press, 2015.

Challenges in IT multisourcing arrangements

Today, IT multisourcing is considered to be the dominant sourcing strategy in the market. However, the way in which clients and vendors exchange information and create value within such arrangements can be quite a challenge, due to interdependencies. This paper explores an IT multisourcing arrangement in more detail, to identify challenges and provide a strategy to overcome these challenges and create value. Based on what we have learned from various IT multisourcing arrangements, we have developed a reference model that can be used by clients and vendors to govern their eco-system, and as such, encourage value creation.

Introduction

As the market for IT outsourcing services increased significantly over time, IT vendors had to specialize ([Gonz06]) to distinguish themselves and remain competitive. IT outsourcing arrangements evolved from a dyadic client-vendor relationship to an environment that includes multiple vendors ([Bapn10], [Palv10]). Currently, a multisourcing strategy is said to be the dominant modus operandi of firms. The shift from single sourcing towards multisourcing arrangements provide firms with benefits, such as quality improvements by selecting a vendor perceived as best in class, access to external capabilities and skills, and mitigating the risks of vendor lock-in. Firms that are involved in collaborative networks have to significantly invest in time, commitment and building trust to achieve common value creation and capturing by means of interaction between multiple sourcing parties. Within the context of IT multisourcing arrangements, which can be considered as collaborative networks or eco-systems, parties within such an arrangement need to coordinate their tasks due to interdependencies. However, it is important to consider how parties exchange information and knowledge and contribute to common value creation. Consequently, if parties are not able or willing to exchange information and knowledge this may result in barriers that affect common value ([Plug15]). Given this challenge, we argue that a holistic approach is required to delineate and analyze the relationships in an IT multisourcing arrangement as a whole. First, by using the metaphor of an eco-system, we are able to study interdependencies between clients and vendors, addressing themes like specialization and value creation. Second, parties that do exchange information and knowledge in an eco-system are influenced by the degree of openness, clear entry and exit rules, and governance, which correspond to Business Model thinking. The value of this advanced understanding is that common value creation within the context of IT multisourcing can be explained, while barriers that hinder these processes are identified.

IT Multisourcing and eco-systems

IT Multisourcing

Practice shows that an IT multisourcing arrangement is based on the idea that two or more external vendors are involved in providing IT services towards a client. The basic assumption is that external vendors work cooperatively to achieve the client’s business objectives. This may relate to IT projects, but also to more regular types of services, such as managed workplaces, IT (cloud) infrastructure services (e.g. IaaS and PaaS) and application management services ([Beul05]). Importantly, collaboration between parties in a competing IT multisourcing arrangement is key to align their interests, avoid tensions, and strive to achieve common value. Value is created through interaction and mutually beneficial relationships by sharing resources and exchanging IT services. In general, it is assumed that value is created by the client organization and its external vendors ([Rome11]). So, in value creation the focus is on a service that is distinctive in the eyes of the client. Value creation can be seen as an all-encompassing process, without any distinctions between the roles and actions of a client and the vendors in that process. Thus, an IT multisourcing environment can be conceptualized as an eco-system ([Moor93]), in which the client and vendors exchange information and knowledge to jointly create and capture value.

Eco-system

The idea of an eco-system is to capture value to the network as a whole, as well as take care that the client and vendors get their fair share of created value, or focus on capturing the largest part of the common value for themselves. The latter may negatively affect the sustainability of the eco-system. Eco-system thinking is more based on flexibility and value as core elements. Flexibility is necessary to respond to changing market developments, fierce competition, but also to opportunities. However, interdependencies between a client and its vendors may hinder the exchange of information and knowledge, and thus hinder value creation. This may lead to the underperformance of the eco-system in the long run. A strategy to overcome interdependence challenges, is that a client and its vendors regularly align their common interests, as well as their day-to-day operations. Hence, value creation and capturing needs to be established at a network/eco-system level while paying attention to the business models of all individual eco-system partners in order for an eco-system to survive. To achieve value in the eco-system as a whole, existing contracts between the client and vendors must include guidelines on how to collaborate and exchange information to support value creation.

Challenges

Specifically, from an operational perspective specifying long-term IT outsourcing contracts that span multiple vendors is complex and inherently incomplete, because clients and vendors have to deal with uncertainty and unanticipated obligations and incidents. Hence, clients should govern an eco-system beyond traditional contractual agreements and also build mutual relationships to support the exchange of information. However, this may cause a challenge as vendors may have conflicting goals and objectives, such as increasing their revenue at the cost of their competitor or the absence of financial agreements to fulfill additional tasks. In summary, key challenges that may arise in an IT multisourcing arrangement are: incomplete contracts, competition between vendors, willingness to share and transfer knowledge between vendors, and a lack of a client’s governance to manage the landscape as a whole. These challenges may hinder value creation, which is considered as the preferable outcome of establishing an IT multisourcing arrangement. To indicate value creation challenges, the case study below describes how a client and three key vendors deal with IT multisourcing challenges.

Case study

The client under study is positioned in the fast-moving consumer goods market and sells products in Europe. Importantly, the client’s business processes are highly dependent on IT to fulfill their customers’ needs in time, e.g. ordering systems, logistic function, replenishment, and payments. Today, the client is expanding its portfolio as online business is growing, while new store formats are being developed to extend the range of products. In order to retain their competitive position in the market, the client had to decrease the cost level of its IT. Currently, the client is in the midst of a business application transformation. This involves transitioning from various legacy applications to a new application landscape, developed to support new business strategies (e.g. online shopping). The setting for this case study focuses on the outsourcing relationships between the client and three key IT vendors. As illustrated in Figure 1, Vendor 1 is responsible for the IT infrastructure services, which are geographically dispersed across various data centers. Vendor 2, who acts as a service integrator, provides services related to various legacy applications. Next, Vendor 3 also acts as a service integrator, however, with regard to cloud services enabling applications that support the new business strategy. In addition, the client extended the multisourcing arrangement by contracting sixty smaller IT vendors, all acting as subcontractors (S), providing services to the three key vendors. We interviewed eighteen representatives at the client, as well as the vendor organizations, to identify the specific multivendor challenges that they experience.

C-2018-1-Plugge-01-klein

Figure 1. Multi-sourcing arrangement under study. [Click on the image for a larger image]

Contractual challenges

Our case study shows the contractual relations between the client and each vendor. Considering the eco-system, we find that the contracts comprise high-level information with regard to a coherent inter-organizational structure, strategy, and plan, as well as the position of each party and their mutual relationships. Moreover, documentation showed that the client set up entry and exit rules on how to deal with new vendors, for example technology partners like Microsoft and Oracle. However, we did not find any detailed information on the set-up and implementation of eco-system entry and exit rules at the client or at the vendors. The absence of such details resulted in fierce discussions about service provisioning between the client and its vendors over time. Hence, the lack of details regarding entry and exit rules hinder parties in creating value.

‘We have to become much more mature to be flexible and change partners regularly in our arrangement. This means that we have to work on the details like specs. This allows us to collaborate better and prevent technical discussions between all parties.’ (Source: Client CIO.)

We did not find information that formal contracts include collaborative agreements and plans between eco-system partners, even though operational services have to be delivered by collaborating, and in other domains competing, vendors. All vendors set up Operational Level Agreements (OLAs) to improve the service performance as IT services are mutually dependent. However, these agreements are informal, and not included in the contracts.

‘Based on an informal agreement with the other vendors we started to collaborate on an operational level. For instance, we shared technical application maintenance information with Vendor 1 to deploy and tune our application with their IT infrastructure.’ (Source: Vendor 3 – Contract and delivery lead.)

Figure 2 illustrates the contractual relationships within the eco-system. The straight lines (A) represent the formal bi-lateral contracts between the client and its vendors. The dotted lines (B) show the informal operational agreements between the vendors.

C-2018-1-Plugge-02-klein

Figure 2. Contractual relationships. [Click on the image for a larger image]

Service portfolio challenges

We identified that the client consciously developed a service portfolio blueprint and plan, and allocated the various IT services to the three vendors respectively. The service portfolio plan and the division of services is supported by formal and informal agreements (i.e. contracts and Operational Level Agreements), while clear boundaries and scope are set with regard to who is responsible for service integration tasks. However, we found that on a more operational level the way in which the service portfolio is governed across the eco-system is ambiguous. We observed that the service boundaries of the vendors on a detailed level were overlapping, resulting in various operational disputes. Examples were related to specifying functional requirements, conducting impact analyses, and technical application management. Consequently, as the vendors were reluctant to collaborate with each other, the client experienced a decrease in service performance, and an extension of project lead times, affecting value creation.

‘The client has set up a service portfolio plan that describes the boundaries of each IT domain, but this plan is not sufficient. In fact, the existing plan can be seen as high level with limited details; actually it’s a workflow diagram that lacks concrete tasks that result in service overlaps.’ (Source: Vendor 2 – Contract manager.)

Due to multiple service interdependencies between the vendors, we noticed that service boundary overlap was considered to be a barrier that affected the exchange of information and knowledge, and as such hindered value creation. We found evidence that the vendors under study shared information mutually, as multiple ad hoc meetings were initiated to discuss and solve operational performance issues. This form of collaboration is more dependent on informal operational agreements and trust, which is typical for an eco-system.

Figure 3 depicts the service portfolio relationships within the eco-system. The straight lines represent the formal service portfolio agreements between the vendors as described in the contracts. The dotted lines represent the informal service portfolio agreements between the vendors and the client.

C-2018-1-Plugge-03-klein

Figure 3. Service portfolio streams. [Click on the image for a larger image]

Information and knowledge challenges

We found that IT services are partially based on the willingness of the client and vendors to exchange information and knowledge, and that informal arrangements are becoming more apparent. Since applications and IT infrastructure are loosely coupled, the employees of the vendors have to exchange information within the eco-system to ensure the availability and performance of IT services. Due to indistinct service descriptions, which were caused by overlapping service boundaries, and competition between vendors; vendors are unwilling to share technical information with regard to applications and infrastructure. The vendors who are part of the eco-system are also competitors, because they are able to provide comparable services to the client. Hence, vendors focus on safeguarding their Intellectual Properties (IP) to retain their competitive advantage.

‘There are IP issues amongst vendors, even for simple things like sharing information on Unit Testing and end-to-end testing. Due to their competition vendors do not want to share technical information. Moreover, the vendors that act as Service Integrators provide similar types of services in the same market and both act as strong competitors.’ (Source: Client Sourcing Manager 2.)

On an operational level, information was exchanged between the client and vendors on an informal basis. We found that employees of V2 and V3 are willing to share information informally to prevent underperformance of their IT services. As V2 and V3 were held responsible by the client for service integration tasks, their employees shared technical information amongst eco-system partners that was related to application work-a-rounds, reporting information, and IT tooling. Actually, no formal processes were set up. Instead employees distributed information when it seemed relevant for the eco-system partners. This approach contributed to building trust between autonomous eco-system partners and reduced the level of operational risk. Figure 4 illustrates that all parties exchange information and knowledge. The straight lines indicate that each party is involved in sending and receiving information and knowledge to support the delivery of IT services.

C-2018-1-Plugge-04-klein

Figure 4. Information and knowledge exchange. [Click on the image for a larger image]

By reviewing the various perspectives, we are able to identify similarities and distinctions between client and vendors in sharing services and information. Based on the case study, we have summarized some key challenges below:

  1. the client deliberately focuses on a ‘power’ role to manage the vendors, and as such, competition between vendors is encouraged and this restricts their willingness to exchange services and information;
  2. due to the partial incompleteness of the contracts and the service portfolio overlap additional information and knowledge has to be exchanged amongst the vendors, which limits their efficiency;
  3. the limited degree of interaction from the perspective of the client implicates a mistrust towards the vendors and hinders the establishment of a common interest.

Overall, the challenges show that value creation is hindered, because the relationships between the client and vendors are unbalanced. By applying governance mechanisms to the challenges as described above, the client and vendors are able to develop a strategy to overcome these challenges.

Strategy to create value by using an eco-system approach

Based on a review of various IT multisourcing arrangements during the past decade, we have developed a reference model to overcome IT multisourcing challenges. The objective of KPMG’s multisourcing reference model is to establish a coherent eco-system that can be governed effectively. As such, clients and vendors may benefit from establishing an environment that is focused on creating value, rather than stimulating competition. KPMG’s IT multisourcing reference model can be used to assess how governance between parties is set up, in order to identify ‘governance blind spots’. The methodology focuses on governing the interdependencies between four essential governance modes, namely: inter-organizational mode, contractual mode, relational mode, and collaborative mode. Each governance mode comprises various attributes that are studied in-depth to reveal their existence, as well as their mutual relationships. Importantly, the reference model can be used to assess the governance between a client and its vendors, and between vendors. As a result, identified governance deficiencies can be repaired, which contributes to achieving a sustainable sourcing performance of all parties over time. The reference model (see Figure 5) consists of multiple layers, in which each governance mode attribute (Layer 1) can be broken down into various building blocks (Layer 2), to specify the details.

C-2018-1-Plugge-05-klein

Figure 5. KPMG’s multisourcing reference model. [Click on the image for a larger image]

Inter-Organizational governance mode

With regard to the first governance mode ‘Inter-Organizational governance’, the key objective is to determine an inter-organizational structure, to identify the role of each party (client and vendor) in the eco-system. A corporate framework that describes the role of the client and its vendors is helpful to be able to position each party. In addition, strategic guidelines or policies can be established to avoid uncertainty with regard to the role of each vendor. Examples are: setting up clear entry and exit rules for vendors, describing a coherent architecture to guard service boundaries between all vendors, and establishing a service portfolio framework that reflects the eco-system as a whole.

Contractual governance mode

The ‘contractual governance’ mode determines and ensures that contractual aspects and their interdependencies are described in a thorough manner. As a starting point, regular bilateral service agreements between the client and each vendor are described to ensure the provisioning and quality of IT services. In case one or multiple vendors act in the role of service integrator, additional guidelines are required to describe and agree on end-to-end (E2E) service agreements. In practice, this is more difficult compared to single outsourcing arrangements, as multiple vendors are dependent on each other, in which the service integrator has the final service responsibility towards the client. Next, mutual Operational Level Agreements (OLAs) are required to streamline operational tasks between the vendors, for instance in sharing information about workarounds and technical application maintenance tasks. In the end, rules regarding Governance, Risk, and Compliance also need to be setup to ensure that the eco-system as a whole is regulated guided.

Relational governance mode

When addressing the ‘relational governance’ mode, it is important to identify and describe the mutual relationships between all parties. Common activities are setting up a regular meeting structure between a client and each vendor. However, it is also beneficial to implement cross client vendor meetings, since vendors might be interdependent. As such, it is relevant to also exchange vendor-vendor information. This results in the need to create clarity on mutual roles and responsibilities between all parties. An eco-system RACI (Responsibility, Accountability, Consulted, Informed) matrix might help to structure and guard the role of each party. General procedures further guide the exchange of information between the client and vendors, for instance about the replacement of key personnel, invoice mechanisms, complaint management and dispute resolution procedures.

Collaborative governance mode

The ‘collaborative governance’ mode determines and encourages collaboration between parties in order to deliver end-to-end services. Key topics are developing and implementing processes that support collaboration between the client and vendors, creating a culture that is based on sharing information and balancing the power-dependence relationship. Moreover, establishing shared values and understanding may encourage collaboration even further, for example by creating a shared vision and common objectives and commitment. In addition, mechanisms can be developed to exchange information and knowledge, and promote continuous learning and capability development between the eco-system parties. These topics create a ‘what’s in it for us’ way of working, that relates to the philosophy of Vested Outsourcing ([Vita12]).

Tooling

Finally, tooling can be used to support the above-mentioned governance modes effectively. In practice, various solutions are available that streamline mutual activities to increase performance and limit the number of faults or disputes between eco-system parties. For example, tooling is used to support IT services and IT processes ([Oshr15]). Collaborative tools are used to automatically exchange information between the client and vendors, and increase awareness and continuous learning. Accounting and reporting tools can be used to report IT (end-to-end) performance, financial status and invoices, and contractual obligations. Figure 6 illustrates the reference model in the form of a governance heat map that reflects the status of the eco-system.

C-2018-1-Plugge-06-klein

Figure 6. Reference model illustrated as a governance heat map. [Click on the image for a larger image]

Conclusion

Based on the lessons learned from various IT multisourcing arrangements and the conducted case study, we experienced that a holistic perspective is needed to align single governance modes and create a coherent approach to transform into an eco-system. The benefit of a coherent approach is that clear ‘rules of engagement’ can be defined between all parties that limit service boundary overlap, and increase collaboration by exchanging information and knowledge, which is a prerequisite for value creation. The KPMG IT multisourcing reference model has been applied both in the Netherlands and abroad, and is perceived to be a proven approach to transform an IT multisourcing arrangement into an IT eco-system. By applying the model, clients and vendors may use this strategic instrument to improve their services and create value.

References

[Bapn10] R. Bapna, A. Barua, D. Mani and A. Mehra, Cooperation, Coordination, and Governance in Multisourcing: An Agenda for Analytical and Empirical Research, Information Systems Research, 21(4), 2010, p. 785-795.

[Beul05] E. Beulen, P. Van Fenema and W. Currie, From Application outsourcing to Infrastructure Management: Extending the Offshore Outsourcing Service Portfolio, European Management Journal, 23(2), 2005, p. 133-144.

[Gonz06] R. Gonzalez, J. Gasco, J. Llopis, IS outsourcing: a literature analysis, Information and Management, 43, 2006, p. 821-834.

[Moor93] J.F. Moore, Predators and Prey: A New Ecology of Competition, Harvard Business Review, 1993.

[Oshr15] I. Oshri, J. Kotlarski, L.P. Willcocks, The Handbook of Global Outsourcing and Offshoring, 3rd edition, Palgrave Macmillan: London, 2015.

[Palv10] P.C. Palvia, R.C. King, W. Xia and S.C.J. Palvia, Capability, Quality, and Performance of Offshore IS Vendors: A Theoretical Framework and Empirical Investigation, Decision Science, 41(2), 2010, p. 231-270.

[Plug15] A.G. Plugge and W.A.G.A. Bouwman, Understanding Collaboration in Multisourcing Arrangements: A Social Exchange Perspective, In: I. Oshri, J. Kotlarsky, and L.P. Willcocks (Eds.), Achieving Success and Innovation in Global Sourcing: Perspectives and Practices, LNBIP 236, p. 171-186, Berlin Heidelberg: Springer-Verlag, 2015.

[Rome11] D. Romero, A. Molina, Collaborative Networked Organisations and Customer Communities: Value Co-Creation and Co-Innovation in the Networking Era, Production Planning and Control, 22(4), 2011, p. 447-472.

[Vita12] K. Vitasek and K. Manrodt, Vested outsourcing: a flexible framework for collaborative outsourcing, Strategic Outsourcing: An International Journal, 5(1), 2012, p. 4-14.

Robotic Process Automation: how to move on from the proof of concept phase?

Many organizations struggle to scale up towards full implementation after the RPA proof of concept. The structured 6×6 RPA governance framework provides guidance and best practices for implementing and operating RPA. Key things learned from a client case are shared to help avoid common pitfalls and provide practical insights.

Introduction

The growing range of automation solutions is providing new standards across industries. These solutions, also referred to as ‘digital labor’, include a range of robotic automation solutions. In general, we can distinguish between three categories of digital labor: 1) basic process automation, 2) enhanced process automation, and 3) cognitive automation. Robotic Process Automation (RPA) is a specific solution in the first category. RPA is currently the most mature and widely adopted robotic automation solution.

Many organizations grasp the variety of benefits that RPA can offer, but at the same time are still hesitant to ‘pull the implementation trigger’. The instinctive reaction of many executives and managers is one of high caution. This reluctance to move forward is almost always caused by a legacy of unsuccessful process optimization and IT implementation projects.

As a result, organizations often opt to start small by initiating a RPA Proof-of-Concept (PoC) instead of a full-blown company-wide implementation. The PoC provides a contained approach where one or two processes are robotized in a test environment, usually within the boundaries of a single department or business unit. Typically, the PoC is aimed at demonstrating: 1) the technical compatibility of the RPA software in the existing IT landscape, 2) the ease of development and functional effectiveness of the RPA solution, and 3) selection of the optimal RPA software provider.

These questions are usually fairly easy to answer. However, problems arise when not enough attention is given to investigating the value potential and the limitations of a full organizational RPA implementation. Issues tend to form around sourcing strategy, change management, optimal process selection and analysis, and proper embedment of RPA within the existing IT, risk and governance frameworks. These issues can be brought back to two dominant themes: 1) adoption of RPA in the organizational vision and strategy, and 2) effective implementation of RPA across the organization. In this article we introduce the 6×6 RPA implementation framework which helps organizations to address these themes.

RPA unlocks the long tail of automation

In order to effectively scale RPA within the organization it is important to fully understand how RPA is positioned within the broader landscape of enterprise IT automation. A common misconception within the traditional IT function is that RPA is to be used to replace the existing enterprise and legacy systems. While there are plenty of use cases where this is indeed a viable and beneficial possibility, especially for unlocking short-term benefits, this is not necessarily the primary objective of an effective, long-term RPA strategy and vision.

C-2018-1-Doesburg-01-klein

Figure 1. RPA enables the long-tail of automation. [Click on the image for a larger image]

When comparing RPA with traditional automation, there are two key differentiators. The first is that RPA expands beyond the realm of IT governed enterprise systems, and brings into scope processes that are (partially) run by business governed applications including web-based applications, Excel, email, reporting tools and so on. This distinction is important as it enables a far wider scope of automation possibilities, especially when combining the RPA solution with existing automation and Operational Excellence initiatives to optimize end-to-end processes rather than siloed processes.

The second key differentiator between traditional automation and RPA, is that RPA is characterized by much shorter development and implementation times, therefore enabling the business case for, again, a far wider scope of processes.

DIY or DIFM?

The inclusion of this ‘long-tail’ of business governed applications and processes prompts the reevaluation of the classic sourcing question: Do-It-Yourself (DIY) or Do-It-For-Me (DIFM)? While the delivery of the RPA software is defacto outsourced to RPA software suppliers, the performance of the RPA process analysis, development and maintenance activities can be integrated within the existing organization (DIY) or be (partly) outsourced to third-party consultants and BPO suppliers (DIFM).

Box 1. DIFM client case.

DIFM strategy case: robotization at an international electronics manufacturer

Issue

After a number of Proofs-of-Concept, the client decided to outsource the rollout to third parties. In order to manage this thoroughly and in a structured manner, KPMG was requested to advise on the implementation and operating framework. The client has centralized operations, governance, IT, risk and control management.

Approach

KPMG adapted the essential parts of the 6×6 model to the situation and applied it to the existing organization. This created awareness and understanding of the new collaboration with stakeholders.

In addition, the organization in identified and introduced the role and function of a ‘center of excellence’ (CoE) within the organization and in managing third-party relationships.

The outcome of the Proofs-of-Concept provided insight for the level of expertise and capacity required within the organization.

Key drivers behind the decision for either strategy are: retention of knowledge, level of control in the business, scalability, RPA expertise, speed of implementation and focus by the business on core activities. The optimal strategy mostly depends on the organizational strategy, business model, skills and capabilities and organizational culture; forgetting to consider these strategic drivers when forming the implementation approach is a recipe for failure, or in the best-case scenario will lead to underutilization of potential benefits and value.

In the remainder of this article we will introduce the 6×6 RPA framework. To provide some lessons learned and practical insights a client case has been incorporated. The client case applies to a Dutch bank which has fully implemented RPA throughout the entire organization. The client opted for a hybrid DIY & DIFM sourcing strategy, in order to capture both the benefits of knowledge retention and control in the business as well as scalability via an outsourcing partner. This makes the case study well suited to illustrate the effects of both strategies.

Box 2. DIY client case.

DIY strategy case: robotization at an international brewery group

Issue

The client had previously automated a number of processes at its head office, shared service centers and subsidiaries. The client wanted to run the robotization of processes smoothly and engaged KPMG to assist. The client has a decentralized setup with regard to its operations, governance, IT, risk and control management.

Approach

Using the 6×6 framework provided more awareness and a better understanding of the overall impact of implementing RPA and establishing centers of excellence, including process development training, within the organization.

A long-term RPA vision was formed to ensure that the DIY model fits within the long-term organizational and HR strategy.

Clear insight was provided into roles, responsibilities and the impact of robotization on secondary processes such as Finance, IT and BPM.

The 6×6 RPA governance framework

The mentioned RPA distinctions are not a stand-alone phenomenon, but rather are part of a wider trend of ongoing digitalization and increasing demand for flexibility and agility. IT and technology are no longer the exclusive domain of the IT function. As technology becomes more intuitive and user-friendly it becomes part of the day-to-day business. In addition, organizations no longer accept long-lasting and stretched-out development projects.

C-2018-1-Doesburg-02-klein

Figure 2. KPMG 6×6 RPA governance framework (simplified). [Click on the image for a larger image]

The KPMG 6×6 RPA governance framework is loosely based on the KPMG IT Target Operating Model (TOM) ([Koni16]), and consists of 6 levers, each consisting of 6 subjects constituting a structured RPA implementation and operating model. Part of the framework are the RPA vision (e.g. organizational vision, business drivers) and RPA strategy (e.g. sourcing strategy) which continuously drive evaluation of the levers. The levers act as a framework to help design the proper implementation approach and operating model.

1. Organizational Structure & Governance

A proper design of the organizational structure and roles, and the governance to support it, is critical for an effective adoption. Since RPA implementations contain elements of business process design, operational excellence and IT automation components, it cannot be overstated how paramount this is. In terms of governance, it is wise to make adjustments to allow for a more flexible, agile and business-driven approach. A common pitfall is the creation of a new governance framework, coexisting with the existing governance and control frameworks. It should preferably be approached as an addition to the existing governance framework to drive consistency and collaboration throughout the organization.

Choices have to be made between forming a central delivery team (CoE) and/or forming decentralized teams within business units or departments. The tradeoff between specialization and control versus flexibility and business integration are the differentiating drivers here. A proper design and implementation of reporting mechanisms, roles and responsibilities are key. Inclusion of IT, Risk and Compliance within the governance design process is a key success factor for ensuring compliance and in control processes.

Case study: a Dutch bank

In our client case a central RPA CoE was created within the Operational Excellence (OpEx) department. Process development is performed by KPMG (DIFM) while simultaneously training and adding process developers from the OpEx and IT function (DIY). The CoE forms the bridge between the business, which remains responsible for the robotized processes, and IT which governs the maintenance and technical support.

Controlled by the business, governed by IT

For this client the central delivery approach provided the benefits of 1) being able to quickly develop best development practices, 2) create flexibility in terms of scaling the team based upon demand from the business, 3) creating an optimal process selection methodology, prioritizing processes that deliver most value for the organization as a whole, and 4) allowing the business to focus fully on core business competences.

2. Process Delivery and Deployment

Process delivery and deployment is about setting up demand mechanisms, both bottom-up and top-down, and putting in place clear process analysis, selection and delivery mechanisms. Which processes can we robotize (feasibility) and which processes do we want to robotize (business case and value drivers)? A key success factor is to use the RPA capability within the context of a broader ‘optimization toolbox’. Rarely will entire end-to-end processes be eligible for RPA automation, very often though maximum value can be generated by robotizing the most transactional process parts while optimizing the more complex, or inefficient, manual process steps via OpEx and Lean methodology or IT change requests.

As stated earlier, the advantage of RPA from a delivery point of view is the ability to respond quickly to business needs and the high speed of development and deployment. In order to fully unlock these benefits, apply some best practices such as the use of proper development standards and conventions. This allows for reuse of ‘building blocks’ and consistent ‘layering’ of the robotized processes, enabling same-day adjustment of business rules when needed.

3. Technology

Some key subjects to consider as part of the implementation are the preparation of the technical infrastructure, setting up application servers, configuring robotic runtime resources and database configuration to support test and production environments.

Unique to RPA is the distinct focus on user ID and credential management. RPA is defacto about mimicking manual tasks via employees’ graphical user interface, therefore in some cases a robot may have several system credentials, opening the possibility for fraudulent actions if the robot were to be compromised. Encrypted credential management and clear agreements on role separation are the basis for a safe and effective development process.

Case study: a Dutch bank

Automation in general is often associated with cost reduction via FTE reduction, thereby underestimating the far broader range of benefits that RPA is able to unlock. In our client case several manual transaction and payment processes were robotized. Through iterative root cause analysis on remaining failure cases, the business rules were adjusted increasing first time right percentages to almost 100%, thus reducing rework and client complaints.

Build the best business case

In another example RPA was used to create new processes rather than automating existing ones; consolidated reports containing information from a set of enterprise systems and external web applications were prepared and sent out to clients daily. Several client reporting processes were improved by increasing both the frequency and predictability of delivery, as well as the amount of data points provided. As a final example, focus on the process selection approach on transactional processes with the ‘four-eyes principle’ provided both additional workload reduction and more in-control processes as the risks for human error and fraud were mitigated.

4. Vendor management

Another key success factor when scaling up to full implementation is the selection and management of the RPA vendor. There are many options in terms of contract and license agreements, offered support levels and SLA agreements. In terms of offered functionality there exist significant differences between the various suppliers. Some are specialized in so-called attended front-office robots, allowing individual employees to run ad-hoc processes in real-time, particularly suited for client-facing call center employees for example. More common currently are providers that offer unattended RPA tooling, aimed at processing large amount of batch processes via set schedules. A thorough analysis of the vendor requirements beforehand will significantly help to find the best suited vendor for the given organization.

5. Performance & Risk Management

In order to create adoption of RPA throughout the organization it is important to measure and visualize the benefits that are being realized. Formulation of the right KPIs is key, avoid focusing solely on work reduction, but rather focus on value adding KPIs such as quality, first time right, predictable service levels and client satisfaction.

In terms of being in control it is important to document the automated processes and create clear and concise process descriptions. Next to this simply being a compliance and (external) audit requirement, it also enables the hand-over of tasks, process maintenance, and ultimately will force the CoE and the business to regularly review in production processes for improvement opportunities.

6. People & Competences

A key part of managing the implementation is having a clear vision on why the change is needed and how this change will affect the workforce and employees; the case for change. It is paramount that the case for change is carried and communicated by the leadership, as this is a pre-condition for 1) adoption and cooperation from affected business units, and 2) clarity for all about what is expected and how employees can contribute to and be part of the change.

Employees have to be prepared for collaborating with and using robots. How can we involve the employees and strengthen future employability? Another aspect is long-term resource planning; how do you utilize the existing employees and what (new) competencies are expected. What is the impact on existing learning paths and education? The use of robots can impact the career and the remuneration of employees in teams in which robots and people collaborate. Strategic workforce planning is therefore key in building a sustainable organization. Ultimately employees will start to ask: ‘how can robotics help me to become more effective?’, rather than ‘will robotics help me to become more effective?’.

Conclusion

RPA is a powerful automation solution that offers a variety of opportunities to improve quality, increase control, add flexibility, and unlocks a wide scope of automation possibilities. However, a clear RPA vision and strategy, feeding into the implementation approach and operating model are prerequisites for success.

RPA adoption will continue to grow in the years to come. Meanwhile more advanced robotics solutions will continue to mature and be adopted across industries. Those organizations that are successful in scaling RPA are best positioned to advance to and reap the benefits of enhanced and cognitive automation solutions.

Reference

[Koni16] ir. T.C.M. de Koning RE, drs. Ing. O. Halfhide, drs. V.F.L. Bos, Next-Generation IT-operatingmodellen sluiten naadloos aan op de snelheid en flexibiliteit van de business, Compact 2016/2.

Blockchain: with great power comes great responsibility

Blockchain is seen as a new technology which potentially enables enormous cost savings and efficiency gains. Private blockchains allow the user to have more control over its configuration; they allow the user to specify which parties can participate and set the ground rules. However with great power comes great responsibility: it is crucial that these blockchains are set-up correctly in order to be able to rely on the benefit of blockchain, immutability. In this article we examine the intricate world of blockchain risks and give a first impression of a blockchain maturity model to enable organizations to work effectively and securely with blockchain.

Introduction

Blockchain is seen as a new technology which potentially enables enormous cost savings and efficiency gains. It is almost impossible not to hear the word blockchain in the news at least once a day. It is applicable for a wide range of use cases and therefore in almost all industries there are organizations looking at the use of blockchain technology to optimize or enhance their processes.

The advantages of blockchain technology seem to have no boundaries. However, while current experimentation with blockchain is mostly in the proof-of-concept phase, what will happen when blockchains start to enter the business domain? The immutability of blockchain networks means that once data is shared it cannot be revoked. Are traditional IT risk frameworks still sufficient to keep such risks under control? In this article we examine the intricate world of blockchain risks and give a first impression of a blockchain maturity model to enable organizations to work effectively and securely with blockchain.

Public versus private blockchains

This article is the second in a series of articles about blockchain. In the first article [Spen16] an overview was given of the benefits of using blockchain and the differences between a public and a private blockchain.

The article ended with the conclusion that blockchains get their value from having multiple parties working together and sharing business processes in a value chain. Public versus private implementations each have their own pros and cons and therefore are different. To recap, please see Table 1 below.

C-2017-4-Spenkelink-t01-klein

Table 1. Key differences between public versus private distributed ledgers.

Using blockchain technology is much more than simply introducing new IT; existing business processes and even entire business models will be changed by adopting this innovation. Blockchains deliver most of their value in having multiple parties work together in an efficient and effective manner, which means that the process of redesigning existing business processes is not a standalone action. One has to get the entire value chain ‘on board’ before starting to use blockchains.

This article focuses on the use of private blockchains, or more accurately called Distributed Ledger Technology (DLT). Currently most implementations of blockchain in the market are based on a DLT platform, such as Hyperledger or Corda. Businesses choose such a type of platform because they want to keep a certain level of control over their blockchain implementation, and a private blockchain or DLT enables them to do so.

Distributed Ledger Technology

When using a public blockchain, as the name suggests, anyone can connect to the existing infrastructure of, for example, Bitcoin or Ethereum. This means that one can simply start transacting on this network without setting up an IT infrastructure to facilitate this.

Unlike public blockchains, the nature of private blockchains is more similar to a traditional IT system in that the users of the platform have to set up and maintain the infrastructure themselves. So a group of banks running, for example, a trade finance blockchain on a private ledger will have to select the DLT implementation they see as most suitable and start deploying this on a set of nodes that they host. On top of this they have to configure settings, such as the consensus mechanism to use, the nodes which are allowed to connect to the network and the creation of identities.

As one can imagine, the greater flexibility of private blockchains also incurs a greater responsibility and getting grip on the risks involved in running such a platform is essential.

Therefore the writer of this article has carried out systematic research into the IT risks involved in implementing distributed ledger technology for financial transaction processes. This has resulted in a DLT maturity model which can be used to assess the state of a DLT implementation and how well certain DLT-specific IT risks are under control.

To clarify the concept of IT risk for the reader, the following definition by ISACA [ISACA09] is taken as leading:

“The business risk associated with the use, ownership, operation, involvement, influence and adoption of IT within an enterprise.”

DLT IT Risks

The basis of the model has been a thorough literature review of DLT IT risks. A set of 51 papers was selected and analysed for DLT IT risks.

The studies related to IT risks were used in combination with existing literature on financial services to build the IT risk areas. Implementing DLT technologies exposes an organization to several IT risk factors, these risks can be summarized into eight DLT risk areas, which are shown in Figure 1.

C-2017-4-Spenkelink-01-klein

Figure 1. DLT risk areas.

Some of the risks in the eight areas overlap with more traditional IT implementations, while other risks are completely new, due to the decentralized nature of a DLT system. For example, a new risk is the fact that all nodes need to upgrade their software version at the same time in order to prevent the blockchain from forking. However, this ‘new’ risk falls under a ‘traditional’ category of change management.

To get an impression of how DLT influences these risk areas, see the box about the impact on access and user management.

Access and user management

User access management of blockchain technology is a new concept, for which so far no best practices and standards have been found and set. Blockchain uses unique addresses which are assigned to each participant in the network. This address is used for transactions (sending and receiving) and enable participants to authenticate themselves and these transactions by using a public key.

The provisioning process of these key-pairs (unique identifier) and assigning access rights is different for each DLT implementation. Due to the fact that DLT heavily relies on digital identity, this means that adequate management and security around the process of providing and storing the cryptographic keys is of great importance. In addition, users from multiple organizations, with user access authorizations are difficult to manage because the network is distributed, at this moment there is no oversights/supervisory body which checks on valid access rights.

This results in risks of unauthorized access of participants (organizations) and users due to the lack of an overall supervision/oversight that manages access for user and participants.

IT maturity models

Maturity can be described as ‘a measure to evaluate the capabilities of an organization with regard to a specific discipline’ ([Rose05]). A maturity model helps organizations to grow towards maturity by showing the current standings and providing a roadmap towards increased maturity. In order to mature, a set of benchmark indicators is necessary. In the field of IT maturity, there are several models, mostly focusing on a sub-section of IT maturity, such as service integration, open source or DevOps. However, as noted by Becker et al. [Beck10] IT maturity models have rarely been conceptualized in detail and it is mainly the Capability Maturity Model (CMM) and its successor Capability Maturity Model Integration (CMMI) that have had a large impact in the area of IT maturity. In their analysis of IT maturity models Becker et al. conclude that 15 out of 20 articles refer to CMM(I) as the de facto IT maturity model.

Therefore, the authors have decided to use the CMMI maturity model as a basis for developing the DLT risk maturity model. The CMMI model uses five maturity levels to measure maturity, these five levels are the basis for assessing DLT Risk maturity (see Figure 2 on CMMI maturity levels).

C-2017-4-Spenkelink-02-klein

Figure 2. CMMI maturity levels.

Creating a DLT IT maturity model

C-2017-4-Spenkelink-03-klein

Figure 3. Creating a DLT IT maturity model.

Figure 3 depicts the steps to arrive at the maturity model. The sub-risks have been identified for each of the eight DLT risk areas detailed in Figure 1. The next step was translating each of these sub-risks into maturity self-assessment questions. In order to keep this article brief we have included a small part of the maturity model in the section below.

Area: access and user management
1. Unauthorized access of participants

Within Permissioned DLTs network the risk of unauthorized access still exist. Because at this moment every participant can grant new members access to the network, it is possible that unauthorized/untrusted parties will gain access.

2. Users are not uniquely identifiable

DLT uses unique addresses which are assigned to each participant in the network. This address is used for transactions (sending and receiving) and enables participants to authenticate themselves and these transactions by using a public key.

The provisioning process of these key-pairs (unique identifier) and assigning access rights is different for each DLT implementation. Due to the fact that DLT heavily relies on digital identity this means that adequate management and security around the process of providing and storing the cryptographic keys is of great importance.

3. Authentication mechanisms are not working

The DLT mechanism relies on unique addresses that are assigned to each member, which are used for sending/receiving and authenticating transactions via a PKI infrastructure. Inadequate authentication mechanisms could result in authentication risks and being unable to correctly authenticate counterparties and existence of assets ([Berk17], [Lage16], [Walc15]).

Based on the three risks found for the access and user management area, for this study the overall risks measurement scales developed by NIST 800-53 [NIST13], OWASP [OWASP08] and COBIT [Hard08], [ISACA09] were adapted to measure the maturity level. The table below summarizes the maturity self-assessment questions for sub-risk ‘Unauthorized access of participants’ of the access and user management area.

C-2017-4-Spenkelink-t02-klein

Table 2. Risk area: access and user management.

Case study – What did we learn?

After validation of the model with IT risk managers, DLT experts and developers, the model was tested against a real life DLT use case at the Rabobank.

Rabobank group

Rabobank is a multinational cooperative bank and the second largest financial service provider in the Netherlands, serving over ten million customers worldwide. It is the leading financial service provider worldwide in the agri-food (wholesale, rural and retail) business, and is especially active in banking, lending, bank assurance and factoring within this sector.

Like many banks, the Rabobank is looking at DLT and is taking steps to explore the possibilities of this new technology. This provides a good opportunity to test the DLT maturity model against a high impact blockchain project.

While the specific details of this use case cannot be shared publicly, some overall conclusions of applying the blockchain maturity model can be given.

The entire DLT landscape is still very much in development. An often used DLT platform for example is Hyperledger Fabric. This platform has only been in a stable version 1.0 since July 2017 (one month before conducting this case study). It became apparent that when implementing a DLT platform the focus is on getting this platform up and running as quickly as possible, which leads certain risk areas getting more attention and with others to be resolved at a later time.

During the interview it was noted that many of the maturity indicators were steps that Rabobank was thinking of implementing, but that were not implemented at that moment in time.

The Rabobank commented that the maturity model provided concrete pointers as to which areas to focus on and how to improve their maturity. The framework clearly shows which areas are lacking in IT risk maturity, thereby helping to focus on improving the areas that need it the most.

In conclusion

A DLT enables multiple parties in a value chain to work together and share data and processes very efficiently. This reduces administrative work, reduces the risk of fraud by creating an audit trail of transactions and enables the automation of common business processes with the use of smart contracts. However, due to the nature of a DLT system, implementation also introduces new and specific risks that do not exist in current financial transaction processing systems. This is because a DLT system is an interconnected system in which multiple parties cooperate and share data, combined with the fact that all transactions logged on this system are irreversible.

The literature study shows that most IT risks associated with DLT need a different approach than more ‘traditional’ IT risks. The challenge for financial services firms that want to use DLT is therefore to convert these IT risks into mitigating procedures that eliminate these risks. In addition, it is concluded that the necessary steps must be taken before DLT can replace existing technologies.

By combining an IT risk maturity model with DLT specific risks as found in the current literature, a maturity model can be created to measure DLT IT risk maturity. This enables the user of the framework to assess maturity and give specific and prioritized recommendations tailored to the situation.

The case study shows the value of having a DLT maturity assessment, as it can help not only by giving an impression of the current state, but it also helps to create a well-founded and prioritized action plan to improve maturity levels. The overall conclusion is that DLT is still a very immature technology and more research will have to be performed about keeping control over a DLT system and making sure that all IT risks are properly dealt with.

Visit our website for more information about the KPMG Blockchain Maturity Model: https://home.kpmg.com/nl/en/home/insights/2017/12/blockchain-maturity-model.html

References

[Beck10] J. Becker, B. Niehaves, J. Pöppelbuß, A. Simons, Maturity Models in IS Research, ECIS 2010 Proceedings, http://aisel.aisnet.org/ecis2010/42/, 2010.

[Berk17] A. Berke, How Safe Are Blockchains? It Depends., Harvard Business Review, https://hbr.org/2017/03/how-safe-are-blockchains-it-depends, 2017.

[Hard08] G. Hardy, J. Heschl, J. Clinch, Aligning COBIT, ITIL V3 and ISO/ICE 270002 for Business Benefit. A Management Briefing from ITGI and OGC, ISACA.org, http://www.isaca.org/Knowledge-Center/Research/Documents/Aligning-COBIT-ITIL-V3-ISO27002-for-Business-Benefit_res_Eng_1108.pdf, 2008.

[ISACA09] ISACA, The Risk IT Framework, ISACA.org, http://www.isaca.org/Knowledge-Center/Research/Documents/Risk-IT-Framework-Excerpt_fmk_Eng_0109.pdf, 2009.

[Lage16] P. Lageschulte, M. Krajecki, M. Sokalski, K. Nagaraj, Missing link – navigating the disruption risks of blockchain, KPMG, https://advisory.kpmg.us/insights/2016/09/navigating-blockchain.html, 2016.

[NIST13] NIST, Security and Privacy Controls for Federal Information Systems and Organizations, Joint Task Force Transformation Initiative, NIST Special Publication 800-53, Revision 4, http://nvlpubs.nist.gov/nistpubs/SpecialPublications/NIST.SP.800-53r4.pdf, 2016.

[OWASP08] OWASP, OWASP Testing Guide, OWASP.org, https://www.owasp.org/images/5/56/OWASP_Testing_Guide_v3.pdf, 2008.

[Rose05] M. Rosemann, T. Bruin, Towards a Business Process Management Maturity Model, ECIS 2005 Proceedings, http://aisel.aisnet.org/ecis2005/37, 2005.

[Spen16] H. Spenkelink, G. Hough, Blockchain: from hype to realistic expectations, Compact 2016-4, https://www.compact.nl/articles/blockchain/, 2016.

[Walc15] A. Walch, The Bitcoin Blockchain as Financial Market Infrastructure: A Consideration of Operational Risk, Legislation and Public Policy, nr. 18, p. 837-894, https://www.academia.edu/18602560/The_Bitcoin_Blockchain_as_Financial_Market_Infrastructure_A_Consideration_of_Operational_Risk, 2015.

Autonomous compliance

Many of us are unaware how early twentieth century technology works. We stick a plug into a socket, switch on the television or radio and pictures and sounds are picked up by our senses as if by magic. The end of this analog era started when digital technology in the form of computers was developed to assist us to find answers to complex, mostly military questions. The internet was a direct consequence of further research in this area during the 1960s leading to omnipresent connectivity at the beginning of the twenty-first century. Even the latest technological paradigm shift, autonomous systems, was initiated by the air force in their quest to deploy unmanned drones instead of humans in jets.

However, autonomous systems are currently being pushed forward by commerce and regulations. With autonomous systems, we let go of direct control in order to benefit from a system that can handle high volumes of complex information both efficiently and effectively. Autonomous systems are no longer tools handled by people; decisions and actions are taken without direct human interference or intervention. Their applicability to the compliance domain is easy to spot. Instead of us making sure systems comply to our rules, autonomous compliance systems make sure humans obey.

Introduction

Brian Chin, chief executive for global markets at Credit Suisse, stated in June 2017 that the bank was deploying twenty robots, some of which were to help employees answer basic compliance questions ([Oran17]). Mr. Chin said: ‘You ask it questions and it spits out the appropriate regulation, rather than going to a manual or a website.’ Credit Suisse expects that this chatbot technology will reduce the number of calls to the compliance call center by fifty percent. However, reducing costs cannot be the only reason for the Swiss bank to deploy chatbots. Credit Suisse received regulatory related fines totaling $ 5.3 billion in 2016 ([JUNI2017]), thereby coming eighth in the global banking fines league of that year. The introduction of chatbots will probably reduce mistakes and thus fines also.

Talking about fines and bots, Joshua Browder, a student at Stanford University, developed the ‘DoNotPay’ chatbot in 2016. This bot helped to overturn more than 200,000 parking fines in London and New York. Joshua introduced a new version of the bot in 2017. This time the bot helps refugees with immigration applications in the US and Canada, and asylum support applications in the UK ([Good17]).

The above two cases both describe autonomous systems in the form of chatbots. Chatbots engage users in ‘human-like’ conversations, have the knowledge to answer their queries and make recommendations. The examples show that the use of autonomous technology within the legal, risk or compliance space is ready for deployment. The application of autonomous technology is the focus of this article. It will explain the concepts of Robot Process Automation (RPA) and Artificial Intelligence (AI); link these to capabilities such as Natural Language Processing (NLP) and knowledge management; include an indication of the current maturity and availability of these capabilities and sketch the deployment of RPA and AI technology in the regulatory domain. But we shall begin by stating what the tasks of a compliance officer are all about.

Regulatory compliance – responsibilities and tasks

All European regulations for financial companies contain organizational requirements for a compliance function. In general, such a function is responsible for the following tasks:

  • monitor regulatory effectiveness;
  • report on regulatory effectiveness;
  • tackle deficiencies in regulatory effectiveness;
  • advise and assist staff in complying with regulations.

This means that the regulatory function must identify, assess, advise, monitor and report on the company’s compliance risk. Unfortunately there are many pains that a compliance officer encounters when carrying out these tasks (see Figure 1 on regulatory pains).

C-2017-4-Slagter-01-klein

Figure 1. Regulatory pains.

The most important pain is the risk of non-compliance. The sheer regulatory volume requires access to ample financial and human resources to control this risk. Nevertheless, even if a company has access to these resources it may still find itself on the wrong side of the law. This is due to the complexity and interconnectedness that is inherent in today’s regulations. Therefore, the smart deployment of technology, which is specifically developed to counter these regulatory pains, is essential to retain control, limit regulatory risk and address regulatory and compliance requirements, both effectively and efficiently.

Autonomous Compliance System

An autonomous system is one that tries to fulfill a set of goals in a complex, dynamic ‘environment’. It can ‘sense’ the environment through its ‘sensors’ and act upon it using its ‘actuators’, e.g. a robot uses a camera as its sensor and a robotic arm as its actuator ([Maes93]).

The environment of an autonomous compliance system could be described as the regulatory and industry standards domain on the one hand and the company business and operational domain on the other. The sensors of autonomous compliance systems are software capabilities that range from Natural Language Processing (NLP), knowledge management and biometric systems, all of which use data gathered via interfaces, through to actual documents that contain regulatory and industry standards and to documents and (business and biometric) systems that contain information about the company business and operating domain.

A system is called autonomous if it decides for itself how it uses its ‘sensor’ data to initiate actions in such a way that its goals are met successfully. As such, predictive analytics is an essential capability to develop an autonomous system. All the above capabilities are currently available due to advances in AI (see Figure 2). In order to be fully autonomous, a compliance system should cover all four phases of the regulatory lifecycle: 1) regulatory insight and impact, 2) regulatory assessment, 3) regulatory implementation and 4) regulatory compliance monitoring and optimization ([Vost17]), and be able to adapt to short-term and long-term changes in its environment ([Maes93]). Again, the self-learning capability is now available when using AI.

RegTech – RPA and AI

Much has been written about RegTech and its use within the compliance space. Overall, two types of technologies currently dominate this domain for regulation: Robotic Process Automation (RPA) and Artificial Intelligence (AI).

RPA is used to automate steps of regulatory processes utilizing scripting capabilities and using tooling to access and manipulate structured or semi-structured data. The strength of RPA is the flexibility and unobtrusiveness of the toolset used.

AI is a suite of technologies that distinguishes itself by its ability to recognize patterns from structured and unstructured data based on accuracy and confidence ratings/weightings, a generic capability that was until recently limited to biological brains only. Where RPA brings efficient automation, AI introduces a completely new way of tackling problems. An example of an AI technology is Cognitive Intelligence, i.e. algorithms that mimic the function of the (biological) brain by using weightings to discover structure and abstractions. Cognitive Intelligence has only now become possible due to virtualization techniques that permit access to potentially unlimited processing and storage capacity. With an AI technology such as Cognitive Intelligence, problems can be solved that previously seemed too complex, too big, too volatile or too incomprehensible for either a human to tackle, or for an IT system to capture in pure code. In addition, AI technology has the means to train itself and improve over time. Thus AI technology provides the means to develop adaptive autonomous systems (see the box on the Autonomous Compliance System).

C-2017-4-Slagter-02-klein

Figure 2. From automation to autonomous systems.

AI can be applied to many generic areas, such as biometrics, Natural Language Processing (NLP), knowledge management and predictive analytics (see Figure 2). In combination, these capabilities make autonomous compliance a possibility.

The application of RegTech

The world of online commerce thrives because of continuous improvements in technology. These improvements enable companies to provide their clients with tailored information about relevant products and services based on a client’s current and past behavior, their location, and their past, current and future financial situation, while taking into account cultural and economic trends. It is important to retain the right clients, clients aligned to the business strategy of the company. Technology is deployed by these companies to ultimately recommend their products and services, prescribing the client’s behavior.

C-2017-4-Slagter-03-klein

Figure 3. RPA & AI usage within the regulatory lifecycle.

The tools and solutions of online commerce can be deployed equally successfully to regulatory compliance, e.g. using the concept of recommendations to assure conformity to rules and standards. Using the ‘regulatory lifecycle’ introduced in the previous RegTech article [Vost17], compliance solutions can be categorized into four sub-domains: 1) regulatory insight and impact, 2) regulatory assessment, 3) regulatory implementation and 4) regulatory compliance monitoring and optimization (see Figure 3 on RPA & AI usage within the regulatory lifecycle). The following sections show the use for each sub-domain.

Providers and solutions to support the ‘regulatory insight and impact’ sub-domain are available. Such providers typically offer regulatory content on a subscription basis whereby the user can select the scope and detail of the regulation and decide who should receive this information. Often providers generate additional data, such as a concise overview of the new regulation or changes in question. When deciding what regulation is relevant to the user, a provider can use either dynamic roles or fixed ones, such as: investment firm, payment provider, credit institution, etc. The application of AI within this area is very promising. For example, AI can play an important role in determining who needs to be notified based on the results of users who either accept or reject notifications. Alternatively, AI in combination with Natural Language Processing (NLP) can be used to analyze the regulatory changes themselves in order to determine the target group. Regulation can also be analyzed to determine references to other rules. More information regarding technical and non-technical pains and solutions specific to accessing regulation can be found in the first RegTech article [Vost17].

Typical solutions related to ‘regulatory compliance monitoring and optimization’ are collectively known as GRC (Governance, Risk & Control) systems. In general, GRC systems provide functionality to define regulatory, domain and company specific risks, link these risks to a control framework and assess and report on the effectiveness of the controls. GRC systems have been around for the last ten to fifteen years. Potentially, GRC systems allow the automation of monitoring. However, the dynamics of the compliance environment causes maintainability issues. Furthermore, the ability to conduct surveys to assess effectiveness is often complicated and requires coding expertise. GRC tooling has been the subject of many Compact publications, e.g. ‘Trending topics in GRC tooling’ [Lamb17]. If a GRC system provides no support to conduct a survey to assess the effectiveness, RPA can be used to automate this process in a standard manner, allowing for efficient analysis of the standardized, available responses.

Unfortunately, there are currently few systems that support the automation of the ‘regulatory assessment’ sub-domain. This is extraordinary, as this particular process lends itself very well to the ecommerce and technological concepts described in the previous section. Typically, the detailed assessment of a regulatory change is carried out according to the following steps: 1) identify scope and applicability, 2) identify the impact areas due to the applicable requirements, 3) identify the gap between the ‘current state’ of the impact areas and the applicable requirements, 4) determine the ‘target state’ to comply with the requirements, 5) define an implementation plan to develop and implement the ‘target state’.

C-2017-4-Slagter-04-klein

Figure 4. Regulatory assessment steps.

When assessing the impact and corresponding gap due to a regulatory change, there are specific requirements: a regulatory library that supports the change/version management, an ability to view and navigate within and across all documents, and support to determine the scope, applicability and impact of the regulation. Ideally, tooling has access to the current state of the target in scope and the means to assess the gap with respect to the applicable regulation. The online concepts and AI capabilities introduced previously can be used in different ways.

Applicability, impact and gap could be determined by using the concept of recommendations, whereby the system analyzes both the regulation and the target areas of the company in scope. By using the Knowledge Base features in combination with NLP functionality the system may analyze differences/similarities autonomously between requirement and target. For example, governance and organizational regulatory requirements could be compared with current company documentation describing the current governance and organizational model. Similarly, any overlap and changes between regulatory obligations and specific company policies may be assessed automatically.

The scope of the final sub-domain within the regulatory life-cycle ‘regulatory assessment’ is very broad. Within this sub-domain one can gather all applications that support typical regulatory obligations, such as: client onboarding, reporting, surveillance, modeling/forecasting, decision making and awareness (see Figure 5 on regulatory implementation point solutions).

C-2017-4-Slagter-05-klein

Figure 5. Regulatory implementation point solutions.

The chat bots discussed during the introduction of this article are a good example how ‘awareness’ of company staff and clients can be supported by technology. Surveillance is also a recurring regulatory obligation, be it surveillance to detect market abuse, money laundering or the behavior of staff in general. Conventional surveillance tools identify positives using set/pre-configured suspicious practices. The use of AI and its ability to analyze unstructured data and learn from experience, will enhance the effectiveness of the surveillance tooling and reduce the number of false positives. If a positive must be followed up, the process to do so can be automated using RPA. The other sub-domains within ‘regulatory implementation’ can benefit in a similar way.

Availability of RegTech capabilities

There are of course many vendors that provide applications within the regulatory space, particularly within the ‘regulatory implementation – point solution’ domain. However, as the above sections show, not all areas are equally well served by the market. As such, a company may look at the development of bespoke solutions to develop either their own chatbot or assessment tool. Fortunately, AI technologies/capabilities are widely available ([Hafe17]). See Figure 6 on AI availability in the cloud.

C-2017-4-Slagter-06-klein

Figure 6. AI availability in the cloud.

All major market players offer access to a wide range of AI capabilities. Especially Microsoft seems to provide a broad choice of features. However, platforms like IBM Watson also offer a good choice. This was, for example, the choice of Joshua Browder, the developer of the autonomous ‘DoNotPay’ chatbot. However, it should be understood that most of the vendor applications and bespoke applications are mainly developed using ‘conventional’ technology, with AI technology as a unique selling point, but not always the deciding enabler.

Conclusion

Autonomous applications are currently deployed within the compliance space. Although it is early days, the promise of automated, autonomous systems that allow companies to be in-control and compliant is already here. Not all areas are covered as yet. However, a green field operation would benefit tremendously if it could achieve full automation of its monitoring, reporting and effectiveness testing. Furthermore, by using tooling to assess the actual regulatory changes, the quality and costs of this exercise would improve. The compliance officer is here to stay, but the question remains in what capacity: human or digital?

References

[Good17] Joanna Goodman, Legal technology: the rise of the chatbots, The Law Society Gazette, 20 March 2017.

[Hafe17] Thomas Hafen, Cloud Dienste erleichtern KI-Einstieg, COM! Professional, 1 September 2017.

[JUNI17] Juniper, How RegTech can save banks billions, Juniper Research, 2017.

[Lamb17] G.J.L. Lamberiks, I.S. de Wit, S.J. Wouterse, Trending topics in GRC tooling, Compact 2017/3, https://www.compact.nl/articles/trending-topics-in-grc-tooling/, 2017.

[Maes93] Pattie Maes, Modeling adaptive autonomous agents, Artificial Life (Volume 1, Issue 1-2), MIT Media Laboratory, 1993.

[Oran17] Olivia Oran, Credit Suisse has deployed 20 robots within bank, markets CEO says, Reuters, 2 May 2017.

[Vost17] Rob Voster, Closing the circle. Will RegTech digitize regulation?, Compact 2017/2, https://www.compact.nl/en/articles/regtech-closing-the-circle/, 2017.