
How to become data literate and support a data-driven culture

Despite the growing possibilities to collect, store, report and analyze data, organizations still struggle to transform their businesses. Business value needs to be unlocked from data; businesses need to address their growth, risk and cost strategies to truly enable employees and create the fundamental value they need to ‘talk’ data and become more data-literate.

Introduction

Digital transformation is the name of the game these days for many organizations. This is founded in a wide and impressive range of new (information and communication) technologies that have a growing impact on business outcomes ([John18]). Data, analytics, intelligent automation and artificial intelligence have become more mature and are fundamental to the current age of digital transformation. The creation of a data-driven culture helps drive these successful business outcomes.

However, while most organizations focus on the potential of data-driven technologies (like data lakes, data platforms and incorporating artificial intelligence or machine learning), the technologies must be carefully cultivated to become a trusted core capability. Real value often only comes with scalability, repeatability and effective deployment, where algorithms are used to enable humans and data-driven technologies are embedded into organizations’ day-to-day business. To truly enable people, they need to have a better understanding of the insights data provide using analytics, and how it can improve the way they work. Data needs to become a native language; people need to ‘talk’ data and become more data-literate. Data literacy – the ability to understand, engage, analyze and reason with data – is a key factor for successfully implementing a data-driven culture within an organization.

Data Literacy

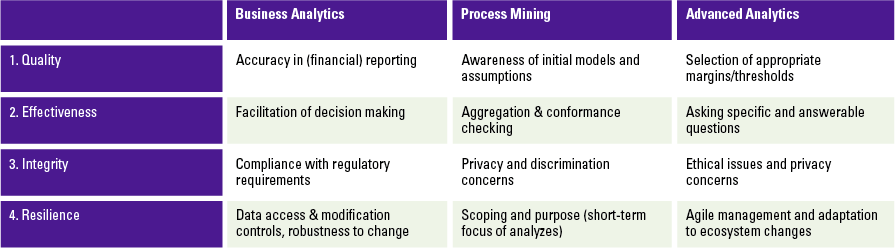
The urge of organizations to use data within their organization is built on the fact that enormous amounts of data are available, which can create valuable insights. While organizations are starting to use advanced analytics and are exploring the power of machine learning and artificial intelligence, they are still struggling with successfully implementing solutions in their day-to-day business. This is not due to technical limitations since developments and innovation in the data analytics field come at a tremendous pace. It is because there is a gap between data experts or analytical specialists, and the business users that need to understand the analysis and turn it into business insights, actions and ultimately value. This gap can be filled by further educating the organization on the concept of data as fuel for the analytics that give the insights to improve the work, and by educating the data experts on the business implications of analytics. All hierarchical layers within an organization need to have at least a basic understanding of the concept of data, and they need to be able to understand and engage with data fitting their role and start talking the language of data. Making business decisions based on gut feeling is a thing of the past; acting upon solid factual data needs to become the company-wide standard. This requires an organization to elevate on the four cornerstones of data literacy – understand, engage, analyze and reason with data (Figure 1).

C-2018-4-Lambers-01-klein

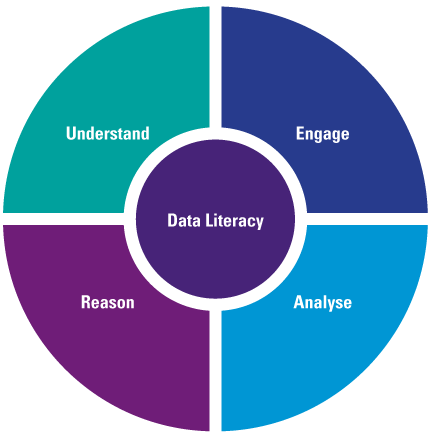
Figure 1. Four cornerstones of Data Literacy. [Click on the image for a larger image]

Understand

In order to start working with data, you need to be able to understand the data. Data is usually presented in various forms within an organization, such as a bar chart, pie chart, table or pivot. A user should be able to understand what is presented in the graph. What does the data tell us? Which insights can be derived from it? What is the impact on business processes? It also requires critical thinking about the presented data. For example, let’s consider an interest rate dataset with the interest rate per year. Visualizing the data in a bar chart can give a good overview of the increase or decrease of the interest rate over the years. However, with a wrongly chosen scale size, the visualization can suggest that there is a large increase of the interest rate. When we closely look at the scale size, we see that the actual difference in years is minimal (Figure 2).

C-2018-4-Lambers-02-kleni

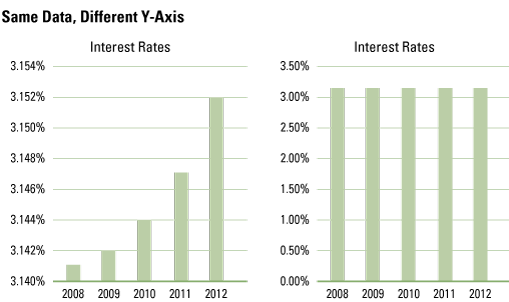
Figure 2. Example of a bar chart visualization with misleading scale size (left).

Next to understanding the visualization, we often see that organizations struggle to understand the insight. When the organization was asked if the progressive line on the interest rate had a positive or negative effect for the organization, they were not able to answer. Fully understanding the data also requires not taking the data for granted and being able to critically think about the visualizations and analysis shown.

Engage

To engage with the data, people need to use data and know what is available within the dataset. This includes knowing how the data is composed; understanding the type of data; where it originates from and who is using it. Answering these questions will help understand the data and its context. A first step is to look at the data definitions or define them when not available. Using data definitions, you can establish the type of data fields and the expected values. This closely relates to data management, where large datasets definitions and characteristics of fields are defined within a data catalog. Engaging with the definitions helps understand the data. Another aspect that better helps engaging with the data is finding out or knowing who the data consumers and data producers are. Knowing who created the data will give you a perspective of what should be represented and with what perspective the creator created the dataset. Imagine a business controller who needs to create a guiding report for the organization: if there is a mere focus on the look and feel of the graphs, while understanding the dataset at hand is ignored, it could result in wrongly chosen data elements, or critically incomplete information.

Analyze

Inevitably, the skillset to analyze a dataset is an important step in becoming more data-literate. Understanding data and being able to engage with data helps in starting discussions and shifting from creating information to creating insights and ultimately concrete business actions. These insights can only be generated by analyzing the data. Being able to use statistical and analytical methodologies to create valuable insights will become a skill that is necessary for more and more (business) roles within an organization. With the world becoming more data centered and data savvy, organizations and departments will not solely rely on data scientists providing useful analyses. Creating valuable insights from a given dataset and analyzing the data is becoming more and more a combination between technical skills and business knowledge. The analytics and business perspective will converge further. A data scientist is not able to create business insights if he is not comfortable with the business perspective. On the other hand, business users need to have a certain level of understanding of analytics in order to work together with a data scientist and comprehend their approach on analyzing a dataset for a specific business purpose. This doesn’t imply that a business user needs to deep-dive into algorithms used or become an expert in data analytics, but it does require a business environment with a high level of trust in the insights provided by the black box of analytics ([Pato17]). You also don’t have to be an engineer to drive the most technical enhanced car, but you should trust it.

Reason

One of the most important, and complex, aspects of data literacy is the ability to reason with data. Understanding and analyzing data is important, but if you cannot talk the language of data or reason with data in a proper way, misalignment or misunderstanding will take place. Communicating with data can be done verbally but also by showing visualizations. The power of a good visualization is often underestimated, especially because a chart can perfectly support your story or emphasize the point you’re trying to make. Telling the right story and guiding your audience through the steps you have followed within an analysis will clarify your results and create a starting point to discuss the impact of the results. When doing this, always consider the level of data literacy of your audience, to ensure you send a clear message that can be understood by everyone.

Levels of Data Literacy

Becoming data literate is important, but the required proficiency depends on the data role of the business user. According to Gartner [Loga17] there are five levels of proficiency in data literacy: conversational, literacy, competency, fluency and multilingual (Table 1).

C-2018-4-Lambers-t01-klein

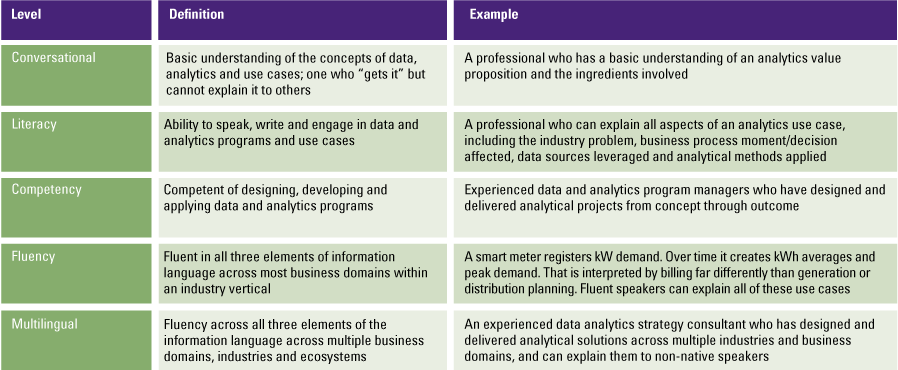
Table 1. Gartner’s Data Literacy levels of proficiency. [Click on the image for a larger image]

Although it would be helpful if your entire organization is multilingual, it is not a necessity. For example, a business controller will not write complex statistical models, but should be able to understand and interpret analyses done by data experts. The different levels of proficiency strongly relate to the four cornerstones of data literacy (understand, engage, analyze and reason), where the cornerstones overlap usually two levels of proficiency. People on a conversational level will focus on reading and understanding data. They can have basic understanding of the analytics done, but aren’t able (yet) to communicate or explain these results clearly to others. People with a higher competency level are more focused on analyzing and reasoning with data. They have the skillset to perform advanced analytics and make sense of a given dataset, but still may lack profound communication skills. Finally, people with a multilingual level of proficiency cover the entire spectrum of data literacy, but do not have to be an expert at every level. They have solid communication skills, analytical capabilities and understand and interpret the data effortlessly.

Data Roles

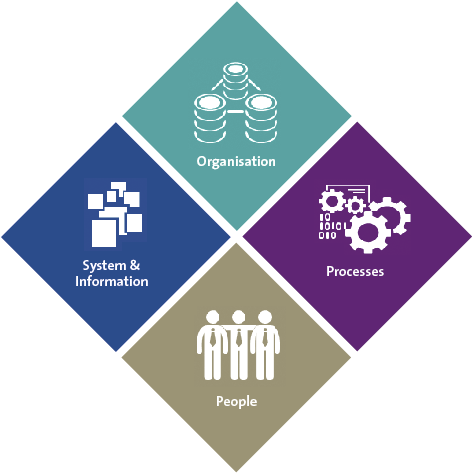
Data roles define the different data personalities which exist within the organization. Organizations are made up of different people with different backgrounds, interests, intrinsic motivation and organizational focus areas. To become data-driven, the organization needs to focus more on data and create a culture where data literacy is embraced. The culture is a key to ensure championship, stewardship and change. KPMG defines four data roles for the business users, with different data skills, capabilities and learning requirements (Figure 3).

C-2018-4-Lambers-03-klein

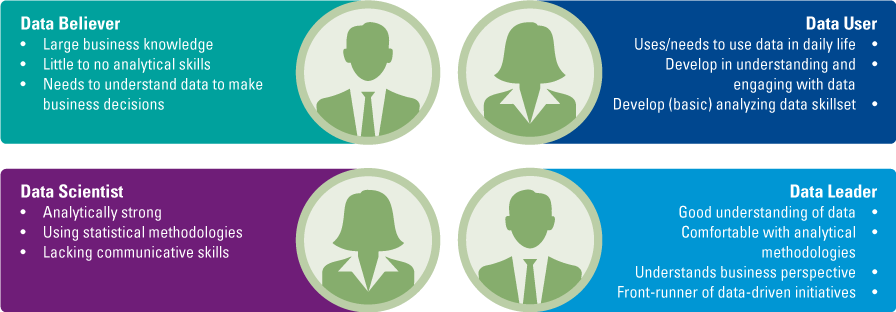
Figure 3. Four data roles within a data-driven organization. [Click on the image for a larger image]

Data Believer

Data believers are people with limited to no analytical knowledge, but need to understand and engage with data in order to make business decisions. These are typically people that have extensive business knowledge, but little analytical capabilities, such as C-level or management. The mindset of a data believer needs to change from making decisions based on gut feeling to making decisions based on data analysis. To achieve this, it is vital to understand the data and steps performed within an analysis. Be aware that you sometimes need to convince people of the power of data in order to turn them into data believers and letting them see the added value of data.

Data User

Data users need to incorporate data and analyses in their daily work. These people need to be able to understand and engage with the data, like business controllers of process owners. Important for them is that they know what’s in the dataset, understand where the data is coming from and the insights that can be derived. Generally, the analytical capabilities are very basic and need to be developed to a proper level. Although the data user doesn’t need to be as technical as a data scientist, understanding analyses and more complex methodologies is important.

Data Scientist

These are typically the data gurus who have profound analytical and statistical skills, such as data scientists or data analysts. Generally, no further development is required in the area of analytical and statistical methodologies. The focus areas for a data scientist would be to improve on communicating, explaining and reasoning with data regarding business users in order to reach a level of data fluency or even multilingualism. Implementations of their (advanced) analytical methodologies strongly depends on the capabilities of a data scientist to explain and show their analysis results to business people (for example data believers) and give useful insights.

Data Leader

Data leaders have a good understanding of the data, can interpret results or analyses and have a good level of understanding analytical methodologies. You can think of business analysts, information analysts or BI specialists. Data leaders are the front runners of data literacy within your organization. They see the added value of using analytics in day-to-day business and understand the impact of an analysis. A data leader doesn’t need to have the same level of analytical skills as a data scientist, but is required to be able to apply some analytical methodologies on his own. Furthermore, the data leader needs to be able to communicate, discuss and reason with the data. Data leaders need to understand the complexity of the analysis and follow the steps and then translate them to business users with more limited analytical knowledge.

The four data roles also strongly relate to the previously introduced levels of proficiency (Figure 4). Although all employees are expected to talk the language of data, a data believer will focus on a conversational level, while a data leader needs to have the capabilities to talk data fluently.

C-2018-4-Lambers-04-klein

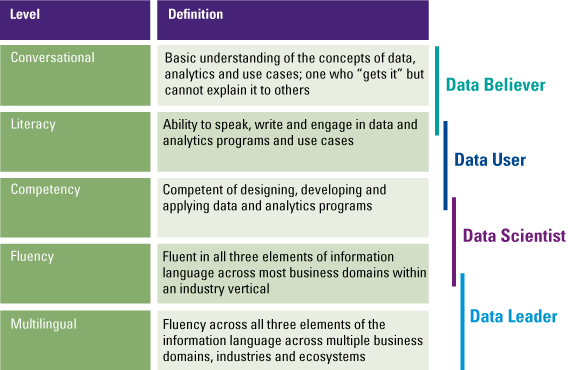
Figure 4. Relation between levels of data literacy levels of proficiency and data roles. [Click on the image for a larger image]

How to become data-literate

The key question for organizations now is on how to become more data-literate and support the creation of a data-driven culture. A data-driven culture determines how an organisation operates and gets things done with data, as an answer to internal and external challenges. While cultures in organizations are usually focused on creating a certain mindset and daily work, the technicalities of data also require an individual capability improvement based on the data roles to gain the required level of data literacy. Becoming data literate is merely an organizational exercise, but with implications on technical capabilities. KPMG’s global Behavioral Change Management (BCM) methodology [KPMG16] provides a step-by-step process for culture change programs to support becoming more data literate.

C-2018-4-Lambers-05-klein

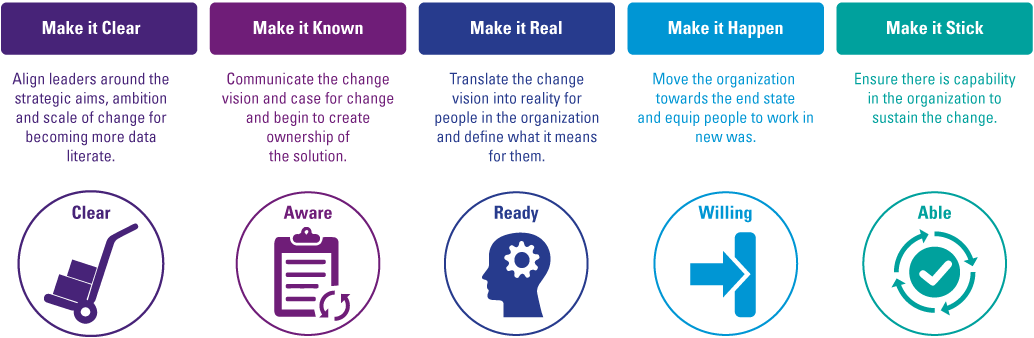
Figure 5. KPMG’s global Behavioral Change Management (BCM) methodology. [Click on the image for a larger image]

The methodology starts with clarifying – in business goals and objectives – why becoming more data literate is important. We see most organizations in the market ground establish the objectives of becoming more data literate regarding the current digital transformation and evolvement of data-driven cultures, with strong (technical) developments in big data, machine learning, augmented and artificial intelligence. Leadership should be aligned with a common ambition that is focused on what can be achieved with data literacy, the expected levels of data proficiency specified for the functions within the organization and how these impacts required behavior and ways of working. The ambition needs to be communicated top-down and people need to be engaged with data literacy. This is a perfect moment to identify the front runners (data leaders in your organization) and create ownership of the cultural change plan.

After creating understanding and awareness in the organization, the change plan needs to be translated into reality for people. Define and communicate the expected level of proficiency and data role per person, the practical implications of the change, and what is expected from people in this process. Actions and specific behaviors for people are defined and monitored as well. As mentioned before, next to implementing the cultural change, people also need to develop their technical capabilities based on their data role within the business. At this point in time you define the development and capability improvement for the people based on their proposed data role. The start is to map people with the different roles of data literacy, in order to adapt the development plan accordingly.

The next step is to facilitate the change and move the organization to the desired end state of data literacy proficiency levels by implementing the practical changes. With the help of the right triggers, tools, training and workshops an enabling environment focused on becoming more data literate is created. The result of this step is people understanding and working with data to support business decisions as a day-to-day activity, with a level of data literacy proficiency suitable for their data role within the organization.

The final step is to ensure that becoming and staying data literate sticks in the culture by continuously managing, communicating and monitoring the change in capabilities.

Conclusion

Shifting towards a data-driven organization, focused on supporting the digital transformation, requires a cultural change. To become data-driven, the organization needs to focus more on data and start using data in their day-to-day activities. Becoming data-literate will provide people with the necessary capabilities and change of mindset to incorporate data-driven initiatives. By defining your data roles, defining the expected levels of data literacy proficiency and designing your cultural change plan, your organization can start speaking data as a native language and will be ready to drive real impact in the digital transformation.

References

[John18] A. Johnson et al., How to build a strategy in a Digital World, Compact 2018/2, https://www.compact.nl/en/articles/how-to-build-a-strategy-in-a-digital-world/, 2018.

[KPMG16] KPMG, Behavioral Change Management (BCM) Method, KPMG, 2016.

[Loga17] Valerie Logan, Information as a second language: enabling Data Literacy for Digital Society, Gartner, https://www.gartner.com/doc/3602517/information-second-language-enabling-data, 2017.

[Pato17] J. Paton and M.A.P. op het Veld, Trusted Analytics, Compact 2017/2, https://www.compact.nl/articles/trusted-analytics/, 2017.

A special thanks goes to Chantal Dekker, Joris Roes and Ard van der Staaij for providing us with valuable input on cultural change management, performance management and data management.

Why not let the data do the talking?

Organizations have made great efforts to make their processes faster and leaner by ‘going digital’. Faxes have been replaced by emails, dossiers have moved from desk drawers to the cloud and paper forms have turned into iPads. Digitization has exponentially increased the volumes of unstructured data. The findability and accessibility of data is dependent on the metadata added at the source. Standardizing metadata controls is time-consuming and costly as it is difficult to tailor to the needs that arise from differences between processes, systems or even departments. Unstructured data ownership is often undefined ([Mart17]) and in turn, data is continuously created without defining who is responsible for its deletion. These issues lead to the creation of an unmanageable ocean of unstructured data. A smart data platform overcomes these issues by using text analytics to create automatic metadata-driven context around unstructured data sources.

C-2018-4-Jeurissen-t01-klein

Table 1. Terms & Definitions. [Click on the image for a larger image]

Introduction

Unstructured data plays a crucial role in business processes. When creating reports and overviews, manual data extracts are made and stored somewhere on a shared file server. When carrying out an inspection, a photo is made for evidence. When preparing for a meeting, emails are exchanged to create an agenda. Excel sheets, photos and emails are just a few examples of unstructured data. Over recent years, organizations have made great strides in digitizing processes, through systems, applications and even robotics. Digitization has led to the creation of even more data, moving away from traditional paper and electronic documents alone. Digital libraries now also include open text fields, emails, chats, videos, images, scripts, tweets and many more. When not effectively managed, these data types often hinder process efficiency objectives.

This article dives into the way a smart data platform employs text analytics to automate metadata creation for unstructured data, eliminating the need for controls at the source. It starts out by explaining the challenges that arise from unstructured data. It then goes on to explain how managing an organization’s digital library is different when there is no librarian, as opposed to a situation where the smart data platform takes on the role of the librarian. This is followed by a detailing of the benefits of a smart data platform implementation, namely: better data retrieval, retention and control. Then, the text analytics technologies used for metadata generation are discussed in more detail. Finally, the steps needed for the implementation and maintenance of a smart data platform are explained.

Unstructured data and its challenges

Unstructured data is hard to manage, because it is difficult to define what it contains, especially when dealing with large volumes. Without understanding what it contains, its relevance and value for business processes cannot be defined. Three main challenge arise from a lack of data management around unstructured data sources: ineffective data…

  1. retrieval;
  2. retention;
  3. control.

Data retrieval is challenging, because business users must often access data in inefficient ways. Take folder structures for example. Although folder structures can greatly help users to create structure for themselves, they are often indecipherable to anyone other than their creator. This is because it is hard for other users to understand the logic behind folder structures when only looking at folder names. Viewing what is stored inside folders takes up a lot of time. When data is found, a copy is often stored elsewhere to improve future findability. This behavior increases unnecessary storage costs even further. Even in scenarios where retention-worthy data has a designated space in an application, additional copies are stored elsewhere ‘just in case’. In turn, it is unclear which version is the last. The larger the size of the digital library, the more time employees spend looking for specific data they need to carry out business process activities.

Data retention and deletion is necessary from both a business and legal point of view. When data needs to be retained for legal purposes, and is no longer needed for daily operations, it should be moved to an archive. When data is no longer needed for daily business operations, and does not need be retained from a legal point of view, it should be deleted. This is often not the case, creating large amounts of redundant data in the digital library. Retention and deletion is challenging because of a lack of data ownership. Since no one is made responsible for deletion, data is stored longer than required. A folder for a specific contract could contain a hundred draft versions of that same contract. Retaining the folder may seem logical, but there is only one version of that contract that has true value. A lack of retention and deletion leads to the situation where the digital library becomes so large that deletion is perceived as impossible. This is due to the fear of accidently deleting something valuable. When dealing with large volumes, it is hard to link retention periods to specific data. Storing data without applying data retention rules leads to a failure to comply with laws and regulations around data privacy and data security. This is because it is challenging or even impossible to determine whether data retention periods have passed. Experience in the field shows that on average, more than 56% of digital libraries consist of redundant data.

The final challenge is data control. Since data is stored in numerous decentralized locations, there is no clear overview of what is available within the digital library, and where that data resides. As a result of continuously increasing volumes, data control becomes more challenging every day. Even when controls do exist, they cannot be carried out without knowing where data resides. Think of GDPR compliance for example: financial reports or customer service letters may contain personally identifiable information. This data must be deleted if its retention period has passed. Otherwise, authorizations to access the data need to be restricted to a need-to-know basis. However, due to the lack of insight, action cannot be taken. What’s more, it is often unclear who has access to what data. There is not enough tangible evidence to show data owner’s efforts with regards to data management. In turn, it is simply unclear whether departments do or do not control their data effectively.

All in all, these issues suggest the need for better management of unstructured data sources.

A digital library without a librarian

Imagine an organization as a digital library, where business users have taken the role of the authors and readers, but there is no librarian. All books are placed in bookshelves that define their genre, whether it is science fiction, history or romance. The bookshelves create structure, to make books findable. However, this does not work the way it was intended to. When an author writes a book about a historic hero, they define it as ‘adventure’, and create an adventure bookshelf for it. The author does not know that perhaps another author has already created an adventure bookshelf elsewhere. On top of that, the content of the author’s book is ambiguous. In fact, the book could be placed on two shelves and not just one. When looking for that new book about this historic hero, it is unclear whether the reader should look for ‘history’ or ‘adventure’. Sometimes, a reader is looking for something for which no bookshelf exists at all, such as a specific writing style or a type of imagery. All in all, readers are often left confused as where to look and find the books they are interested in. They ask fellow readers for help and eventually find what they are looking for, but they lose a lot of time in the process.

C-2018-4-Jeurissen-01-klein

Figure 1. How the smart data platform indexes the digital library. [Click on the image for a larger image]

The Smart Data Platform as the Librarian

Now imagine a digital library where the smart data platform takes up the role of the librarian. Instead of making authors place their own books on shelves, this is done automatically. The librarian takes the information provided by the authors, as well as the books’ actual contents to determine on which shelves the new book fits. This is done only after comparing the new book with all other books readily available in the library. Books are labeled based on their similarities, for example their writer, genre, language or even their writing style. What’s more, the librarian makes use of virtual bookshelves. So instead of making readers find books on one predefined set of shelves, the librarian can arrange the books in different sets of shelves. The librarian will always present books in a way that makes the most sense in the context relevant for the reader. That is, if the reader asks for genres, the books are arranged by genre. If the reader asks for languages, the books will be arranged by language.

In this metaphor, the books are unstructured data and the bookshelves are virtual buckets defined by metadata. Note that these are virtual buckets; data is not restricted to a single bucket. These buckets are defined by a combination of metadata fields. Different combinations of metadata fields make data presentable in numerous ways. With the smart data platform as the librarian, readers always find the books they are looking for.

Improving Data Retrieval

The smart data platform improves data retrieval in two ways: by making data fully searchable on content, and by making data accessible through numerous buckets. Data can also be accessed without using buckets, but purely by searching for specific content, because data is not bound to any bucket. A user’s authorizations on the platform are the same as in source systems. The platform reads access rights from connected systems and mirrors these authorizations in the platform. Since data is fully indexed, a user could remember one specific sentence from a fifty-page contract, type this into the search engine, and find it. Users can also search and find content by entering key words that make sense to them. If the user chooses to search for that contract by using the supplier name, they will then be presented with all data that contain information about that supplier. Instead of storing twenty copies of the same data in different locations, the same copy is stored in one location, and made accessible in twenty different ways. When searching for that specific contract, not only the specific Word document is shown as a result, but also the PDF version and all email communication related to that contract negotiation.

Improving Data Retention

The smart data platform facilitates data retention, as generated metadata can be used to make informed decisions about what to retain and delete. Data that needs to be retained from a legal point of view can be identified by the data class. There are specific laws about the retention of invoices, personnel dossiers and audit reports, for example. How long, from the moment of creation or formalization, should it be stored? For data classes with a formal status, retention is automated by having a periodic automatic deletion of all data that has exceeded its set retention period. For data that does not need to be retained for legal reasons, the platform helps with retention as well, by determining when it becomes subject to deletion. Data can be deleted not only based on its age, but also based on its content and/or how often this data is accessed. It is much easier to say ‘yes’ to the question ‘may this be deleted?’, when you understand the content and how often it is viewed by business users. The platform helps organizations automate retention rules through metadata.

Improving Control

The smart data platform helps regain control over the digital library, serving as a data management platform. Data control moves from being a purely IT storage cost-driven task to a business matter. Using the platform for data control provides four main benefits:

  1. The platform provides an overview of the entire digital library, as it can be connected to all digital sources. The platform provides technical and content insights into these sources through metadata. The platform contains modular dashboards that allow data owners to filter on these overviews, allowing them to answer specific questions. Think of checking how many new contracts were created in the past year, for example.
  2. It offers a method to automatically filter out unlawful data. Unlawful data could be a national security number in a marketing folder, or a copy of a customer’s passport in a public folder. Intelligent search queries and text analytics can be used to filter out this specific data. Not only does the platform provide a general overview of the digital library, it can also be used to ask extremely detailed questions. Think of finding financial overviews that contain bank account numbers, for example. To help with GDPR compliance, data privacy officers can be given authorizations to monitor the use of personally identifiable information. Unlawful data that should no longer be stored as mandated by policy can be marked for archiving or deletion.
  3. It gives clear insight into authorizations. A platform user can view all data they are allowed to see, without interfering with the source systems the data is extracted from. Authorizations are managed on a data level, instead of on a folder or application level, making specific content available to individuals who require access. Access rights are given in source systems, but can be monitored through the platform. This helps detect sensitive data sources too many users have access to, as well as users who have access to too many data sources. As multiple source systems can be connected to the platform, the platform gives insights into the entire organizational authorization structure.
  4. The platform makes data ownership tangible. Data owners are given read rights to data stored on their file shares and systems. They are made responsible for all data within their department ,and the platform offers clear insights into their data. Managers can report on the exact amounts of risks in terms of personally identifiable information, but also quantify business process output, in terms of the amount of customer letters or contracts created per period. The platform gives management something tangible to quantify their efforts, and KPIs can be based on these insights.

C-2018-4-Jeurissen-02-klein

Figure 2. Example of metadata-driven insights into the digital library. [Click on the image for a larger image]

Practical examples of how unstructured data influences business process efficiency

Without the smart data platform

Unstructured data created within the R&D department is the starting point for other organizational processes, including the sales department. The sales department needs access to R&D data, as it is required to create sales material and target customers. However, R&D and Sales are autonomous departments. They each use different systems between which no communication exists at all. So, when a new product is created, the parameters and details of the product are inserted in an Excel sheet and sent to the Sales department by email. The Sales department employs one person who manually enters the data from the Excel sheet into the Sales system. Sales often requires additional data for their processes, which is not entered into the Sales system, as it is not part of the Excel template. Sales representatives individually call their contacts within the R&D department to ask for additional data. R&D employees spend 25% of their time answering phone calls.

With the smart data platform

The Sales department searches for new product data in the smart data platform. They find all information that is known about the product. Search results are sorted by date, so they make use of the latest information. The R&D department is no longer hindered by the many phone calls from Sales. The employee in the Sales department who used to enter data manually, can use this time for more value adding tasks.

Without the smart data platform

Actuarial processes within large financial organizations are an unstructured data hazard. In order to make essential calculations needed for risk assessments and such, dozens of Excel spreadsheets travel through the organization by email. The reason these spreadsheets travel by email is because employees work from different storage locations their colleagues either do not have access to or do not understand due to their complex folder structures. Tracking the flows of data through these spreadsheets, many duplicate values and circular references are detected. To the point that if these numbers were to be integrated in one Excel sheet, most of the tabs would be redundant.

With the smart data platform

Spreadsheets no longer need to be sent by email, nor do employees lose time trying to understand complex folder structures, to determine where spreadsheets are stored. Spreadsheets are saved in one location, and access rights are given to all actuarial employees who need the spreadsheets for their work. The latest version is always shown at the top of search results. Other, similar calculations are also suggested as search results, to quickly identify duplication.

Without the smart data platform

Sometimes ‘going digital’ does not work out the way it was intended to. The system that employees need to use for their business activities does not work the way they would expect it to, or simply does not meet their requirements. An example is a company that has a limited amount of assets. Yet their system cannot generate one full overview of all these assets. Over the years, employees within the finance and control department have created a list that does provide this one overview. However, this list has grown immensely over the years, leading to an Excel file of 50 GB and a hundred tabs. It gets more serious than that even. Since the file is so large, employees cannot share it with each other through their business email. When they do want to share it, they turn to the use of their private email, which allows larger files to be sent across servers.

With the smart data platform

Instead of trying to create a full list of assets in a system that does not offer that functionality, a list is created and maintained in the smart platform. All data related to an asset is bundled around that asset, recognized by text analytics around the asset name and numeric identifier. The platform recognizes when a new asset is created, and automatically adds it to the list. The risk of a data leak is reduced, as the Excel file no longer needs to be sent by mail.

Metadata Generation in the Smart Data Platform

A smart data platform takes a different approach to metadata creation. Instead of entering it manually at the source, metadata is generated automatically using text analytics. The smart platform consists of an indexing functionality, which reads all connected data sources, and makes a mathematical representation of their content in the index. This mathematical representation determines what the unique characteristics of a data source are (e.g. the frequent and non-frequent terms), to map data in comparison to other data sources within the digital library. The indexer looks beyond applications and folders by extracting text from its source. Next to the indexation of content, the platform also collects all other technical metadata from source systems. For documents this could be the date last modified, the extension type and the file path. For images taken by a smartphone, this goes as far as to include the geolocation of the photo. The four main technologies that are used by the platform are regular expressions, pattern recognition, rule-based searches and classifications. These are explained in the following section.

C-2018-4-Jeurissen-03-klein

Figure 3. The text mining technologies used to identify specific data. [Click on the image for a larger image]

A regular expression is a sequence of characters that defines a search pattern. Regular expressions look for specific text strings. The mention of a specific text strings goes to great lengths in identifying valuable information. Think of searching for bank account numbers, telephone numbers, or product codes. If found, this information is automatically extracted and added as metadata.

Pattern recognition not only looks at the text, but also the spaces within data. This way, it can recognize data that complies with a standard format. This is often the case for records, such as contracts, letters and invoices. Records are data that must be retained, as mandated by policy, laws or regulations. Pattern recognition identifies data classes and adds this information as metadata.

Rule-based searches look for the presence of specific information, often in the form of a list of (master data) values. This list can either be uploaded once, or be generated by a connected structured system (e.g. CRM, HR, ERP). Master data from a CRM system can be employed to identify all data relating to a specific client or supplier. Master data from an HR system can be employed to identify all data relating to an employee or rejected applicant. Data is scanned on whether it contains one or more of these values. Depending on the result of the search, a specific metadata value is added in the platform.

Classifications group similar data. They are made based on a training set. This is a small set of the data that needs to be found within the digital library. Think of resumes, for example. The system is given a small group of resumes, and uses this training set to recognize the rest of the resumes. Classification is a key technology to automatically identify valuable data within large digital libraries.

Based on results of the analysis, data is automatically labeled with metadata, such as a data class; an audit report, customer letter or python script. Thanks to the metadata, users will no longer need to open and fully read data to understand its value and relevance.

Implementing a Smart Data Platform

A smart data platform implementation requires an enterprise data management implementation program that will take up several months, depending on the size of the digital library. The implementation program consists of two parts, a technical and an organizational program. The organizational program requires the creation of a data management policy, governance, data lifecycle processes, templates and controls, where these are not available yet. Governance includes the assignment of data ownership. The technical program consists of the installation and configuration of the platform.

The first step in the technical program is to use insights provided by the platform to get rid of redundant data. The platform uses text analytics to scan through all the data and create collections of redundant and valuable data.

Redundant data is classified by filtering out data that is no longer relevant from both a technical and business point of view. Examples of redundant data from a technical point of view are duplicate data, empty data or corrupt data. Examples of redundant from a business point of view are data from customers who have not been a customer for longer than seven years, data about an application that has been phased out, or draft versions of a document that has been formalized. Redundant data makes up most of the digital library, leaving a relatively small amount of valuable data after the initial clean up.

Next, valuable data is classified. This is done using the four technologies described earlier, in combination with business knowledge from the organization. That is, the platform determines which data appears frequently, and business users are asked to give that data a functional name. The result is a cleansed digital library that only contains relevant data, that complies with a minimum set of metadata requirements.

The platform contains metadata generation rules. The maintenance of these rules is responsibility assigned to data owners within the business. When business processes change, the data owner creates new (sets of) metadata rules to make sure new data has a place in the platform. The platform will generate suggestions for new metadata; these suggestions are validated by data owners. All metadata rules are centrally managed by data owners. Business users can also enrich existing metadata with their own search terms. The platform will use newly added user information to create new metadata rules, continuously offering new and improved ways to view and find data. In turn, the platform serves as a long-term mechanism that offers one central location, that users can use to find anything they may be looking for. Organizational choices regarding systems and tooling for business processes are independent of the functioning of the platform, as only the extraction of text is important, leaving the organization free to innovate with technological advancements. When the platform finds data that does not fit within predefined metadata, it will signal this to the relevant data owner. They are then able to create new metadata rules, or help the platform understand where the data belongs. The platform will learn from this information, and apply it to all future data that is added to the digital library.

Conclusion

Digital organizations use data to create new value and insights. The implementation of a smart data platform can greatly help with the digitization of an organization, as it extracts data from source systems and maps it in the digital library. Data management through a smart data platform creates great benefits for organizations; improved data retrieval, retention and control. Its implementation requires little effort, as it brings no major changes in the way of working employees have grown used to. The platform helps with the implementation of data ownership, by making efforts tangible through quantitative insights and reports. Further development of business logic through virtual bucket creation is carried out by users and data owners within the business, making data management a business-focused task. All new information fed to the platform is further applied and standardized through the platform’s text analytics capabilities. Many possibilities lie within the further development and automation of smart data platforms. An interesting application in the future would be to deploy such a platform on file servers containing data analytics scripts. Data scientists could search for specific algorithms or functions, to find other applications that could benefit the development of their own analyses. The modular design of the platform and such integration mechanisms ensures that organizations can adapt to any changing needs in the future.

Reference

[Mart17] N.L. Martijn and J.A.C. Tegelaar, It’s nothing personal, or is it?, Compact 17/1, https://www.compact.nl/articles/its-nothing-personal-or-is-it/, 2017.

Audit Analytics

The internal audit function plays an important role within the organization to monitor the effectiveness of internal control on various topics. In the current data-driven era we are living in, it will be hard to argue that internal control testing can be done effectively and efficiently by manual control testing and process reviews. Data analytics seems to be the right answer to gain an integral insight into the effectiveness of internal controls, and spot any anomalies in the data that may need to be addressed. Implementing data analytics (audit analytics) within the internal audit function is however not easily done. Especially international organizations with decentralized IT face challenges to successfully implement audit analytics. At Randstad we have experienced this rollercoaster ride, and would like to share our insights on which drivers for success can be identified when implementing audit analytics. In the market we see a large focus on technological aspects, but in practice we have experienced that technology might be the least of our concerns.

Data Analytics within the internal audit

The key benefits in performing data analytics within the internal audit function are predominantly:

  1. more efficiency in the audit execution;
  2. cover more ground in the audit executions;
  3. create more transparency and more basis for audit results/findings.

C-2018-4-Idema-01-klein

Figure 1. Classical internal audit control testing vs. control testing and data analytics. [Click on the image for a larger image]

Introduction: Audit Analytics, obvious benefits

As an example, we would like to ask you this question: what is the main topic during seminars, conferences concerning data analytics? What is most literature about? How is the education system (e.g. universities) responding?

Chances are your response will involve technology: you read about great tooling, data lakes, the need for you to recruit data analysts and, very important, you must do it all very quickly.

However, the biggest challenge is not technology. The IT component is obviously important, but it is ill-advised to consider the implementation of audit analytics to be just about technology.

Of course, we are not here to argue with the fact that technology is a very important driver to enhance the capabilities of the auditor. The benefits of being able to run effective data analytics within the internal audit function are obvious. The same seminars will usually underline these benefits as much as they can: data analytics in the audit will provide the auditor with more efficiency in his work, and will enable him to cover more ground in the audit executions. Moreover, the auditor will be able to create more transparency and basis for audit results towards the business.

Rightly so, the benefits are obvious, and it seems easy enough to implement. These benefits are well known within the audit community. The benefits are however usually based on the premise of having a good technological basis as the key to success. One could hire a good data analyst and build an advanced analytics platform, and just go live. In some cases, this could work, reality is, however, more challenging.

In most cases more complex factors play a pivotal role in the success of audit analytics, which are not easily bypassed by just having a good data analyst or a suitable analytics platform. Factors that most corporate enterprises must deal with are, for example:

  • a complex corporate organization (internationally oriented and therefore different laws, regulations and frameworks, decentralized IT environment and different core processes);
  • the human side of the digital transformation that comes with implementing audit analytics;
  • integrating the audit analytics within the internal audit process and way of working.

The success of really transforming the internal audit function to the internal audit of tomorrow is where data analytics is embedded in the audit approach, and a prerequisite of gaining insights into the level of control and the effectiveness thereof with the auditee’s organization.

This success we are talking about is currently perceived as a ‘technical’ black box. In our opinion this black box is not only of technological nature, but has a lot more complexities added to it. In this article, we tend to open this black box and offer some transparency based on the experiences we have gained in setting up the internal audit analytics function.

To do this, we will start to describe the experiences we have gained in setting up audit analytics. Based on our story, we will outline our key drivers for success, regarding the implementation of audit analytics. Furthermore, we will move in to detail on how these drivers influence each other, and the importance of a balancing act between the drivers.

Case study: how the Randstad journey on Audit Analytics evolved

In 2015, Randstad management articulated the ambition to further strengthen and mature the risk and audit function. The risk management, internal controls and audit capabilities were set up years before. Taking the function to the next level meant extending existing capabilities and perspectives, with the intent not only to ensure continuity, but also to increase impact and added value to the organization. Integrating data analytics into the way of working for the global risk and audit function was identified as one of the drivers for this.

To set up the audit analytics capability, several starting points were defined:

  • build analytics once, use often;
  • in line with the organization culture, the approach has to be pragmatic: it will be a ‘lean start-up’;
  • the analytics must be ‘IIA-proof’;
  • security and privacy have to be ensured;
  • a sustainable top down approach, rather than datamining and ad hoc analytics.

This meant that a structured approach had to be applied, combined with the willingness to fail fast and often. In the initial steps of the process, technical experts were insourced to support the initiative in combination with process experts. With a focus on enabling technical capabilities, projects were started to run analytics projects in several countries, and in parallel develop technical platforms, data models and analytics methodologies.

With successes and failures, lots of iterations, frustrations and, as a result, lessons learned, this evolved into a comprehensive vision and approach on audit analytics covering technology, audit methodology, learning & development and supporting tooling & templates. Yet at the same time, it resulted into an approach, which is in line with the organizational context, fit for its purpose, and general requirements, such as GDPR.

Yet at the same time, the results of the analytics projects and contribution to audits showed interesting and promising results: by the end of 2017 a framework of 120 analytics was defined, out of which 65 were made available through standard and validated scripts.

Drivers for successful Audit Analytics

Looking back at the journey and summarizing the central perspective, a model emerged identifying drivers for successful audit analytics. The journey the Randstad risk & audit function has gone through, addressed challenges in five categories: organizational fit, internal organization of the audit analytics, supporting technical tooling and structure, audit methodology alignment and integration and skills, capabilities and awareness.

At different times in the journey, different types of challenges emerged. For example, when Randstad started expanding methodologies and technologies, the next challenge became the fit and application within the organizational context. This in turn translated into developments in the audit analytics organization. Then, the human component became a point of attention, translating into addressing audit methodology alignment and related skills/capabilities. In turn, this was further supported by updating the technical structures. During our journey it became clear to us that these challenges where not individual of nature, but are interacting with each other, and form an interplay of success drivers.

Next, we will go through the five identified challenges in more detail, and illustrate what this means in the Randstad context. In the following chapter we will try to transform these challenges into an early model, that will be the starting point in understanding which drivers have an impact on the success of audit analytics.

Implementing Data Analytics: key drivers for success

In the previous chapter, we discussed how Randstad experienced the implementation of audit analytics and the challenges and learnings that have been gained over the years. In this chapter we will further dissect the identified challenges, and translate them into drivers for success in implementing audit analytics.

Organizational fit

The first question one might want to ask before setting up an analytics program is: ‘how does this fit within the organizational structure?’. The organizational structure is something that cannot be changed overnight, and yet it will greatly determine how your data analytics program must be set up. In case this isn’t thought through carefully in the setup phase of audit analytics, one might encounter an organizational misfit regarding choices that have been made concerning technology or analytics governance. We will outline the key factors that will have an impact on the way audit analytics has to be set up:

  • centrally organized versus decentralized organization;
  • diverse IT landscape regarding key systems versus a standardized IT infrastructure;
  • many audit topics versus a high focus on a few specific audit topics;
  • uniform processes among local entities versus divers processes among local entities;
  • similar law, regulations and culture versus a diverse landscape of law, regulations and culture;
  • aligned risk appetite versus locally defined risk appetite.

We do not perceive the organizational structure as a constant that cannot be changed, but as something that cannot be greatly influenced in order to set up the analytics organization. Therefore, one must consider how the analytics organization can best fit the overall organizational structure, rather than the other way around. The lessons learned regarding this challenge are that it is vital to assess how the organizational structure may impact your methodology and setup for audit analytics. This can have both huge technical as procedural implications on setting up your audit analytics organization.

Audit analytics organization

The way the audit analytics organization is set up, is also a key driver for success. There are a lot of choices one can make when setting up the organizational structure, and defining the roles and responsibilities within the analytics or audit team. The key decision is perhaps whether or not you want to carve out the analytics execution and delegate this to a specialized analytics team, or whether you want to assign the role of data analyst to the auditor himself. This decision will have a great impact on a lot of other things that have to be considered when setting up a data analytics program. Other key factors that we have identified in setting up the analytics organization:

  • central data analyst team versus analytic capability for the local auditor;
  • a central data analytics platform or a limited set of local tooling;
  • separate development, execution and presentation versus generic skillset.
Audit analytics technical structure

The third key driver we mention is the technical structure that will enable the auditors to execute the data analytics. As said in the introduction, this topic usually plays a central role at seminars, conferences and literature about data analytics. In our opinion it is one of many drivers for success, and not necessarily the most important one. Decisions that have been made earlier in the previous two drivers will have a big impact on what choices one should make in this area. Areas to consider are:

  • implementing a central platform or work with local tools;
  • implementing an advanced data analytics platform versus choosing low entry data analytics tooling;
  • using advanced data visualization tools or using low entry visualization tools.
Audit methodology alignment and integration

The fourth key driver is – in our experience – the one that is overlooked the most. People tend to see it as a given that auditors will embrace data analytics, once it is widely available to them. On the contrary however, we have seen that auditors are somewhat reluctant in changing their classical way of working in a more data-driven audit approach. The way that data analytics will be integrated within the audit program or audit methodology is a pivotal factor for success. The right decisions regarding the following topics need to be made:

  • integrate the analytics in the audit methodology through a technology-centered approach (technology push) versus an audit-centered approach (technology pull);
  • data analytics as a serviced add-on to the audit approach versus a fully integrated audit analytics approach;
  • data analytics as pre-audit work to determine focus and scope versus data analytics as integral control testing to substantiate audit findings (or both!).
Skills, capabilities and awareness

The last defined driver for success is the skillset of the auditor to fully leverage data analytics. The skillset does not only imply the execution of the analytics, but also how to present the analytic results, and explain its implication to the business and the auditee. It is vital that the message comes across clearly, and how the analytics support the audit findings. This requires both technical knowledge regarding the analytics process and generic audit know-how, but most importantly it requires in-depth knowledge on the data the analytics have been executed on. The following key choices need to be made:

  • relying on well-equipped data analysts to execute and deliver audit analytics versus training the auditor in order to equip him or her to execute audit analytics;
  • relying on data analysts to interpret and understand analytics results and its impact on the audit versus relying on the auditor to understand the data and the executed analytics and its impact on the audit.

The crucial choice that needs to be made, is whether you will rely on the auditor to further deal with the audit analytics, or will they be assisted by a data analyst to perform the technical part of the audit analytics? If you choose the latter, you will be faced with the challenge to create an effective synergy and collaboration between the two, where the analyst understands the data and the executed analytics (and visualizations), and the auditor can put the implications of the analytic results in place for the audit findings. To create such a synergy might not seem a major challenge at first. We have however experienced that data analytics is not part of the DNA of all auditors, and therefore it might be a bigger step to take then initially presumed.

Model: drivers for success

When we summarize our experiences in a visual overview, it would look like the model presented in Figure 2 below. The model shows the interconnection between all the five drivers that have an impact on the success of your data analytics implementation. A decision made regarding one of the key drivers will in the end influence the decisions that have been made regarding one or more other drivers. Each organization that is about to implement data analytics must find the right balance between the identified drivers for success.

C-2018-4-Idema-02-klein

Figure 2. Key drivers for success. [Click on the image for a larger image]

Implementing data analytics – a balancing act

Does having this model make audit analytics successful? For Randstad, it is not this model that made audit analytics where it is today. Assembling all the lessons learned and the root cause analyses of all the ‘failures’ the organization experienced, this model emerged. It is as such a reflection of what management has learned in the journey so far. At the same time, it is a means to an end: it facilitates discussions in evaluating where an organization stands today regarding analytics, and which key challenges need to be addressed next. It thereby supports management conversations and decision-making moving forward.

Ultimately, it is all about bringing the configuration of the different drivers in balance. In implementing audit analytics, Randstad has, so far, failed repeatedly. In most cases the lessons learned analyzed: where there is pain, there is growth. It identified that an unbalance in the configuration of the drivers was the root cause.

There are multiple factors to be addressed during the implementation. These factors can sometimes be opposites of each other, creating a ‘devilish elastic’. In the Randstad journey a big push was made to set a central solution, facilitate a technical platform and integrate analytics in the audit methodology. In the course of 2017 a lesson learned was picked up from this push: the projects that were run centrally yielded positive results. It did not translate however into the global risk and audit community to start running audit analytics throughout their internal audit projects.

Randstad has set the technology and methodology; the key is to now also bring the professionals to the same page in the journey. As audit analytics in its potential, fundamentally changes the way you run audits, it also means changing the auditor’s definition of how to do its work. Overwriting a line of thinking that has been there for a very long time is maybe one of the biggest challenges there is. Therefore, when the questions are asked on what Randstad is doing currently to implement audit analytics, and what the current status is, the answer is as follows: ‘To get audit analytics to the next level, we are currently going through a soft change process with our risk & audit professionals, to get them to not only embrace the technology, but also the change in the way we perform our audits as a result. Overall, we are at the end of the beginning implementing audit analytics. Ambitious to further develop and grow, we are looking forward to failing very often, very fast.’

Concluding remarks

In this article we summarized the importance of data analytics in the internal audit, the road that Randstad has taken to implement audit analytics, the challenges and lessons learned along the way, and how these lessons can be translated into a model of key drivers for success. The goal of this article is to codify our journey and corresponding lessons learned, and communicate the experiences to the audit community, so they can profit from them.

The important message that we want to communicate, is that implementing audit analytics is far from just a technological challenge. By implementing data analytics, a large change is brought to the internal audit organization. The auditors need to change their way of working, and make a paradigm shift towards a data-driven audit. One cannot underestimate the implications of such a change by focusing mainly on the technological success of data analytics.

Reflecting on these developments and audit analytics initiatives, one should really take this paradigm shift into account. What does audit analytics mean in the old world, but also in the new world?

Ultimately a key challenge is how to go through the paradigm change, and how to support (or not support) auditors in making the paradigm change? Understanding and embracing audit analytics might not be their biggest challenge! Something Randstad Global Business Risk & Audit is working on, daily!

Trusted analytics is more than trust in algorithms and data quality

Trusting data for analytics provides challenges and opportunities for organizations. Companies are addressing data quality within source systems, but most are not yet taking sufficient steps to get the data used for analytics under control. In this article we will take a closer look at how the more traditional data management functions can support the dynamic and exploratory environment of data science and predictive analytics. We look at existing customer challenges in relation to these topics as well as the growing need for trusted data.

Verify your trust in your data & analytics

Organizations become increasingly dependent on data and results of analytics. For more traditional purposes such as Business Intelligence or reporting, there is an increasing awareness of the value of good data quality. This awareness is also in place for organization which focus on innovation, they have developed detailed analyses to understand customers better, which has led to made-to-measure products, pricing and services for their clients. Next to that, data-driven regulation is fast expanding, which also relies heavily on good data quality. The well-known GDPR (data privacy) is an example of such data driven regulation, but also BCBS#239 (collecting data on risk aggregation for Banks) and Solvency II (proving in control data for insurers) for financial services as well as data requirements for EU food regulations. In order to be able to keep up with all these – quite fast-changing – developments, organizations increase their usage of data and analytics for their reporting, better understanding and servicing their customers and to comply with regulation.

As the value of data & analytics increases, so is the awareness of users of associated products, e.g. report owners, management, board members as well as (external) supervisory authorities. And with that increasing awareness comes the growing need to rely on trusted data and analytics. These users are therefore looking for insights that ensure trustworthy data and analytics ([KPMG16]). For instance, understanding that the data they use is correct. Or from an analytics perspective that analyses are done in accordance with ethical requirements and meet the company’s information requirements. Trustworthy data quality is not a new topic; in the last decade, organizations have focused on data quality, yet mostly in source systems.

With the further maturing of these analytics initiatives, many organizations now want to extend data quality from source systems to reporting and analytics. One of the side effects of this development is that the analytics pilots and initiatives organizations have in place, are now also examined on how to further mature them, moving from pilots for analytics to sustainable solutions. In short, the relevance of trustworthiness of both data and analytics is increasing. Which requires data quality to provide complete, accurate, consistent and timely insights, and of algorithms used for analytics which are repeatable, traceable, demonstrable and of consistent analytics – in accordance with ethics and privacy requirements ([Pato17]).

This trustworthiness in practice can be challenging for organizations. Although organizations have invested in improving the quality of their data – still the data quality and data definitions are not yet always consistent throughout the entire organization. And as most organization are still at the pilot level for establishing their analytics environment, building trust in analytical algorithms is even more complex.

A good starting point to increase the trust in both data and analytics is a so-called data and analytics platform – for instance in the shape of a “data lake”. In this context, a data platform can be considered as the collection of data storage, quality management, servers, data standardization, data management, data engineering, business intelligence, reporting and data science utilities. While in the recent past data platforms have not always delivered what they promised (in some cases turning the data lake into a data swamp – where data is untraceable and not standardized) ([Scho17]). With that knowledge, organizations already or are currently implementing data-driven initiatives and data & analytics platforms ([GART17]) are now focusing to build a controlled and robust data and analytics platform. A controlled platform can function as the initial step for trusted data and analytics.

Virtual salvation or virtual swamps?

To bring trustworthiness to data & analytics, new technologies such as data virtualization ([FORB17]) are currently being explored. These offerings promise the speed of computation and diversity of integration of a data platform without having to physically store a copy of your original data on a separate environment. Virtualization also offers optimization, scalability and connectivity options with faster access to data. From some perspectives, this sounds even more promising than a data lake. But this increased potential comes with a risk. If a solution that is even more easily “filled” with data is left uncontrolled, the risk of drowning in a “virtual swamp” might be even higher. In general, we see that a trusted data & analytics framework is consistent in bringing trust to ever-developing technology.

Next to the case for trustworthy data & analytics there are several cases which a data platform typically solves:

  • reduction of complexity within reporting infrastructure (such as lower replication costs and associated manual extraction efforts);
  • increased insights in available data;
  • reduction of complexity and dependencies between source applications (by decoupling systems vendor lock-in is reduced when a system change can be absorbed with standard data models and customizable system connections (APIs) in the data platform infrastructure).

Given the potential values of the data platform, it is essential that the risk of turning the prized data platform in a swamp (see box “Virtual salvation or virtual swamps?”) is mitigated. In the following section we present a control framework that will keep the beast at bay and will allow a healthy combination of data exploration to coincide with a data platform under control.

Data platform under control

For decades, data warehouses have supported reporting and BI insights. They applied a so-called “schema on write” approach, which simply means that the user is required to predefine the structure of a table (called “schema” in technical terms) to be able to load (or “to write”), use and process data. Having a predefined structure and extraction, transformation and loading processes developed specifically for your data set ensures predictability and repeatability. However, the structure that the data is written into is typically created for a pre-defined purpose (a report, an interface, etc.). Furthermore, the process of defining, and even more so combining these schemas, is usually time consuming and diminishes flexibility, a crucial aspect in fast-changing environments.

Data platforms bring the flexibility that changing environments require. They offer an alternative “schema on read” approach that allows a user to load data onto the platform without caring for which schema it is loaded into. The platform technology simply takes the data as-is and makes it available to the user as-is. This decreases the time spent on defining schemas or complicated modelling efforts and allows the user more time and flexibility to apply the data. This approach is already taking place: companies have on-boarded as much of data as possible into a data platform, making investments in the expectation that merely making this data available to an user base will kick-start their data-driven business.

As always, the reality is more complex, caused by the fact that the user base is ill-defined, a lack of quality and semantic agreements and context of the available data. This results in data overload that will refer users back to the traditional environments (such as, data warehouses, traditional BI tools or even Excel spreadsheets) and will limit existing users to the data (sets) they know. Furthermore, with the enforcement of the General Data Protection Regulation (GDPR) in place since 25 May 2018, on-boarding sensitive (personal) data onto a platform where many users can access this data without proper access controls and data protection controls (incl. logging and monitoring), exposes the organization to large compliance risks, such as fines.

In the following paragraphs, we opt for an approach to on-board data sets that combines a blended approach of measures for both data and analytics, controlling the ingestion of data sets sufficiently to support compliance, while still enabling innovative data exploration initiatives. The following steps are defined within this blended approach; setting preconditions, deliver prepared data, standardize the data, exposing ready-to-use data, enable traceable analytics and keep monitoring. Figure 1 visualizes these steps.

C-2018-3-Verhoeven-01-klein

Figure 1. The KPMG Data Platform Under Control framework with relevant preconditions and 5 steps for practical trust in analytics. [Click on the image for a larger image]

Step 0: Set up the platform

Setting up a data platform is typically perceived as a technology solution. Considering the challenges indicated in the previous paragraph however, the technical implementation of a platform and its interfaces to source systems should go hand-in-hand with the creation of reference documentation, agreement on standard operating procedures and implementation of a data governance framework.

Sufficiently detailed reference documentation should at least be partially in place. We can distinguish three main categories: enterprise IT and data architecture, a data catalogue and an overview of tooling used throughout the data lifecycle. These documents should be easily available and automated in such a way that users can quickly find the information they are looking for during on-boarding or development activities.

Standard operating procedures should be in place, providing guidance for data processing processes and procedures within the data platform. Examples include: on-boarding of new data sets, data remediation activities, how to deal with changes, incident and limitation procedures. These procedures go hand-in-hand with the data governance framework, which consists of a list of roles involved within these processes and procedures and their corresponding responsibilities. Key critical roles within this governance framework are the user community (data scientists, data engineers), the data operations staff (data stewards, data maintainers) as well as the roles that have accountability over a data source such as a data owner. Ownership should also be considered before the data delivery is started. It encompasses involving the right functions, responsible for the data in the source system and connecting them to the persons responsible for building the data platform. Establishing end-to-end ownership can be a goal, but of primary importance is the focus on agreements on data delivery service levels and the division of responsibilities throughout the data delivery processes at first, so that aspects like sensitivity or intellectual property loss or privacy are given the proper attention and the usability of the data set is tailored to the end-user.

Step 1: Control the data delivery

Data delivery is the correct transfer of data from source systems to the data platform. For data on-boarded on the platform, clear provenance (understanding the origin of the data) must be available. This provenance must also contain the source owner, definitions, quality controls as well as which access rights should be applied. These access rights should specifically be in place to fulfil the increasing demands of privacy regulations such as the GDPR or e-Privacy. After all, the data delivered might contain personal identifiable information details – this needs to be identified when the data is delivered to the data platform and protected by design ([GDPR18]).

Furthermore, when on-boarding data on the platform, the context for data usage must be predefined and the data platform should have controls in place to regulate the usage of data within this context. Next, several measurements should be done to measure the type and quality of the data loaded for use. Of course, the integrity of the data should be ensured throughout the whole delivery process.

Step 2: Standardize the data

Data from different sources are loaded into the platform. This means data will differ in format, definitions, technical & functional requirements and sensitivity. In addition to the access controls of step one, the sensitive data needs to be anonymizatized or pseudonymized ([Koor15]), making it impossible to trace individuals based on their data within the data platform.

After the anonymization, the data is standardized. To be able to perform data analysis, consistent values are required and functional names need to be uniform across different data sets and definitions need to be consistent. Why are definitions important? For example, to do proper marketing analyses, different types of customers need to be distinguished, such as potential customers, customers with an invoice, customers with an account and recurring customers. In case of disagreement between units on these definitions, analyses or decision-making mistakes can be easily made.

Lastly, data quality improvements (or: data remediation) must be applied at this stage to bring the data to its desired quality level to be able support the usage of this data in reports and algorithms ([Jonk12]).

These steps – anonymization, standardization, remediation – occur in this fixed order to realize the data processing procedure. Documenting these activities in a standardized way also ensures the users’ understanding of the data in the data platform (see Step 4). This document contains the followed steps and primarily increases readability and therefore understanding with users and secondarily enables easier integration of processing routines of multiple users of the same data set. Figure 2 shows an example.

C-2018-3-Verhoeven-02-klein

Figure 2. An example of why standardized data processing makes collaboration between scientists easier; a standardized processing procedure allows easier reuse of code, standards and rules. [Click on the image for a larger image]

Step 3: Delivery ready-to-use data

After standardization, anonymization and data quality improvement, the data is in fact ready to be used for analysis purposes. The data has reached ready-to-use status when it can meet the needs of the users, that the user knows what the source is, knows how to interpret the data, trusts the data quality of the data and can obtain formal agreement from the data owner for their intended analysis.

Step 4: Enable sustainable analytics

The previous steps are all focused on controlling the data. However, trusted data & analytics also require controlled usage and analysis activities. Algorithm design should be documented and governed in a similar way to implementing business rules for data quality improvement, with the additional requirements for documentation of versioning, ethical considerations and validation that the working of the algorithm should match its intended goal. By documenting the algorithm including its complete lifecycle (from design to usage to write-off) enhances its sustainability. After all, having a complete overview of the algorithms lifecycle, produces traceable and repeatable analytics.

On a practical note; to keep track of all the activities performed on the data platform an audit trail should be kept. Luckily, many data platforms offer this functionality out of the box. Documenting analyses can be done in specialized software that also enables analyses such as Alteryx, Databricks, SAS, etc. This ensures that the documentation is close to the place where analysts use the data and reduces the effort to maintain separate functional documentation.

Step 5: Keep monitoring

Effectiveness of the extent of control of your platform can be verified through continuous monitoring. Monitoring of effectiveness is an essential part but should be proportional to the size, goal, importance and usage of the data controlled on the platform. Through consistent and fit to measure monitoring it is possible to demonstrate and improve the process steps as described above, the related control framework and quality of an information product once provided to a user from the data platform. Insights provided through monitoring will be used to determine compliance with the current control framework and ultimately to evaluate and refine the data platform controls (e.g. modify data quality rules).

With the increasing the development of data platforms, the development of trusted data & analytics is also a recent phenomenon. It all coincides with the rising need of repeatable and sustainable analytics, as well as examples of previous data platforms have turned into the dreaded data swamp. Therefore, this approach has been adopted across sectors, for instance by an international tier-1 bank, an innovation center and a Dutch energy and utilities company. The level of acceptance of this new way of working differs. Where increased compliance is required, this trusted environment helps to support and resolve complex regulatory requirements. However, from a data science / data analytics perspective, analysts in general perceive this control as interfering in their way of working as they were used to a large degree of freedom roaming around in all data available. It is important to align all stakeholders in the new way of “trusted” working, optimally supporting compliance whilst leaving room for freedom to be able to indeed create (new) insights. This balance maintains progress in the acceptance of trusted data and analytics.

Capture the trust

How do you demonstrate that controls exist and are effectively working after they have been put in place? The evidence for these controls is captured in a so-called “data & analytics way-bill”. It contains the documented activities and results as described above in step 1-5, for example the name of the data set, the owner, where the original data resides, for which purpose it may be used, the level of standardization, etc. etc. This way-bill document ideally automatically captures the output of all controls and measures the controlled on-boarding and usage of a specific data set. Furthermore, it connects the tooling used within an organization to support data governance, capture data lineage, measure data quality, keep a backlog of to be implemented business rules, standards and algorithms, etc.

In order to provide trust in data for analytics, the way-bill has proven to be a valuable device to demonstrate the effectiveness of all controls during the entire process the data set is subjected to; from source through the on-boarding and ultimate usage of data within the platform. This overview does not only provide trust in the data itself, but also in the algorithms used, underlying data quality and supportive technology and architecture.

Conclusion

As outlined in this article, trusted data for analytics consist of a step-by-step approach to realize relevant controls in a data platform to support a compliant, dynamic and an exploratory environment of data science and predictive analytics. Our blended approach combines lessons learned from controlling traditional systems (e.g. pre-defined data structures, data management controls, data definitions, governance and compliance) with the benefits of a dynamic and exploratory data platform (e.g. data lake). With a data platform under control, organizations are able to deal with data in a faster, cheaper and more flexible way. Controlled and ready-to-use data for data science and advanced analytics purposes also offers possibilities for flexible, fast and innovative insights and analyses.

References

[FORB17] Forbes, The expanding Enterprise Data Virtualization Market, Forbes.com, https://www.forbes.com/sites/forbescommunicationscouncil/2017/12/12/the-expanding-enterprise-data-virtualization-market/#10a39dfd40ca, 2017.

[GART17] Gartner, Gartner Survey Reveals That 73 Percent of Organizations Have Invested or Plan to Invest in Big Data in the Next Two Years, Gartner.com, http://www.gartner.com/newsroom/id/2848718, 2016.

[GDPR18] GDPR, Art. 25 GDPR Data protection by design and by default https://gdpr-info.eu/art-25-gdpr/, 2018.

[Jonk12] R.A. Jonker, Data Quality Assessment, Compact 2012/2, https://www.compact.nl/en/articles/data-quality-assessment/?zoom_highlight=data+quality.

[Koor15] R.F. Koorn, A. van Kerckhoven, C. Kypreos, D. Rotman, K. Hijikata, J.R. Bholasing, S. Cumming, S. Pipes and T. Manchu, Big data analytics & privacy: how to resolve this paradox?, Compact 2015/4, https://www.compact.nl/articles/big-data-analytics-privacy-how-to-resolve-this-paradox/.

[KPMG16] KPMG, Building trust in analytics, https://home.kpmg.com/xx/en/home/insights/2016/10/building-trust-in-analytics.html, 2016.

[Pato17] J. Paton and M.A.P. op het Veld, Trusted Analytics, Mind the Gap, Compact 2017/2, https://www.compact.nl/articles/trusted-analytics/.

[Shol17] D. Sholler, Data lake vs Data swamp: pushing the analogy, Colibra website, https://www.collibra.com/blog/blogdata-lake-vs-data-swamp-pushing-the-analogy/, 2017.

Tackling the “trust barrier”

Obtaining more and better insights, gaining competitive advantage and improving business processes: these are some of the reasons why organizations want to make data-driven decisions based on the use of innovative tools. But how do we know if the insights obtained from these tools can be trusted? Accompanied by an example of a Contract Extraction tool we discuss the approach to Trusted Analytics and how trustworthy tools can be realized.

Introduction

The Industry 4.0, Internet of Things, Artificial Intelligence, robotics, innovation, and machine-to-machine are all buzz words in the world of innovation. The digital world is growing and companies are aware that they need to keep developing and make better use of their abundance of data. By centralizing data, analyzing it by using innovative techniques and turning this into actionable insights, business processes can be improved and even new business models can be realized. Data-driven actions and decisions can help companies to better understand their customers, to improve their supply chains, to become more productive and realize more profit, and to gain a competitive advantage.

Not only start-ups but also multinationals are developing innovative tools for their own organization or clients to add value, make better decisions and improve their business, because a sense of urgency is present. According to the KPMG Global CEO Outlook of 2017 ([KPMG17-2]), which is an annual research of the issues and priorities CEOs are focusing on, 72% of the companies expects to have a high investment in data analytics tools in the coming three years. Furthermore, 67% expects a high investment in cognitive technologies (among which Machine Learning and Artificial Intelligence).

However, although the sense of urgency is present, which is essential to adopt innovations, there is a crucial barrier concerning the usage of innovative tools, i.e., “trust”. Can tools, which perform actions and make decisions based on the data without intervention of a human being, be trusted? How can the developers of tools identify and tackle this “trust barrier”? And did we tackle it when developing the Contract Extraction Suite tool?

Below we will try to answer these questions by shortly discussing the KPMG model of Trusted Analytics, as already discussed in a previous issue of Compact [Pato17], and by discussing whether and how KPMG Forensic Technology covered the four anchors of the trust model when developing the Contract Extraction Suite (hereafter: CES).

Trusted Analytics

Measuring trust

As knowledge of technology increases, so does the number of innovative tools which use techniques such as text analytics, artificial intelligence and neural networks. Where in the past only IT specialists were able to analyze data and make data-driven decisions, nowadays each employee within an organization is able to use tools, obtain insights and translate them into decisions and actions. However, although users do not need to understand the underlying approach, such as the chosen algorithms, the approach needs to be trustworthy. This trustworthiness is among other things based on the data quality, the effectiveness of the chosen algorithms and the decisions made by the machine. In other words, it is not only about the data that we use (which is also still important), but how we use it, and how it results in the decisions that are made. It is clear that only when the tool is trustworthy and the profit outweighs the costs, people are willing to use it. But how can we measure trust in algorithms, decisions and data quality?

It is all about the risk that people are willing to take, better known as “risk appetite”. Instead of asking “Do you trust the underlying approach of the tool?”, you need to ask yourself the following questions: “What is the risk when the tool uses the wrong technologies or makes the wrong decisions and am I willing to take this risk?” In some situations a small error can already have a big impact. Think for example of self-driving cars. Self-driving cars are cars that drive without the help of a human being by the use of sensors and algorithms. A small error in the system can result in a car accident, which is a risk that, according to a research by Multiscope, most people are not willing to take ([MULT15]). Although 62% of Dutch consumers is positive about self-driving cars, 80% still wants to be able to take control of the car.

We know from experience that the risk appetite concerning the usage of innovative tools is also very low, since these tools are the foundation for the decisions made within the organization. Obtaining incorrect insights and making wrong decisions may not only affect the supply chains and profit, but in the worst case may also affect the brand reputation and therefore the trust by customers and stakeholders in the product or service. According to the KPMG Global CEO Outlook of 2017 ([KPMG17-1]), 61% of the questioned CEOs mentioned that building greater trust among customers and external stakeholders is a top three priority, due to the awareness of the potential impact on business by negative public opinions and the growing importance of the reputation and brand concerning business success. Eventually this results in organizations decreasing their risk appetite.

C-2018-3-Nap-01-klein

Figure 1. The reputational risk when using data and analytics ([KPMG16]). [Click on the image for a larger image]

The Four Anchors of Trusted Analytics

As discussed in the Compact 2017/2 edition [Pato17], Trusted Analytics is a term being used for the implementation of analytics that can be trusted. People want to know if the output of the implemented analytics is correct by using the correct data, implementing the right technologies and making the right decisions. In 2016, Forrester Consulting, in commission of KPMG International, examined the power of trust in D&A by exploring organizations’ capabilities across four anchors of trust ([KPMG16]). These anchors are: quality, effectiveness, integrity and resilience. By focusing on and strengthening these anchors, developers will be able to tackle the obstacle of trust, since it makes tools more trustworthy. The potential users of tools can also use this model to determine the trustworthiness of the tool and to identify risk areas. The four anchors of trust are discussed below.

C-2018-3-Nap-02-klein

Figure 2. The four anchors of trust ([KPMG16]). [Click on the image for a larger image]

Quality

Quality is a broad term and one of the most mentioned anchors concerning trust. Organizations are aware of the importance of data quality during the whole process of data analytics (from importing data to obtaining results), but it is also a challenge, since the storage of data and its regulations are growing.

To determine the quality of the tool, different aspects need to be investigated, since the quality depends on multiple factors. These aspects include the following:

  • appropriateness of the data sources;
  • quality of the data;
  • rigor behind the analytics methodologies;
  • methods used to combine data sources;
  • knowledge and implementation of best practices;
  • expertise of data analysts and scientists.

From these key gaps in quality, organizations consider good quality of the data as the most challenging one.

Effectiveness

Effectiveness is about the performance of the tool. Do the tool and its output work as intended and does it deliver value to the organization? The effectiveness of a tool can be measured by determining the confidence in the:

  • effectiveness of the tool in supporting business decisions;
  • way the tool and its output are used across the organization;
  • accuracy of its model in the prediction of results;
  • appropriate use of the tool by employees to make decisions and complete tasks.

However, according to the survey of Forrester Consulting [KPMG16], many executives find it difficult to measure the ROI and its value to the organization. Only 47% of the executives declare that they check and monitor the effectiveness of data models in supporting decision-making. Furthermore, 42% says they track and monitor the impact of incorrect insights and actions by misusing/incorrect analytics.

Integrity

The anchor integrity is especially related to the “correct” use of the data, from being compliant with rules and regulations to the ethical use, such as profiling. The questions that need to be asked are: How does the tool use the data and is it in compliance with laws and regulations, for example concerning data privacy? To answer these questions and determine the integrity of a tool, the confidence of the organization in the following aspects need to be checked:

  • alignment with relevant rules and regulation;
  • transparency (with customers and for regulatory purposes) of the way the data is collected, stored and used;
  • evaluation of how customers think of the use of their data;
  • alignment to ethical responsibilities and policies.

Although it might sound to some people like a new topic in the field of analytics, it is a very important anchor, due to the rapidly changing regulation (one may think of the GDPR) and the impact when actions are unethical or not compliant. It may not only have an impact on the internal trust, but also on the public trust, and may therefore cause brand damage.

Resilience

The last anchor concerns the resilience of tools when challenges and changes occur. Is it secure against cyber attacks for example? And if the organization needs to extend or change functionalities of the tool due to new data sources, is that possible?

Resilience of a tool can be measured by investigating the organization’s confidence in:

  • the ability to adjust governance policies to data use scenarios;
  • how the authorizations to access and use data are controlled;
  • how data changes are tracked and reviewed;
  • how cyber assurance is managed.

Tackling the obstacle

By measuring against the four trust anchors, identifying the gaps and closing these gaps, we are able to tackle the obstacle of not being able to trust the usage of innovative techniques and tools. As mentioned earlier it not only helps (potential) users to determine the trustworthiness, but also the developers of tools. That is, during the process of development they need to keep measuring against quality, effectiveness, integrity and resilience in order to identify gaps and improve their tool by closing these gaps. In other words, to create a trustworthy tool.

To examine how the trust model can be applied to the development of tools in practice, we zoom in on the KPMG solution CES.

Contract Extraction Suite

The CES is a tool that extracts information, in form of pre-defined data points, such as the start date, end date and price, from unstructured contracts. By extracting this information through using innovative techniques and creating a relational database, an organization can easily obtain an overview of all current and former contracts.

The sense of urgency

The reason for the development of this tool, and also the cause of the sense of urgency, is the new lease standard IFRS 16, which will be active from 2019. This lease standard requires leaseholders to add lease constructions to their balance sheet, which will make the assets and liabilities visible on the annual financial statement. This change in regulations has an impact on many companies when they do not have an overview of their current contracts, for example because of the high number of contracts or the existence of hardcopy contracts. Furthermore, when the number of lease contracts is high, going through these files and extracting information from the contracts manually is time-consuming. Therefore, a tool that scans these documents, extracts lease terms from them by using text-mining techniques and centralizes these data, can help organizations efficiently turn data into insights.

The trust anchors

The reason to use this tool differs per organization. Each organization wants to extract information and obtain insights from contracts, but the actions and decisions that result from these insights differ. This means that also the level of risk when making the wrong decisions or taking the wrong actions differ per organization, which affects the risk appetite. That is, when the tool is used for IFRS 16, obtaining incorrect insights may result, in the worst-case scenario, in a substantive error which makes the risk tolerance low.

In order to be able to trust the CES and to trust the insights, decisions and actions that result from using it, a trustworthy tool needed to be created.

Quality

To guarantee sufficient quality, different quality checks were performed during the development of the tool, but are also done when using the tool. The first check is after scanning the hardcopy contracts and performing Optical Character Recognition (OCR) on these documents, which extracts text from an image. To determine the quality of the contract, the tool determines the percentage of words occurring in a created dictionary. When this percentage is low, this may indicate that the OCR is not performed correctly due to contract quality. Therefore, the scanned document is not selected for automated term extraction. An example of this is when someone wrote with a pen on the contract or the text is faded. During the development of the tool, an additional manual check was performed to determine whether the assumption concerning the performance of the OCR was correct and whether the contract indeed should not be selected.

After preparing the data, automatic language detection and template detection are performed, which also have the purpose to select contracts that work well with the chosen algorithms concerning term extraction. That is, the developed search engine supports different languages (e.g., Dutch, Spanish and French), and next to lease contracts, it supports procurement contracts and subsidy contracts. When the language, contract type or template cannot be identified or is not supported, the contract is not selected for automated term extraction. And besides that; template detection has another purpose. By clustering the contracts based on their characteristics, knowledge of the variety of contracts is obtained, which is used by the developers to improve the tool.

Based on the identified language and type of contract, a developed algorithm is chosen to extract the information from the contract, by using text-mining techniques. To develop effective algorithms, the developers train the algorithms on the different contract types and languages, with help from subject matter experts and by manually comparing the outcome with selected contracts, performing root cause analyses when mismatches occur, and improving the algorithms, which is a continuous process.

It was a conscious choice to not create a self-learning model using Artificial Intelligence. That is, a self-learning model works well when it is trained on a large number of contracts, with different contract types, different setups, and different languages. However, when the model is only trained on contracts of the same contract type and same setup, and a contract with another setup is loaded into the tool, it may not identify the data points well.

C-2018-3-Nap-03-klein

Figure 3. The Contract Extraction Suite. [Click on the image for a larger image]

The steps concerning data preparation and processing are illustrated in Figure 3. It shows that the CES actually consists of two different tools: the extraction tool and the validation manager. The extraction tool contains OCR, language detection, template detection and term extraction. When the selected data is processed, it is imported in the validation manager to validate the results, which is an important element concerning the trust anchor effectiveness.

Effectiveness

To guarantee the effectiveness of the tool, the CES incorporated a data validation workflow (the “validation manager” tool), as shown in Figure 3. This workflow focuses on automated validation procedures and minimizes the number of manual checks and corrections that have to be made. That is, when performing term extraction, each detected term obtains a numeric value, which indicates the likelihood that the selected text is indeed correct. When the likelihood is less than a user-defined value (depending on the risk appetite), the user of the tool needs to validate the identified term and change it if needed. In this way, users are able to improve the accuracy, without being time consuming. This functionality in the user interface creates trust, since users feel that they are in control. As an additional validation, also the terms that are considered to be extracted correctly by the tool can be sample-checked via the same workflow. In this way, users that need to rely on the tool can validate the results.

Integrity

The integrity of the CES is a fundamental ingredient due to the impact when the integrity is violated. First of all, most contracts contain limited personal information since in most cases it is business-to-business. Furthermore, each change in the workflow is tracked by logging, which makes it transparent and easy to determine which actions are taken and by whom. And lastly, the tool contains user access management and different user roles so that access and rights can be controlled. When a user is added to the tool, he/she has no access to the contracts by default until contracts are assigned.

Resilience

The authorizations of users are managed, but there are more factors that influence the resilience of the tool. Looking at the flexibility to change or extend functionalities, this tool can be improved. It takes time to search for data points in new contract types and identify new data points, since the developers need to create new algorithms or adjust the algorithms to stay effective.

However, when a data point is not identified correctly it does not or barely affect the identification of other data points. The same holds for the different contracts. When one contract contains an issue and therefore has poor results, it does not affect the performance on other contracts.

Lastly, the term extraction can be performed separately from the validation, which makes it optional to perform the extraction in a separated network. This will decrease the risk of cyber threats.

Is the CES a trustworthy tool?

Whether the CES is trustworthy still depends on the risk appetite of the potential users. It is clear however that the developers of the tool focused well on the trust anchors (mainly on quality and effectiveness). That is, only contracts with a certain quality and with certain characteristics are selected so that the developed algorithms are effective and correct insights are obtained. Furthermore, together with subject matter experts the developers were able to create and train the algorithms. Lastly, the users are able to validate and adjust the results by using the validation manager tool. This last element does not only improve the effectiveness of the tool, without being time-consuming, but it also creates control. The users of the CES feel they are in control without being forced to know the back-end of the tool. Although the CES can be improved to increase the trust (mainly concerning the trust anchor resilience), the quality and effectiveness of the tool are high.

Conclusion

More and more innovative tools are developed by not only start-ups, but also multinationals. The sense of urgency is there, but the crucial barrier for potential users is trust. Are tools trustworthy? Yes, they can be. Users are able to trust tools – without understanding the underlying techniques and methods that are used – when the developers focused on the four anchors of trust when developing the tool. That is, during this process they need to keep measuring against quality, effectiveness, integrity and resilience in order to identify gaps and improve their tool by closing these gaps. In other words; to tackle the “trust barrier”.

How these gaps can be closed differ per solution. Concerning the CES, different elements have improved the trust, but one of the most powerful elements is the validation manager tool, through which the users feel that they are in control without having to understand the back-end of the tool and without needing to undertake many steps manually.

Jori van Schijndel, Patrick Özer and Bas Overtoom contributed to this article.

References

[KPMG16] KPMG International, Building trust in analytics – Breaking the cycle of mistrust in D&A, https://assets.kpmg.com/content/dam/kpmg/xx/pdf/2016/10/building-trust-in-analytics.pdf, 2016.

[KPMG17-1] KPMG, Disrupt and grow – 2017 Global CEO Outlook, https://home.kpmg.com/content/dam/kpmg/nl/pdf/2017/advisory/2017-global-ceo-outlook.pdf, 2017.

[KPMG17-2] KPMG, Economic outlook and business confidence, https://home.kpmg.com/content/dam/kpmg/nl/pdf/2017/advisory/2017-global-ceo-outlook-dutch-results.pdf, 2017.

[MULT15] Multiscope, Laat de zelfrijdende auto maar komen!, http://www.multiscope.nl/persberichten/laat-de-zelfrijdende-auto-maar-komen.html, 2015.

[Pato17] J. Paton MSc and M.A.P. op het Veld MSc RE, Trusted Analytics – Mind the gap, Compact 2017/2, https://www.compact.nl/articles/trusted-analytics/.

In algorithms we trust

Can we trust the analysis and decision-making processes that takes place under the hood of systems that guide us? Early signs indicate a growing societal agitation about algorithms although the common norms and values we attach to them are far from crystal clear at this point in time. We recognize strong similarities with the events that resulted in the rise of the financial audit profession well over a hundred years ago. Back then there was significant distrust of the general public in annual reports. We propose, in analogy with financial audit, to develop an assurance model for the governance of algorithms as the foundation of societal trust.

Introduction

What is the common denominator of investment decisions, elevator buttons, medical diagnoses, news feeds and self-scanning cash registers? The answer: these are all examples of where decisions are increasingly fuelled by algorithms. In the past we used to be afraid of a scenario where Big Brother was watching us. The reality turns out to be different: Big Brother is guiding us in almost everything we do. That leads us to a new challenge: how do we ensure that this automated guidance of our lives is done properly? In other words, if we enter an age of governance by algorithms, we need to think about the governance of algorithms as well.

Can we trust the analysis and decision-making processes that take place under the hood of the systems that guide us? Early signs indicate a growing societal agitation about algorithms although the common norms and values we attach to them are far from crystal clear at this point in time. We recognize strong similarities with the events that resulted in the rise of the financial audit profession well over a hundred years ago. Back then there was significant distrust of the general public in annual reports. We propose, in analogy with financial audit, to develop an assurance model for the governance of algorithms as the foundation of societal trust.

Although there are significant differences, we can surely learn from the three lines of defense model that was developed for controlling financial risks over the last decades. In this article we discuss how a similar model can be developed for algorithm assurance. Our main conclusion is that the most difficult element is the creation of connecting tissue between the functional domains in the first line of defense and the risk domains in the second.

Governance by algorithms

We have become addicted to algorithms in almost everything we do. These algorithms typically have a positive and a negative side. The positive side is that they help us make better decisions or make our lives more convenient. One of the main negative sides is the risk that algorithms may guide us in an inappropriate way. A growing group of concerned citizens voices concerns about this adverse impact on our lives. This makes sense, as algorithms quickly gain significance in a society where the amount of data grows exponentially and many algorithms are far from transparent about how decisions are made “under the hood”.

Algorithms for instance dictate our credit scores (in China, credit scores are even based on social behavior these days); In some cases, even jail sentences are partially based on algorithmic assessments; and medical professionals diagnose patients based on data, with software that contains algorithms to come up with personal advice.

The old motto of George Orwell states that Big Brother is watching you. In fact, reality has developed beyond that. As a consequence of the increasing impact of digital technology on our human actions, it’s safe to say that nowadays Big Brother is guiding you. One can only hope that this guidance is based on the correct models and is in accordance with our values and needs. Technology such as algorithms mediates ([Verb15]): we can’t just see this technology as “neutral stuff” as it shapes the way we interact with each other. As a consequence it has effect on our personal acts (micro) and on the functioning of society as a whole (macro).

What is needed to create an algorithm that we can trust? Let’s look at a simple example: a navigation system. As a user, you expect that such a system will lead you from A to B in the best possible way. That requires at least three things: 1) the quality of the (card) data must be valid; 2) the route must be calculated in an effective and reliable manner under varying circumstances; and 3) the results must serve the best interests of the user. For example, the algorithm should not have a preference for routes along particular commercial outlets or gas stations (unless asked for).

This sounds simple but in reality is a lot more complicated. One of the reasons is that historically, the pace of technological developments is faster than regulators can cope with. Also the awareness and implications on societal norms and values seems to consistently lag behind.

A beautiful example is found in the case of airline reservations platform SABRE. In the 1970s travel agents could complete a near-instantaneous booking for most airlines via dedicated SABRE terminals. It was a breakthrough concept compared to manual reservations and was very successful. It was also heavily criticized as SABRE could favor American Airlines. Looking back, it was remarkable that American Airlines didn’t even deny their manipulative efforts. The president of American, Robert L. Crandall, boldly declared in a senate hearing that biasing SABRE’s search results to the advantage of his own company was in fact his primary aim. In his words: It was the raison d’etre of having such a platform.

Decades later, this argument sounds silly, mostly because societal norms and values have changed. Should Mark Zuckerberg have been so bold in his recent senate hearings about Facebook practices it would have been hopelessly naive and would probably have a disastrous effect for his company. We now expect platforms to behave in accordance with societal values. However, these values are far from crystal clear and are continuously adjusted to cope with fast technological advances. One important aspect in the discussions is the “black box effect” of algorithms and the lack of assurance around the operating intricacies. Policymakers and politicians have only started to discuss how algorithms govern our lives and to develop an accompanying vision on what that means for the way algorithms should be regulated. The European Parliament formulated a resolution in the spring of 2017 calling on the European Commission to take the lead. The emergence of algorithms, according to the resolution, has beautiful and less beautiful aspects. Learning machines have “immense economic and innovative benefits for society” but at the same time they offer new challenges.

One of the key elements in the resolution is the explainability of algorithms. This explainability is already manifest in the European GDPR legislation that gives citizens a “right to get an explanation” in case of algorithmic decision-making. An example: it entitles them to understand why they were rejected for a bank loan when the decision was based on an algorithm.

Governance of algorithms

When society is governed by algorithms, the question pops up how to organize the governance of algorithms. This subject is addressed in scientific initiatives such as “Verantwoorde Waardecreatie” (Responsible Value Creation) with Big Data (VWData) in the Netherlands. The goal of this initiative is to develop instruments and an architecture for fair, reliable and trustworthy use of Big Data in order to ensure value creation for business, society and science.

The audit profession can play a key role in contributing to this goal by providing a new type of assurance around the use of algorithms. However, this is a relatively new domain. The profession is currently in need of a model as a foundation for this assurance. The goal would be to give an integrated opinion on a set of characteristics of how organizations develop and deploy algorithms. This opinion would then enable organizations to demonstrate publicly that they properly govern algorithm results and helps them to build and maintain public trust.

In a number of perspectives, this new challenge has analogies with the model of the audit of financial statements and the accompanying control frameworks that has been around for decades. Let’s explore the similarities and see how we can learn from these.

Assurance on behalf of society

The first observation is that both financial audits and algorithm assurance are carried out on behalf of a broad societal need. In the case of financial audits, the objective is to make sure that users of financial information can trust this information and use it for their decision-making. In practice, there is a wide array of decisions. One example is an investor who uses the audited information to make an informed judgment. Another is a job seeker who uses a financial report to gain some background information before a job interview. It is evident that the first user has higher demands on accuracy than the second. There’s a variety of public expectations, based on what’s at stake and its dependency on the information.

To deal with this, auditors apply the concept of so-called materiality (or relevance). The audit profession has learned how to draw the line between what is big enough to matter or small enough to be immaterial. It depends on factors such as the size of the organization’s revenues, its position in society, and the type of the business it is in. Ultimately, it’s a matter of professional judgment which misstatements (or omissions) could affect the decision-making of the users. In addition, materiality is influenced by legislative and regulatory requirements and public expectations. Materiality – defined in the planning phase of the audit – then defines the level and type of testing to be done.

There is a striking similarity between the requirements for financial information and the deployment of algorithms. Algorithms also serve a wide variety of user needs. Some of them may be very critical and have profound impact – such as an algorithm that advises jail sentences based on data – while others are less impactful – such as the Netflix recommendation algorithm that guides you seamlessly into your next binge watch. These differences in potential impact should be a primary driver in determining the materiality of algorithm audits.

Part of assessing the impact of an algorithm is the number of users that may be affected by it. The algorithms determining the newsfeed of Facebook have impact on how hundreds of million users view their world. Even though fake news might not be impactful if it misinforms a single individual, the scale of it is defining for the materiality in giving assurance on the algorithm.

The discussion about materiality might actually provide interesting guidance on another heated debate around algorithms: the norms and values that society expects algorithms to meet. This discussion includes questions like: when is an algorithm good enough? Or, who is responsible if an algorithm fails? Legislation, rules and regulation typically lag behind these issues, caused by technological advances. The burden will probably be on the various courts to set boundaries by means of case law.

Three lines of defense

The three lines of defense model has been around for many years as a design philosophy of how organizations can be in control of (financial) risks. The basic assumption is that senior management needs to rely on the effectiveness of an organization’s risk management that is carried out by functions in different lines in the organization. The model defines the relationship between these functions and describes the division of responsibilities.

The first line of defense owns and manages risks. This is often a business unit responsible for realizing operational and strategic goals. The responsibilities of this line include providing sufficiently reliable information, which means they need to have monitoring and controls in place that makes sure the provided information is indeed sufficiently reliable.

The second line of defense consists of functions that oversee or specialize in risk management and compliance. Professionals in this second line facilitate the first line in areas such as planning & control, financial risk, process control, information processing, etc.

The third line of defense provides assurance by monitoring how the first and second line operate in accordance with the system of controls. The third line also reveals inconsistencies or imperfections in this system and reports to senior management.

This model has become the standard for the majority of large organizations. External auditors base their opinion on how this model works – in some interpretations of the model they are part of the third line. They carry out tests to see the workings of controls and observe how the model works. Their opinion is based on monitoring the processes and controls.

The second line plays a pivotal role in the model. By functioning properly, it provides the first line with advice for the business to perform better (and leaves the primary responsibility for monitoring and control in the business). In addition, it gives the third line the possibility to be able to rely on their work, so that this third line can obtain assurance without building an excessive parallel “control tower”.

What happens if we apply this model to the development and deployment of algorithms? The first line consists of data-analysts and programmers who work on developing, improving and deploying algorithmic applications, their responsibility is to build high quality models and software coding and the use of reliable data. The second line consists of professionals who are responsible for risk management on topics such as security and privacy. The third line consists of auditors whose challenge is to give an opinion on the algorithms based on the control framework that is implemented by the first and second line.

This may sound logical and simple. However, the hard part is to build a framework that ties the first and the second line together in a logical way, as the primary focus of these lines is very different.

The first line is focused on building the best algorithm for a specific need. Professionals are responsible for quality and have a variety of instruments to guarantee this. They organize themselves around functional topics and are responsible for elements such as quality control, architecture, data management and testing in their projects.

The second line aims to be in control of risks, partly based on compliance. In the case of algorithms there are a number of domains such as security, privacy and ethics. Professionals in this line monitor how the first line takes its responsibility to control these risks. Currently, a number of building blocks of algorithmic governance are already in place such as security audits, information security standards and ISAE 3402 statements.

The challenge is to build a framework of controls that seamlessly connects these to the daily work of the first line. This would allow governance of algorithms to be built into the regular processes instead of being added as an extra layer of bureaucracy. Such an additional layer of bureaucracy would be far more destructive for the fast-paced world of algorithm assurance than for the yearly cycle of financial audit.

Nevertheless, in the (financial) risk domain there is already a lot of experience with optimizing the efficiency and effectiveness of the second line. One of the challenges in the financial sector was to “merge” the legal requirements from various different compliance programs into one framework, building a robust but efficient model: “One control for different purposes”. This is very similar to one of the challenges in algorithm assurance, where controls on various layers of the enterprise architecture, like infrastructural controls and data management controls have to be merged into a single framework as well to be able to provide efficient and effective assurance on an algorithm.

There is a lot at stake to get this right. Algorithm assurance is not about avoiding the risks that come with building algorithms or about creating rigid structures that stifle innovation and flexibility. It’s about enabling new opportunities in such a way that a trustworthy outcome is an intrinsic part of the process. In fact, it would probably be better not to speak of three lines of defense but rather of three lines of responsibilities.

Changing the audit profession

This means that the audit profession has to take their responsibility and lead the way in defining principles, guidelines and frameworks that contribute to the need for greater oversight on algorithms. Auditors need to work closely together with developers and data scientists to set the standards for oversight; the complexity of the topic requires a combined effort in an open ecosystem instead of individual auditors trying to reinvent the wheel.

A certain level of understanding is needed for auditors to play this leading role. Some decades ago, there was intense debate on the question if external auditors could carry out an audit around the computer. Nowadays every auditor has a basic understanding of how systems work and how these contribute to a control framework. The same is true for algorithms. We cannot and shouldn’t expect from auditors that they can grasp the logic of what’s under the hood – especially when it comes to advanced examples involving e.g. self-learning algorithms. But we can expect them to grasp how the development and deployment of algorithms can be monitored and controlled. In other words: you don’t need to understand the electronic circuits in your household appliances to understand the need for a circuit breaker.

Successful standards for oversight will guide organizations to gain greater control over their algorithms, and give auditors the opportunity to extend their impact beyond financial statements. They will not be on the seat of the analyst or the programmer and are not going to assess or judge what takes place under the hood. Instead, auditors will represent society in assessing if an organization has taken its responsibility when it uses an algorithm that impacts our daily lives.

Reference

[Verb15] P. P. Verbeek, Beyond interaction: a short introduction to mediation theory, Interactions 22, 3, April 2015, pp. 26-31.

Smart Tech developments changing the real estate industry

Smart Tech in the real estate industry is called PropTech, which includes technological innovations such as big data and data analytics, artificial intelligence, robotics and blockchain. PropTech has the potential to become the new industry standard and may be key in maintaining competitive advantage. However, investing in PropTech requires the industry to have a constant view on innovations.

A strategy to consider when investing in corporate innovation is to partner with innovative technology start-ups. Nowadays industry leaders are actively in search of how to implement PropTech solutions. However, competition may come from outside of the industry. This is illustrated by the vast amount of PropTech start-ups our country is launching. These start-ups are bringing ready to implement solutions in the area of smart cities, real estate investments and sustainability.

The industry should, apart from investing in technological innovation in real estate, also reassess its current business models and value propositions. Fully embracing PropTech requires a culture shift, an open innovation strategy and a workforce with additional skillsets. The industry is in need of leaders with courage and the curiosity to change the status quo.

Introduction

Smart Tech developments are on their way to change many industries, including the property industry. The property or real estate industry consists of real estate developers and builders, housing associations, real estate advisors, real estate investors, real estate financiers and corporates with a large real estate portfolio. Technological and digital innovations relating to property are called PropTech ([Pyle17]), thereby constituting the real estate alternative for Fin Tech. Other terms used as an alternative for PropTech are RealTech, CREtech, ConTech and RETech, often used interchangeably. Examples of technological innovations having an impact on real estate over the coming years include big data and data analytics, whereas artificial intelligence, robotics and blockchain may be of influence in the more distant future ([Pyle17]). The aforementioned innovations have the potential to become the new standard in many other industries as well, including the financial sector.

The difference between Smart Tech in industries other than real estate on the one hand and PropTech on the other is that the latter includes a physical (brick and mortar) aspect. Examples include innovations in manufacturing (3D printing), home appliances (Internet of Things), (smart) city infrastructure and mobility (driverless cars) and solutions to digitally visualize real estate without physically building it (Virtual Reality).

Maintaining a competitive advantage requires the real estate industry to have a constant view on innovations, not only within the limited scope of their own business, but also in adjacent industries. Whereas 92% of respondents in KPMG’s 2017 PropTech Survey [Pyle17] think digital and technological change will impact their business, only 34% acknowledges having an enterprise-wide digital strategy to seize the opportunities that arise. In KPMG’s 2017 technology industry innovation survey [Zann17], 54% of global respondents (mostly C-level) acknowledge that access to alliances and partnerships is a key factor to enable technology innovation.

There are several strategies to consider when investing in corporate innovation: building innovation internally, buying startups or partnering with innovative SmartTech companies. Helping the real estate industry to partner with innovative technology start-ups is what Holland ConTech & PropTech’s Wouter Truffino tries to achieve. He is interviewed by Paul Oligschläger, reflecting on Wouter’s vision and putting it in a broader research perspective.

The interview

What does real estate have to do with IT and Smart Tech solutions?

Wouter: Holland ConTech & PropTech started in May 2015, promoting IT and Smart Tech solutions within the Real Estate industry. We started building an ecosystem, because the construction and real estate sector has been lagging behind in implementing new technologies. At first, we put a lot of effort and energy into inspiring the industry and showing how other industries are changing by implementing technology into their current business models. Nowadays, the inspiration phase has given way to a phase in which boardrooms are in search of the next steps that need to be taken: the ‘why’ question has been replaced by the ‘how’ question. The next steps include engaging employees to start adapting and using technology, as well as figuring out how employees will need to work together with partners, such as start-ups.

Paul: As Wouter mentions, it has taken the real estate sector the past few years to acknowledge that the industry can benefit from Smart Tech. The real estate industry is considered to be quite traditional and can profit from innovation, i.e. in data analytics for mortgage management, predictive maintenance for large real estate portfolios or digitizing production processes. Much can be learned from other industries, such as the financial services industry or the technology industry. From these sectors we have learned that Smart Tech plays a crucial role in innovation.

Which current global developments do you find particularly interesting?

Wouter: The most important global development at this moment is the speed of development in Artificial Intelligence. Machine Learning and AI are likely to outpace the rate of improvement seen in transistor chips (following Moore’s Law), which has been the representation of technological progress for several decades. I think AI is the major development that everybody needs to pay attention to. An example is the start-up Octo, which uses data analytics and machine learning to improve decision-making in asset management. For housing corporations, this would mean that short-term savings can be made on maintenance and inspection costs.

Paul: KPMG has recently conducted a survey of over 300 real estate decision makers to get a better understanding of the adoption of PropTech in the sector. Only 15% of respondents in KPMG’s PropTech survey indicated that AI will have the biggest impact on real estate over the next 5 years. Currently, most leaders in the sector are focused on big data and data analytics (44%) and the Internet of Things (16%), leaving AI in third place. The observed focus on data may have to do with the opportunities spotted by real estate leaders, which are to be found in real-time asset performance data (30%) and customer data (23%) ([Pyle17]).

What companies or trends do you find particularly inspiring?

Wouter: I see a couple of inspiring developments at this moment. They originate from outside the Real Estate industry. The first one is Alphabet (Google). Alphabet’s company Sidewalk Labs is creating an entire smart city using Smart Tech in Toronto. The city itself is a completely new radical mixed-use community. The second example consists of two companies, Amazon and Alibaba. They are using cloud services to map city traffic and improve mobility. I think that these technologies force traditional real estate companies to reassess their current business models and value propositions in order to keep pace with the competition.

Traditional real estate companies are also moving towards innovation. There are some major development going on in the real estate industry itself, for example at two of the largest real estate consultancy firms worldwide: CBRE and Cushman & Wakefield. CBRE is creating a large fund to invest in all kinds of smart technologies and Cushman & Wakefield is working really hard on data innovation.

Paul: As is evident from the examples, innovation may come from another industry. KPMG’s PropTech survey [Pyle17] found that 89% of respondents agreed with the statement that traditional real estate organizations need to engage with PropTech companies in order to adapt to the changing global environment. In the real estate sector, professionals must be alerted that this innovation from outside the sector (so-called cross-industry innovation) may be a threat for their own companies. If industry leaders do not move fast, they might be caught up by new market entrants. These can both be established companies and start-ups specialized in Smart Tech solutions.

Could you elaborate on any inspirational Dutch Smart Tech examples?

Wouter: As mentioned earlier, many large companies are working on Smart Tech innovations. In the Netherlands many start-ups, scale-ups and large companies know they need to innovate, but they need help. Hence the need for ecosystems like Holland ConTech & PropTech, or advisory solutions that help companies to build their internal innovation capabilities, such as KPMG’s Innovation Factory.

In my opinion, a great example of a Smart Tech solution is one in which generative design tools are used to develop neighbourhoods. Generative design helps to create hundreds of design options that you could never fathom on your own, with just one click. In the Netherlands, real estate companies have started implementing this solution together with architects and Autodesk, the world’s largest software company for the construction sector. Another great example is a Dutch Real Estate company, the commercial real estate developer OVG, which is setting new barriers. They are evolving into a real estate developer using smart technology as a unique selling point (called Edge Technologies) within the real estate sector. OVG is the developer of the next generation of Smart Buildings like The Edge and The Boutique Office in Amsterdam.

Paul: Personally, I’m impressed by the vast number of start-ups our country is launching. Some of these are implementing solutions which are directly aimed at the real estate sector, while others are applicable in a broader sense. Examples of these (former) start-ups are Bloqhouse (tokenizing real estate securities issued by investment funds by making use of the blockchain) or Physee (transparent windows generating electricity). Every year we see new initiatives and startups arise, which is why we have been collecting them in our yearly Real Estate Innovations overview [Grün18]. What we see is that some of these startups look very promising, but turn out not to be viable. This may have to do with funding issues, an under-defined value proposition or simply being too far ahead of the market. However, some of the start-ups succeed and might gradually transform the industry. This is why it is crucial for the industry to keep investing in innovation.

C-2018-2-Oligschlager-01-klein

Figure 1. Thematic overview of innovative PropTech companies ([Grün18]). [Click on the image for a larger image]

How can companies successfully embrace innovation in Smart Tech?

Wouter: It’s a culture shift, which requires additional skills. We interviewed several CEOs within the Dutch industry. Many of them stated a need to start working on social innovation, meaning smarter working, dynamic management and flexibility in the organization. Since the technology is already out there, it is all about scaling. Employees must embrace technology and should not be afraid to lose their jobs due to Smart Tech implementation. Technology will make work easier by doing repetitive work in a matter of seconds or by making data smart. This way, the future of work changes and shifts towards value-add activities. Successfully embracing innovation requires action, massive action, which is all about culture, mindset and positive energy.

Paul: Managers from real estate companies should understand the need to innovate. The real estate industry is in need of leaders with courage and the curiosity to change the status quo. This is hard in times of financial crises due to the lack of investment capital, but nearly as hard in times of economic prosperity due to the lack of skilled people. Moreover, as stated in the introduction, innovating is hard when a company lacks the skills to manage innovation. The shift towards Smart Tech requires tech savviness in a company’s workforce. Besides, firms fear what they don’t know ([Kali16]). When asked about nine innovating topics, including AI, Internet of Things and Robotics, the management of a broad set of companies from various sectors including the real estate industry answered that they did not plan to implement these emerging technologies ([Kali16]). The big question is: ‘What is the reason behind this attitude?’.

KPMG’s European innovation survey [Kali16] revealed that the most observed challenge across a mix of industries including real estate was the lack of people inside the organization who have the skillset to manage innovation. If we consider this laggard attitude on implementing new technologies with respect to Smart Tech solutions we can conclude the following: if an organization lacks the skills to master Smart Tech, then innovating in Smart Tech will not go beyond the stage of mere theoretical strategy design. I think real estate companies should permanently have an open attitude towards innovation, whether by means of putting innovation on the strategy agenda when reviewing their business plans or attending meetings that bring together innovative start-ups with established companies, as Holland ConTech & PropTech is doing. They should also use KPMG’s Innovation Factory’s Three Stage Challenge Approach (prepare, run, select, to accelerate success and return on investment in innovation) in order to build innovation internally. However, it all comes down to leadership leading innovation and understanding the importance of innovation in an industry that has the potential to thrive by making use of Smart Tech.

What do you consider to be the next step?

Wouter: Larger organizations must realize that they have an opportunity to scale technology within the market. They know the industry, understand how it changes and know its potential. If they have an open innovation strategy in which it is possible for all kinds of new solutions to leverage APIs, they can dominate the market by creating new business models by using technology. This would be an open model into which new start-ups, scale-ups and technology companies or new technologies can easily be incorporated. The winners of tomorrow will be corporate organizations that are able to create new business models based on technology and start scaling new business opportunities.

Paul: I think the first step in real estate will be to make real use of data-driven insights, specifically the application of predictive analytics. Different data sources such as sensor data (office occupancy, energy usage), rental contract data, specific property data and external data are currently already combined into interactive dashboards. These could be improved and enriched by analyzing large volumes of data, in order to predict when maintenance is likely to be necessary. This creates real insights and competitor advantage. This may seem obvious, but generally real estate companies could better leverage data, both still to be collected and data already collected. Apart from this, I think the real estate industry should take a close look at how other industries, such as the financial sector are innovating, and how to translate innovations and innovative ways of financing to the real estate industry.

C-2018-2-Oligschlager-02-klein

Figure 2. Headline results of the KPMG Global PropTech Survey 2017 ([Pyle17]). [Click on the image for a larger image]

Bloqhouse

Bloqhouse is a Dutch-based startup founded in 2016 and makes use of peer-to-peer blockchain networks. Issuers of securities, such as real estate investment funds, use Bloqhouse’s software to tokenize the assets in a legally compliant manner. Investors owning a token can trade directly, transparently and securely with other investors. The investor administration is managed by a smart contract on the blockchain. A smart contract enforces a transparent and trustworthy registration of investors as well as legally binding transactions between investors. ​Bloqhouse also offers know-your-customer (KYC) and investor on-boarding modules.

References

[Grün18] Sander Grünewald, Paul Oligschläger and Sybren Geldof, Real Estate Innovations Overview, KPMG Real Estate Advisory, https://home.kpmg.com/nl/nl/home/insights/2018/05/real-estate-innovations-overview.html, 2018.

[Kali16] Jerzy Kalinowski et al, European Innovation Survey, KPMG, https://assets.kpmg.com/content/dam/kpmg/nl/pdf/2016/advisory/KPMG-European-Innovation-Survey.pdf, 2016.

[Pyle17] Andy Pyle, Sander Grünewald and Nick Wright, Bridging the gap. Global PropTech Survey, KPMG, https://assets.kpmg.com/content/dam/kpmg/uk/pdf/2017/11/proptech-bridging-the-gap.pdf, 2017.

[Zann17] Tim Zanni and Patricia Rios, The changing landscape of disruptive technologies, KPMG, https://assets.kpmg.com/content/dam/kpmg/tw/pdf/2017/04/changing-landscape-disruptive-tech-2017.pdf, 2017.

About the interviewee

Wouter Truffino has been named in ‘the top 10 International PropTech Influencers 2017’, one of the 50 Future Creators of the Netherlands, a High Potential in 2018 by leaders in Real Estate and is a welcome guest on the Dutch radio at BNR. Wouter started to build the first ecosystem in ConTech (Construction Technology) and PropTech (Property Technology) in the Netherlands in May 2015. Holland ConTech and PropTech were born.

How to build a strategy in a Digital World

Digital technology is everywhere. Literally. As a consequence, companies need fully embrace the digital transformation. To succeed, it is no longer sufficient to optimize front offices and increase customer experience by using digital tooling. Instead, companies need a solid enterprise-wide transformation to reap the full potential of digital. Vattenfall Heat and KPMG recently teamed up to explore and define a digital strategy and road map to this end, thereby also creating the energy as a kick starter for change. This article analyses how to start such a digital journey.

Introduction

Digital transformation is the name of the game these days for many organizations. The background of this is a wide and impressive range of new (information and communication) technologies that have a growing impact on business models, value chains and customer behavior.

Extreme expectations

Several trends that affect business are a move towards a networked society with an exponential growth in the quantity of data, a continued increase in processing capacity and a world in which everything is connected. This cocktail of technological developments provides new opportunities to convert data into valuable insights and new or enhanced services. In a somewhat broader sense, technology is playing an increasingly prominent role in society and is now manifest in nearly everything we do. It is now completely integrated into our daily lives – even in a physical sense – and, as such, is no longer merely an add-on. In relation to this there is also the emergence of an era of extreme expectations where customers simply expect the highest level of service at low cost.

In conclusion, there is no doubt that digitization is very demanding for companies. It impacts all aspects of business – not only a company’s products and services, but also its delivery models and modus operandi.

Strategic compass

A generic advice is that companies need to be (extremely) flexible and agile in the current era. However, this by no means implies that they can manage without a strategy. In fact, in turbulent times they need a strategic compass more than ever. The Board of Vattenfall Heat Division is fully aware of this. As stated earlier, the company is confronted by major changes in several domains. Sustainability developments call for strategic and operational changes, customers demand best-in-class interactions and new technology has the potential to disrupt the current business model. Traditional organizations must be aware that customers have become accustomed to a range of new options and expect that every well-organized organization offers them services and products with the same seamless and simple interfaces. This customer centricity also leads to new expectations with regard to flawless operations. This means that digital impacts not only the front-end of operations, but also the rest of the value chain (see Figure 1). During recent years a number of technologies have become more mature, for example:

  • Robotic Process Automation (RPA);
  • Data & Analytics;
  • Internet of Things;
  • Artificial Intelligence;
  • Virtual Reality;
  • Blockchain;
  • Industry 4.0;
  • Platform Business Models;
  • New ways of working, such as Agile.

C-2018-2-Koot-01-klein

Figure 1. Changes of digital over time. [Click on the image for a larger image]

How to get started?

The key question was: ‘how can Vattenfall Heat anticipate on these breakthrough technology developments?’. The answer is of course not an easy, straightforward one. Moreover, defining a strategy is just the first step in transforming the business. As the famous management thinker Peter Drucker once said: ‘strategy is a commodity, execution is an art‘. How did Vattenfall get started?

First of all, a bit of background. Vattenfall Heat delivers heat to residential and corporate clients in Germany, Sweden and the Netherlands. In recent years, the company has been active in many digital initiatives and has been working on innovations in several areas. Nonetheless, management felt that a more consistent and focused vision on the opportunities and threats was needed to be prepared for future changes and thereby reach the next level of maturity in the digital transformation.

C-2018-2-Koot-02-klein

Figure 2. Examples of digital options. [Click on the image for a larger image]

We started with some hypotheses to increase the awareness and the level of understanding of the profound impact digital technologies and the increasing speed of innovation could have not only on future market scenarios, but also on current operational processes. Some scenarios that were considered:

  1. End customers of Vattenfall Heat have an economically viable alternative to city heat (i.e. decentralized solar energy for zero marginal cost);
  2. New intermediaries (Energy-Tech) take over the contact with customers through integrated consumer services across multiple energy suppliers;
  3. Regulation forces Vattenfall to license heat providers to use the grid that’s already in place (an analogy with how the world of TelCo’s changed);
  4. Regulation forces Vattenfall to provide their customer usage data to other third parties when a customer gives permission for this (an analogy with the effect of PSD2 in banking);
  5. Regulatory pressure to accelerate decarbonization in a much faster timeframe.

In a seamless cooperation, KPMG and Vattenfall Heat managed to achieve this in a time frame of only two months. The joint project team delivered a strategy including a roadmap and a number of concrete initiatives. In doing so, management obtained a clear overview of the current Digital Project Portfolio and the need for transparency and portfolio management and an understanding of the necessity for future IT application landscape harmonization and Data Maturity improvement. This was in fact quite challenging because one of the challenges along the way was that some of the people involved lacked a deep understanding and knowledge of digital technology and innovations. This makes sense as these topics play a minor role in their current working environments. We therefore had to put quite some effort into getting them ‘educated’ and up to speed.

Specific initiatives include the start of robotics (digital labor), PoCs for operational excellence and breakthrough digital-platform initiatives and a specific proposal for the minimum expansion of Digital Competences.

This is of course not the endpoint of a strategic journey. Rather, it is the end of the beginning as the implementation still lies ahead. Looking back on this first part, we can distinguish a number of important topics and lessons learned that we would like to share with our readers.

1. Wear your holistic glasses

Achieving a sustainable competitive advantage may have been possible by some relatively easy restructuring of customer-facing functions in the early days of digital technologies. However, nowadays we need an enterprise-wide digital transformation and a restructuring of the middle and back office as well. We put this in place at the start of the project.

C-2018-2-Koot-03-klein

Figure 3. Digital ambition Vattenfall Heat. [Click on the image for a larger image]

Everything starts with the customer, who is at the center of Vattenfall’s digital ambition and is the first domain in the digital ambition. The goal is to offer effortless comfort for the customer and thereby a sustainable 5-star home climate experience. To live up to this promise, Vattenfall needs an integrated – holistic – approach, covering four additional domains.

The second domain is probably being the most obvious: optimizing data-driven operations. Advanced analytics contribute to more efficiency and effectiveness in operations and robotic process automation offers new potential in this domain.

The third domain is closely related: the design and implementation of a sound technical foundation. Not only in terms of hardware and infrastructure, but also in terms of competencies.

The fourth domain is to create a wow-culture: a culture that nurtures entrepreneurship, creativity, learning and safety.

Finally: the fifth domain stresses the need to think about possible future scenarios: ‘reimagining’ current business model because breakthrough concepts may turn out to be disruptive forces in the (near) future.

The broad scope of these five domains of the digital ambition shows the need for a holistic approach. In fact, one could argue that we are shifting from a digital strategy towards a strategy for a digital world. This may sound like a nuance but in reality, these are two very different things. Until recently, companies defined a strategy for digital which was more or less isolated from the general strategic objectives. ‘Digital’ was somewhat exotic. Nowadays, companies must use a holistic lens to view all opportunities and challenges that are at stake in a world where digital is simply the new normal. Digital is definitely more than marketing and definitely more than IT. Not everyone fully realizes this.

In fact, the various elements of the two-month program made tremendous contributions in this respect. We offered inspiring views of future scenarios, which unlocked enthusiasm and awareness on the major importance of digital transformation. Moreover, this program also contributed to a better understanding of the (practical) implications of a digital transformation. Managers started to see how the interconnectedness of the elements was vital for successful change. We helped them to gain more insight into the consequences by focusing on a future position and defining what was needed to work towards this position. In conclusion, one of the major results of this was that managers started to see what the ‘connecting tissue’ between various projects and developments was and how they can contribute to success. To make sure that it is not just a one off, Vattenfall must continuously work on keeping (middle) management involved.

2. Use a structured but Agile approach

At the start of the project, Vattenfall was already active in many digital initiatives. However, management still needed to focus on the topics that matter most and at the same time there was uncertainty about missing crucial developments. This was the starting point for a structured approach to challenge the organization, both top-down and bottom-up.

The project started with interviewing key people. During these interviews, they were pushed hard to think about the digital strategy. One of the instruments to do this was to ask them for a quantified rating on several questions. This enabled a more structured evaluation of the content of the interviews, whilst at the same time leaving room for an open dialogue.

C-2018-2-Koot-04-klein

Figure 4. Approach. [Click on the image for a larger image]

Digital leaders were appointed throughout the organization to provide sufficient room for bottom up ideas. This proved to be a good instrument for empowering the organization in formulating a strategy.

Subsequently, various presentations were held by key people from the various divisions in the organizations and a workshop was organized to structure thinking about possible scenarios and to define ambitions.

Taking this approach, during the two months we managed to get more focus on the digital strategy. Looking back on the project, we see the following prerequisites that are probably also valid for other organizations:

  • a combination of top-down and bottom-up input;
  • the cooperation of a blend of functional expertise, which is vital as a digital strategy has consequences for nearly all functions within the organization;
  • the power of a ‘don’t tell, but show approach’ to convince and inspire people.
3. Be aware that ‘thinking is doing and doing is thinking’

In a world of continuous and rapid change, some argue that doing is the best kind of thinking. Since we can no longer define blueprints for the future, the only way to be successful is to continuously experiment and learn. Point taken.

However, the opposite is also true. Thinking is doing. We found out that intense dialogue during the sessions was very valuable. In fact, sometimes it was confrontational in a positive manner. Talking about the consequences of a digital strategy – for instance ‘working agile’ – may sound easy and logical in theory, but the real challenge, of course, is turning promising words into practice. The same is valid for processes that may at first glance not be within the scope of a digital strategy, such as financial administration. The reality is that a dedicated focus on customers and their expectations also calls for swifter and better financial processes.

Deeper thinking and dialogue does not only bring awareness. We also experienced that actively and deeply exploring the consequences of such topics led to an enthusiastic ‘action modus’ amongst participants. Having said that, it is an ongoing challenge to provide sufficient resources – both in terms of high level knowledge and hands-on capacity – for the transformation.

4. Excel in the balancing act between how and what

The overall digital ambition of Vattenfall Heat is to actively contribute to ‘power climate smarter living’. During the process, we have defined five pillars to achieve this: customer growth, create a sustainable portfolio, drive innovation, improve performance and develop our team and culture.

These five pillars show that a digital strategy is both about how and what. The first three pillars contain specific goals and initiatives with regard to ‘what’. The last two address the ‘how’ and these may in fact be harder to achieve, as these require organizational change. It may even be necessary to alter the DNA of an organization.

Experience shows that organizations tend to focus on the ‘what’ of the digital ambitions, while underestimating the consequences for the ‘how’.

5. Make sure to focus

Although a digital strategy is broad by its very nature, one of the pitfalls is to define too many initiatives. In fact, one of the hardest parts is to prioritize. One of the concepts that helped us to do this was to define three horizons for the route-to-digital. Horizon 1 contains the incremental improvements for the business (do things better) that need attention right now. Horizon 2 is all about changing the current business in the next three years (do things differently). Horizon 3 is about a real transformation of business in the future beyond this with new industry models (do new things).

In fact, focus may be the key challenge in the next phase of the project. We now have elaborated and detailed insights into the potential of going digital. The next phase is to work according to the mantra ‘less is more’. Vattenfall Heat must focus on a limited number of topics to make sure that the organization has some tangible ambitions. At the same time, this reduction should not lead to oversimplification.

C-2018-2-Koot-05-klein

Table 1. Different horizons of digital. [Click on the image for a larger image]

6. Beware of silos

As stated earlier, a holistic view is essential. This holistic vision of an integrated value chain needs to move from theory into practice. Vattenfall Heat is active across the entire spectrum from production to customer service and thereby has the potential for cost savings and service improvements based on data gathered from various functions and processes. More insights into customer behavior may for instance contribute to a lower intake of heat in production. This all sounds like straightforward logic but in practice these simple concepts may turn out to be very challenging as they require seamless cooperation between organizational silos. For many years, working in silos worked well. However, going digital brings a profound need to break down the walls between departments (and geographical Business Units). This continues to be a challenge as it will take time to really tear down these walls.

To conclude

Vattenfall Heat has now successfully finished the first part of an ambitious digital journey. This project brought focus to its digital ambitions and initiatives and delivered actionable insights. We are convinced that the company can become a front runner in the industry based on this.

One of the challenges will be to keep the energy and focus of (middle) management at the same level that it was during the initial inspiring and energetic program. Based on our experience in the project, the fundamentals for succeeding with such initiatives have improved. We therefore trust that Vattenfall Heat will be able to transform itself into a future-proof company, ready to deal with the major impact of a digital world.

Common challenges in responding to digital disruption

Based on our experience, the following challenges play a role in preparing for a digital landscape:

  1. lack of vision;
  2. poor understanding of the impact;
  3. insufficient sense of urgency;
  4. culture resistance;
  5. lack of funding;
  6. lack of critical skills.

Master Data Management as a Global Business Service

Many organizations are on a journey to standardize and optimize their businesses in order to save costs and provide a better service to their customers. Master Data Management (MDM) should not be neglected on this journey. This article aims to convey the importance of master data management (MDM), to give practical guidance on how to service this as a global business service, and which prerequisites and pitfalls are relevant and need to be taken into account.

Introduction

Master data is basic business data that is used in common processes in each organization. Examples include the parties a company is doing business with (e.g. customers and vendors), locations where work is performed, or parts are stored (e.g. offices, warehouses) and the materials used or created during production processes (e.g. (raw) materials and products). Master data is everywhere and serves as the foundation for business processes.

To be able to successfully standardize or optimize business processes according to global standards, master data should be of high quality and conform to global data standards. For example, when working towards a centralized purchasing strategy, the master data within the source-to-pay process should be standardized, be consistent and of high quality to facilitate this. Managing this master data is therefore essential when organizations embark on this journey.

One of the means to facilitate the standardization and optimization of certain business processes is setting up Global Business Services (GBS) for MDM. GBS is a next-generation operational and organizational model that enables organizations to deliver business processes such as HR, finance, IT, and customer care to internal and external customers. It is often applied on a global scale using multiple service delivery models, including outsourcing, shared services and, increasingly, cloud solutions ([Brow16]).

Master Data Management

Master data

Defining master data is complex. Therefore, a simple guidance should give more clarity on what could be classified as master data. Figure 1 can be used to define your master data.

C-2018-1-Staaij-01-klein

Figure 1. Characteristics of master data ([Jonk11]). [Click on the image for a larger image]

However, there is no universal view on what can be considered as master data. Master data is by nature complex, especially when data needs to be standardized throughout different businesses within an organization. Some examples:

  • After the creation of master data, it runs through different parts of business processes (e.g. material master data is used in procurement, supply chain and finance);
  • The complexity of business processes is often reflected in master data (e.g. multiple variants of the same procurement process results in a different setup of a vendor master or purchasing info records);
  • Many definitions exist throughout the organization (e.g. no single definition to define a material).

Master data management

Master data, which is complex and greatly affects business processes, needs to be managed properly. This challenge becomes especially real when organizations are on a journey to centralize and globalize their business.

But is there really a need to centralize and standardize all master data? The answer is no, in the same way that it is not required that all data needs to be maintained centrally. Multiple factors influence the best organizational model for companies to govern their master data versus the maintenance of their master data.

To understand the concepts of this article, elaborating on master data management as a global service, the following principles should be taken into account:

  • Data governance needs to be organized top down from a strategic level ([Unen12], [Staa17]). Meaning that classifying data as global and deciding on how it will be governed and maintained is a strategic decision;
  • Data should always be owned by the business ([Jonk11], [Staa17]). Nevertheless, even if master data is governed centrally or even maintained centrally, ownership always remains within the business.

One part of master data management is to define which data to govern centrally or maintain centrally. More details on how to define these types of data and define the best organizational model is discussed in the article [Staa17] on organizing data management activities. Master data management is of course much broader. Master data management, in a nutshell, refers to all the processes, governance structures, content and quality of the data in place, including facilitating tooling and IT systems to ensure consistent and accurate source data for all business processes ([Jonk11]).

C-2018-1-Staaij-02-klein

Figure 2. KPMG’s Master Data Management framework. [Click on the image for a larger image]

Global Business Services

The scope of Global Business Services within organizations is growing intensively. Where GBS are established to deliver, mainly operational, services; more and more organizations are implementing a global process owner structure within GBS, to facilitate or even enforce standardization and optimization within business processes. These so-called Expertise Centers are responsible for embedding these standard global business processes throughout the entire organization.

The ambition of organizations which are on the journey of centralization and standardization and even have the GBS capabilities in place, cannot neglect the importance of MDM. It is not only a necessity, but also an opportunity for GBS entities to deliver MDM as a service to the organization. Therefore, GBS is the perfect platform to enable best-in-class MDM throughout the entire organization ([Brow16]).

Master data management as a global business service

It is not necessary to centralize all MDM related activities to Global Business Services. To get started, the most relevant master data, which has the largest impact on global and standardized business processes, should first be identified. In a previous article [Staa17], we elaborated on defining which data should be centralized within a global data management function, or which data to ‘should be left to the business’. In this section we do not attempt to identify which data should or should not be centralized, but which services can be provided and how to organize Master Data Management as a global business service.

Master data services

Maintaining master data often constitutes a large portion of the work within a business; from the create, read, update and delete (CRUD) processes to mass changes, data cleansing and data migration. Especially when these activities are repetitive, they can be nominated to be performed by GBS. In turn GBS would deliver these standardized services in a service level agreement.

Besides these repetitive activities, GBS are increasingly positioned to provide Expert Services to facilitate and even enforce MDM standards, organize governance and even report on and manage and monitor data quality.

Global Business Services for Master Data can therefore be split into two types:

  • MDM Expert Services fulfills a business partner role for MDM (e.g. MDM Demand Management), drives continuous improvement and provides MD(M) expertise and support to the Global Process Owners and the specific business;
  • MDM Operational Services provides operational services (e.g. maintenance of master data, data quality checks and cleansing services), and ensures service agreements are in place and processes exist to manage requests, incidents and changes. It also ensures the performance of MD operational services in accordance with agreed targets.

A brief elaboration of these services and their value is given in Table 1.

C-2018-1-Staaij-t01-klein

Table 1. Master data services. [Click on the image for a larger image]

Master data services operating model

The operating model for Master Data Management is by design split into two categories: operational and expert services. These expert services need close alignment to the global business process owners to facilitate and advise on everything that is required with regard to MDM in their processes. Operational services, on the other hand, can be nearshored, offshored or outsourced to cost efficient countries, if the processes are mature enough. This directly impacts part of the quantitative business case for providing MDM as a service, because a business case for merely MDM is most often of a qualitative nature ([Staa13]). The main indicators to calculate the quantitative business case are:

  • FTE reduction, giving back time (improving processes/performance) and focusing on first time right;
  • eliminating business errors/disruptions due to incorrect master data;
  • FTE to low cost countries by nearshoring, offshoring and outsourcing.

GBS is often hierarchically positioned as a staff function at the corporate level. Meaning that the mandate is often limited to providing services to and facilitating the business. The main challenge to transfer MDM services within GBS is interaction with the business and enforcing process and data standards in existing business processes. A simple example is using the same procurement principles (e.g. payment terms) throughout the organization.

Proper governance in defining GBS’ role and accountability towards master data is a prerequisite to be successful in this. When governance is not in place, MDM within GBS will fail. On the other hand, if the governance between GBS and the business is not in place for global process ownership, it will also fail.

Therefore, MDM should be organized in the same way as the global process ownership operating model within the organization.

C-2018-1-Staaij-03-klein

Figure 3. MDM Services Operating Model. [Click on the image for a larger image]

The model in Figure 3 reflects the split between MDM Expert Services and MDM Operational Services. It is very important to detail how MDM within GBS can facilitate the global process owners and how it will deliver services to the business.

Prerequisites for success

To successfully implement and enforce standards within the organization, it is important to consider the following:

  • Sponsorship at the C-level: in the executive committee there should be at least one member who is accountable and provides sponsorship for MDM. Getting things done on a global level is difficult and challenging and almost always requires assistance from the C-level;
  • Awareness throughout the entire organization: ‘what’s in it for me?’ is the most frequently asked question in the business. Showing the impact with facts and figures is therefore a great way to create awareness. Involvement and support of local organizations is crucial and should not be underestimated;
  • Facts and figures: simply stating that MDM is important, does not create a sense of urgency amongst employees. Though they generally understand this better than a much of the senior management. Showing facts and figures and as soon as possible creating data quality, process quality and business impact dashboards (related to master data errors) does and therefore is of great importance;
  • Make use of existing MDM expertise in the organization: organizing MDM as a global business service does not mean you have to start from scratch. Organizations often already have global or semi-local data management offices and functions. The knowledge already resides in the business, so it is a prerequisite to use this expertise in the new organizational setup;
  • Mature and organized GBS: a clearly defined process and governance of an existing GBS organization supporting its business is a prerequisite to be successful in MDM serviced from GBS.

Pitfalls and challenges

Although recognizing the above design principles and prerequisites to be successful, there are pitfalls that need to be taken into account. In KPMG’s experience the following pitfalls are most the important:

  • Change management: implementing MDM as a global business service will affect people. Not only will the organization structure change, but people’s jobs will also change. Especially when nearshoring, offshoring or outsourcing activities to low cost countries, jobs will be lost on-shore. Since people in their current positions fulfill an important role during transition activities, an effective change management strategy needs to be in place;
  • Ownership and leadership: clear ownership and leadership also needs to be in place during the pre-stages of the setup of MDM within GBS. Not only to facilitate and hold discussions but also to setup a proper landing organization;
  • Lift and shift versus fix and shift: standardized, well documented and efficient processes are easy to transfer to other parties inside and outside the organization. It is often the case that this is not in place. There are multiple strategies that define what to do when to-be transferred processes are not of sufficient maturity, or simply when tacit knowledge is of major importance in execution, and this cannot be standardized or documented. The dilemma is to choose between ‘lift and shift’ (transfer processes as-is) or ‘fix and shift’ (optimize processes before transferring). ‘Lift and shift’ gives a clear scope and the ability to fix during or after the transfer. ‘Fix and shift’ delays the process of transition and does not take global standards into account. This means you often have to apply a fix again after the transfer is complete;
  • Focus on both qualitative and quantitative benefits: of course cost reduction is one of the tangible goals of a GBS organization, in moving activities to low cost countries. This is a large part of the quantitative business case for MDM as a global business service. But really the main business case is qualitative. Being able to standardize and deliver expertise services to help the organization to improve, adds far more value;
  • Too optimistic in near/offshoring and outsourcing opportunities: the connection and relation to the business (end-users) is key in MDM. You are servicing the business in managing their data properly. You have to take into account the quality of the service provided by a near/offshore or outsource location. The distance to the business is potentially much greater, as well as the business knowledge needed to perform certain activities. Especially when MDM is not yet mature, transferring these activities to low cost countries before a proper transition is in place, is a large risk for success. This will affect part of the quantitative business case, but from a qualitative perspective it makes sense to optimize first before using near/offshoring or outsourcing options;
  • Formalize the service model and accompanying service levels: delivering services needs to be formalized with regard to accountability and responsibility. Two primary questions are relevant here:
    • Who is going to pay for the service and how are prices set?
    • How can the quality of the service be guaranteed?

    Both questions should be answered in a formalized service model with accompanying service levels on both the processing time and the quality of the work. The service model should define the mutual accountabilities in delivering the service.

Conclusion

MDM is a prerequisite for an organization’s journey towards standardization and optimization of their business. It is a major opportunity to approach MDM from a global perspective to facilitate this journey. Setting up MDM as a global business service is therefore a good strategy to choose. In this article we have seen that there are important prerequisites to be successful, and multiple pitfalls to be overcome when servicing MDM. But when organized properly, MDM as a global business service is something that all organizations striving towards standardizing and optimization of their business should think about.

References

[Brow16] David J. Brown and Stan Lepeak, Master data management. A critical component of Global Business Services for improved decision-making KPMG, 2016.

[Jonk11] R.A. Jonker, F.T. Kooistra, D. Cepariu, J. van Etten and S. Swartjes, Effective Master Data Management, Compact 2011/0.

[Staa13] A.J. van der Staaij MSc RE, M.A. Voorhout MSc and S. Swartjes MSc Master data management: From frustration to a comprehensive approach, Compact 2013/3.

[Staa17] A.J. van der Staaij MSc RE and drs. J.A.C. Tegelaar, Data management activities, Compact 2017/1.

CFO? CIO? The world needs a CHRO!

The expectations of Millennials about their work environment, labor shortages, changed expectations of HR service delivery and of course the opportunities that robotics, enabling technology and data analytics offer, force organizations and HR in particular to adapt and prepare for the future. A future where people take center stage, because they add unique value to the organization.

Since people are one of the most important resources for the organization, they require a Chief HR Officer to be a strategic partner in the Board of Management and to support topics that are becoming more important for them, such as talent management, strategic workforce and succession planning. To meet the new expectations and offer suitable HR services, organizations can no longer hold on to the classic Ulrich model.

The future of HR demands an HR model that can quickly change along with economic and technological developments, on a large scale, and without restrictions. Roles as architects and multi-disciplinary teams enter the arena, to benefit from new technologies. Organizations cannot afford not to embrace change, if they want to avoid being overtaken by the competition.

Changed expectations and influences increase the value of people

What is the most important resource impacting organizations in our knowledge driven economy, but also in transport and logistics, healthcare and any other sector? People. It is not production or operations that allow the organization to function, these have probably already been automated or robotized, as in the automobile and chemical industry. The unique value that organizations are always looking for, are people. They are the ones who constantly translate customer needs into new product and service offerings, search for innovations that makes their organization stand out and make improvements through their knowledge, skills and experience.

For the new workforce generation, the so-called Millennials, it is all about flexibility and mobility. The Millennials work to live the life they want to lead, with a good work-life balance, a job where they can contribute to society and be heard by their boss. When the job does not fulfill their requirements, the Millennials will go and look for another one that does, as shown by research done by, amongst others, Pew Research Center and Deloitte ([PEWR10], [DELO16]). The economy is now picking up and there is a labor shortage. These changes in society and economy influence the workforce and succession planning of organizations. These need to deliver a top performance and be innovative in order to recruit and preserve top talent.

At the same time, organizations search for more ways to meet the goals and expectations of stakeholders. Expectations such as turnover and profit, increasing volumes and share prices. Organizations therefore outsource their processes, to save money or focus on core activities. This also applies to HR processes, as Unilever and ABN Amro have done. Others do so by applying Lean principles and creating predictability. Where possible, processes are standardized and made more predictable to enable digitalization and a reduction of human labor. Even though the unique value of organizations are its people, they are also often an expensive resource, the least predictable and require the most care.

Adding value is not only about producing and delivering more, faster and meeting financial goals. It is also about satisfying and delivering on customer expectations. Where we use ‘Customer Experience’ for most services, for HR we talk about the ‘Employee Experience’. Research from KPMG Nunwood ([Conw16]) shows that organizations with good customer ratings, also score better as a great place to work.

The employee experience has to meet expectations on product and service offerings, the way these are available, how and how fast processes can be navigated, and the freedom of choice employees have. They expect nothing less of the HR function than they would as a regular customer: digitalization, availability anytime, anywhere, and everything can be customized. Think of mobile apps to register worked hours and time off, onboarding apps with information on the new team, access to training and knowledge sharing, short lead times for recruitment and using online games instead of selection based on a motivation letter and CV.

It is no surprise that there is more focus, or more focus needed, from the Boards of Management (BoM) to keep this so important resource healthy, happy and successful. Organization-wide HR topics such as talent management, strategic workforce and succession planning, vitality and performance management are constantly high on the C-level agenda.

The world needs a CHRO

These HR topics, on the BoM agenda, change the position of the Chief HR Officer (CHRO). In the past years, the role of the Chief Information Officer (CIO) has already changed under the influence of digitalization. Often, organizations also have a Chief Digital Officer, whom is placed next to or above the CIO in hierarchy, as researched earlier by KPMG ([HARV14]). IT as a function, where this is a supporting function, has become part of regular operations. Traditionally, the Chief Financial Officer has a leading role on operations, within the BoM. However, Finance also has a supportive function within the organization. In our experience, when optimizing and robotizing processes, it are especially the predictable finance processes, including procurement, contract management and reporting, that can be robotized well. Processes and analyses that were previously seen as essential and leading for good governance, and therefore typically work for humans, can now be performed by robots. Taking decisions based on analyses, decisions on investments and innovations, or determining added value are typically not replaced. That is still considered human labor. The CHRO’s position will therefore grow stronger, at the expense of the CFO, since it is the CHRO who can give guidance to the organization’s future and success, with his vision on HR and approach to the most important HR topics that influence the employee experience.

C-2018-1-Leeuw-01-klein

Figure 1. Classic Ulrich model. [Click on the image for a larger image]

All this requires a different organization of the HR function. Most organizations have strived for the Ulrich model for their HR. This model describes four roles in HR. According to Ulrich, each role has a specific set of activities, such as administrative, supporting tasks in the shared service center and strategic HR advising by the Business Partner. Many organizations have never been able to fully implement the model, causing the four roles to exist next to each another as silos.

C-2018-1-Leeuw-02-klein

Figure 2. Prevalent HR model. [Click on the image for a larger image]

Organizations need to move to a more dynamic, adaptive model, to provide for the changing HR needs of employees, quickly and on a large scale. A boundary-less model, where teams and roles work together, either human or robot, would work well to integrate all the available opportunities. Intelligent automation, such as enabling technology, robotics and data analytics are ways in which this boundary-less service delivery is possible. It should be used to fulfill the most important HR topics and help realize the goals of the CHRO. Organizations simply cannot afford not to embrace these new technologies for their service delivery if they want to be prepared for the future.

C-2018-1-Leeuw-03-klein

Figure 3. KPMG Boundary-less HR model. [Click on the image for a larger image]

KPMG research suggests that 92% of organizations that view HR as a key business function, expect Intelligent Automation to have significant impact on the HR function ([KPMG17-1]). And 65% of CEOs see technological disruption as an opportunity, not a threat ([KPMG17-2]).

Enabling Technology is vital for a good Employee Experience

Enabling Technology describes all applications and systems intended to support the HR processes in such a way that employee expectations can be met. Processes are made more efficient and more effective through the use of enabling technology. It allows processes to be run anywhere, anytime, make changes, request new services and check statuses. An employee can register his working hours via an app on his mobile phone and view overtime or personal time off.

Operational processes are essential for the entire employee experience and other strategic organization-wide programs. For example, recruited talent can be given direct access to all kinds of information via the onboarding app. This facilitates onboarding processes such as data entry, testing, training and scheduling appointments to collect laptops and mobile phones and gives the employee a jump-start. This contributes to the employee experience, but also to the productivity of the employee. 36% of organizations expect to deploy enabling technology for HR, while they redesign their target operating model. Primary areas of focus are Talent Management (61%) and Recruitment & Onboarding (57%) ([KPMG17-1]).

Workflow tools and HR systems such as Workday, ServiceNow and SAP SuccessFactors are examples of Enabling Technology. Mobile apps are another example of Enabling Technology.

Recruitment at KPMG becomes an experience with Harver

KPMG Netherlands wishes to improve the experience of candidates during the recruitment process by implementing the Harver ‘Talent Pitch Platform’. With this platform, KPMG digitalizes a large part of the selection process. Candidates go through an ‘experience’ of about one and a half hours where they are tested on suitability for a job at KPMG. Whereas traditionally the information during the recruitment process is one-sided from the candidate, the platform can be used to extensively inform the candidate about KPMG topics. Job interviewing is less bound by time and place with this platform, which is in line with the needs of ‘the Millennials’, the new workforce generation.

Gamification is also a trend that is found within the platform. Traditional capacity and personality tests are replaced by playful tests and there are integrated games that simulate dilemma situations someone might encounter at KPMG. The candidate has to choose the most effective solution in the given situation using the information provided. KPMG can evaluate how well someone judges situations and how adequately they react.

The selection criteria have initially been set together with a psychologist, but by applying Data Analytics, these can be adapted in the future. By combining performance data of employees with data from the platform, it can be determined what the actual success factors are for success at KPMG. Candidate selection is made a lot more valid than the current subjective way, based on motivational letters and CVs. Prejudice and discrimination is minimized. Additionally, the data gives KPMG insight into the capabilities and drivers of our employees, a wealth of information, that helps KPMG develop towards a desired culture, for example one where there is a focus on diversity. Based on facts, not on gut feelings.

Strategic HR advice based on data analytics truly provides added value to the business

Data analytics is already often used for reporting, where conclusions can be drawn in hindsight. There are several providers of HR KPI and metrics dashboards. These dashboards show the organization’s current state.

There is enormous potential for more in-depth relevant analyses of HR data that make connections between different sources of data and data points and create forecasts.

C-2018-1-Leeuw-04-klein

Figure 4. HR metrics dashboard example. [Click on the image for a larger image]

For example, the consequences of X% attrition rate on production and consequently turnover, the consequences of a high number of days sick leave and the consequences for supply chain processes because goods cannot be moved or taken into production. By collecting and analyzing the enormous amount of data organizations have available, important insights can be provided on which the organizations can be steered, and decisions can be taken. These insights can be used by Business Partners to advise the organization. This way ‘predictive analysis’ can, for example, be used to predict how long someone will stay in one job, which is useful information for the strategic succession and workforce planning.

Unfortunately, for many organizations it is very difficult to find and use relevant data, often because it is unstructured or private. KPMG research shows that only 35% of organizations trust the various analyses in their organization and 25% even distrust them ([KPMG18]). Enabling Technology, which can structure and automate processes, can certainly help here. Especially if systems are designed as a value chain, where consecutive steps are configured in one system and workflow, connections are easily made. Additionally, enhanced process automation can obtain useful information from unstructured data.

Robotics allow for more strategic human labor

With simple Robotics, current manual processes and activities are replaced by software. When certain actions have to be performed, in exactly the same way, time and time again, in different systems this can be taken over by robots. The robot will follow a workflow, making use of existing systems and data. For example, upon receiving a request to change the cost center for an employee, the robot can copy the data from the form into the HR system, search for the home address in Google Maps and retrieve the distance to travel, enter this in the HR or Financial system, and automatically change the reimbursement. Ideally, the process is optimized before it is robotized. Basically, no other investments are necessary other than the software. Robots furthermore do not get tired or sick, work 24/7 and do not make mistakes. There are case studies showing a 55% increase of process delivery ([KPMG17-3]). By transferring work to robots, people can focus on more strategic work, such as innovative product development.

C-2018-1-Leeuw-05-klein

Figure 5. Different types of Robotics. [Click on the image for a larger image]

Development of Robotics is always ongoing. Next to simple robots, there are also cognitive robots that can learn from human interactions and have the ability to apply what has been learned. These self-taught robots can also learn from the large amounts of information that are often present in content management systems, such as SharePoint, intranet and internet. Cognitive robots are, for example, deployed in contact centers. A caller can ask a question in natural language which the robot can answer or ask additional questions. When an answer is not possible, the call is forwarded to a human agent. Often so fast that the caller is unaware of the change in agent. There are examples of chat bots that deliver 80% of the human productivity at 10% of the cost. Cognitive robotics can further contribute to the employee experience, because they support self-service ([KPMG17-3]). 29% of researched organizations consider implementing cognitive systems this year ([KPMG17-1]).

A successful example of how RPA can help realize organizations’ benefits

KAS BANK N.V. is a leading European provider of custodian and fund administration services to institutional investors and financial institutions. It has branches in Amsterdam, London, and Frankfurt am Main, is listed on Euronext Amsterdam, and currently has over 500 billion euro assets under administration.

KAS BANK sought to achieve an increase in the quality of its products and service offering to clients such as tailoring client solutions, reducing costs through RPA implementation, increasing regulatory reporting accuracy and compliance, transforming the bank into a more nimble, highly competitive FinTech player and by enabling staff to focus on core banking and more value-add activities.

With support from KPMG, KAS BANK initiated the supplier and tool selection. This includes the business case, RFP development and release, short-listing, evaluation and contract signing. After selection, the RPA tool was used for programming, after which RPA was implemented in sprints. The implementation was made sustainable by the establishment of a RPA Center of Excellence and training on the RPA tool and processes for team members of both the bank and the IT services partner.

KAS BANK has immediately realized the benefits of RPA:

  • transformation of transactions, back-office processes and client-facing processes via RPA; 20 processes automated to date;
  • significant workload reduction for core operating business units;
  • demonstrable increase in process and service quality through first-time-right improvement via RPA;
  • end-to-end process digitalization enablement by combining RPA with Lean process improvement, IT rationalization and workflow management;
  • RPA capability building within the own organization to decrease external dependency and agility;
  • scalable RPA capability through virtualization of the RPA servers, architecture and workforce;
  • RPA governance and RPA process documentation to enable streamlined audit approvals;
  • ability to focus on core banking activities.

Because of technology, less time and effort are needed for operational processes and this allows HR employees and Business Partners to analyze data, map employee expectations, work on innovations and advise the organization on the best course of action.

In conclusion: what needs to be done

The expectations of Millennials about their work environment, labor shortages, changed expectations of HR service delivery and of course the opportunities that robotics, enabling technology and data analytics offer, force organizations and HR in particular to adapt and prepare for the future. A future where people take center stage, because they add unique value to the organization.

People as one of the most important resources for the organization require a CHRO as a strategic partner in the Board of Management. The top three actions for this CHRO are:

1. Put HR topics high on the BoM agenda, and keep them there.

Millennials represent a large part of the labor market and organizations have to respond to their needs. Topics such as strategic workforce and succession planning, talent management and vitality need to secure the recruitment and retention of top talent as one of the most important resources for the organization, as well as keeping them healthy and happy.

2. Embrace Intelligent Automation (Enabling Technology, Robotics and Data Analytics).

Enabling Technology is vital in order to connect to other systems and sources of data, and to configure processes in the necessary way, in order to meet the employee expectations. Processes need to allow access to HR service delivery at all times, and at any location. Service delivery is quick and faultless.

Various processes which are currently executed by humans can be taken over by robots. Robots can yield enormous savings and increase productivity. By deploying robots, people can perform more strategic work and contribute to improving the employee experience.

The strategic added value of HR also comes from advising the business on which course to take, based on insights from predictive analysis. Connections between different sources of data and forecasts provide information to support steering of the organization.

3. Transform the HR function into a new model.

To meet the new expectations and offer suitable HR services, organizations can no longer hold on to the classic Ulrich model. The future of HR asks for a HR model and roles that can quickly change along with economic and technological developments and on a large scale. The KPMG boundary-less HR model describes an organization where roles are used in a multidisciplinary way, and focus on making use of all benefits Intelligent Automation offers, such as insights from Data Analytics and Enabling Technology.

The implementation of Intelligent Automation and a boundary-less HR model are radical changes in an organization. It requires a clear vision and focus for important HR topics. For that kind of transformation, the world needs a CHRO!

References

[Conw16] David Conway, Harnassing the power of many, KPMG Nunwood, 2016.

[DELO16] Deloitte, The 2016 Deloitte Millennial Survey, Deloitte, 2016.

[HARV14] Harvey Nash & KPMG, Rol van CIO verandert aanzienlijk, Harvey Nash & KPMG, 2014.

[Klas17] Terri Klass, Judy Lindenberger, Characteristics of Millenials in the workplace, Terri Klass Consulting, 2017.

[KPMG17-1] KPMG, HR Transformation: Which lens are you using?, KPMG International, 2017.

[KPMG17-2] KPMG, Disrupt and grow: CEO Outlook Survey, KPMG International, 2017.

[KPMG17-3] KPMG, Accelerating Automation: plan your faster, smoother journey, KPMG International, 2017.

[KPMG18] KPMG, Guardians of Trust: Who is responsible for trusted analytics in the digital age?, KPMG International, 2018.

[PEWR10] Pew Research Center, Millennials: a portrait of generation next, Pew Research Center, 2010.

[Ulri97] Dave Ulrich, Human Resource Champions. The next agenda for adding value and delivering results, Brighton, MA:Harvard Business Review Press, 1997.

Trusted Analytics

It is a common sentiment: as Data and Analytics advances, the techniques and even results are becoming more and more opaque, with analyses operating as ‘black boxes’. But for decision makers in data-driven organizations who rely on data scientists and their results, the trustworthiness of these analyses is of the highest importance. In this article, we explore how a concrete approach to Trusted Analytics can help improve trust and throw open the black box of D&A.

Introduction: the black box

Today, complex analytics underpin many important decisions that affect businesses, societies and us as individuals. Biased, gut feel, and subjective decision-making is being replaced by objective, data-driven insights that allow organizations to better serve customers, drive operational efficiencies and manage risks. Yet with so much now riding on the output of Data and Analytics (D&A), significant questions are starting to emerge about the trust that we place in the data, the analytics and the controls that underwrite this new way of making decisions. These questions can be compounded by the air of mystery that surrounds D&A, with increasingly advanced algorithms being viewed by many as an incomprehensible black box.

To address these questions, we will begin this article by examining the current state of trust in analytics among businesses worldwide, to determine if a trust gap exists for D&A. We will then introduce a model for Trusted Analytics, which is a flexible framework for examining trust and identifying areas for improvement in both specific D&A projects and organizations as a whole. We will also examine how our model of Trusted Analytics applies in practice to a selection of D&A activities. Finally, we will conclude by discussing how to close any identified trust gaps in D&A.

Does a trust gap exist for Data & Analytics?

In 2016, KPMG International commissioned Forrester Consulting to examine the status of trust in Data and Analytics by exploring organizations’ capabilities across four Anchors of Trust: Quality, Effectiveness, Integrity, and Resilience ([KPMG16]). A total of 2,165 decision makers representing organizations from around the world participated in the survey. Leaders from KPMG, clients and alliance partners also contributed analyses and commentary to this study.

The results of the study were clear. Adoption of D&A is widespread and many companies are clamoring to build their capabilities. Organizations are adopting various types of analytics, from traditional Business Intelligence (BI) to real-time analytics and machine learning. Of the organizations surveyed, at least 70 percent rely on D&A to monitor business performance, drive strategy and change, understand how their products are used, or comply with regulatory requirements. Furthermore, 50 percent say they have adopted some form of predictive analytics and 49 percent say they use advanced visualization, beyond traditional static charts and graphics.

However, a trust gap may hamper relationships between executives and D&A practitioners, and may lead data-derived insights to be treated with suspicion. Only 51 percent of respondents to the survey believe that their C-suite executives fully support their organization’s D&A strategy. At the same time, only 43 percent of executives have confidence in the insights they are receiving from D&A for risk and security, 38 percent for customer insights, and only 34 percent for business operations.

Mind the gap

The study also revealed that trust is strongest in the initial data sourcing stage of D&A projects, but falls apart when it comes to implementation and the measurement of the ultimate effectiveness of D&A insights. This means that organizations are unable to attribute the effectiveness of D&A to business outcomes which, in turn, creates a cycle of mistrust that reverberates down into future analytical investments and their perceived returns. Companies which become entrapped in such a cycle run the risk of sacrificing innovative capacity.

Our experience suggests that there are likely several drivers of the trust gap. Decision makers may …

  • … know that they don’t know enough about analytics to feel confident about their use;
  • … be suspicious of the motives or capabilities of internal or external experts;
  • … subconsciously feel that their successful decisions in the past justify a continued use of old sources of data and insight – a form of cognitive bias.

We believe that organizations must think about Trusted Analytics as a strategic way to bridge this gap between decision-makers, data scientists and customers, and deliver sustainable business results.

What is Trusted Analytics?

Most people have a similar instinct for what ‘Trusted Data and Analytics’ means in both their work and their home lives. They want to know that the data and the outputs are correct. They want to make sure their data is being used in a way they understand, by people they trust, for a purpose they approve of and believe is valuable. And they want to know when something is going wrong.

‘Trusted Analytics’ is not a vague concept or theory. At its core are rigorous strategies and processes that aim to maximize trust. Some are well-known but challenging, such as improving data quality and protecting data privacy. Others are relatively new and undefined in the D&A sphere, such as ethics and integrity. We refer to these processes and strategies as the Four Anchors of Trusted Analytics.

C-2017-2-Veld-01

Figure 1. Building trust in analytics ([KPMG16]).

1. Quality

Quality is the trust anchor most commonly cited by internal decision-makers. Quality has many dimensions in the D&A space. Key considerations include the appropriateness of data sources; the quality of data sources; the rigor behind the analytics methodologies employed; the methods used to blend multiple data sources together; the consistency of D&A processes and best practices across the organization (and the alignment of these with the wider D&A industry); and the skills and knowledge of data analysts and scientists themselves.

There are many examples of inadvertent quality issues which have had massive knock-on impacts for individuals, organizations, markets and whole economies. And as analytics move into critical areas of society, such as automated recommendation systems for drug prescription, machine learning ‘bots’ as personal assistants and navigation for autonomous vehicles, it seems clear that D&A quality is now a trust anchor for everyone. Most organizations understand and simultaneously struggle with data quality standards for accuracy, completeness and timeliness. As data volumes increase, new uses emerge and regulation grows, the challenge will only increase.

Key concerns in D&A: Quality

  • Appropriateness and quality of data sources and data blending
  • Rigor and consistency of methodologies and practices
  • Skills of data analysts/scientists and alignment with industry best practices and standards

2. Effectiveness

When it comes to D&A, effectiveness is all about real-world performance. It means that the outputs of models work as intended and deliver value to the organization. This is the main concern of those who invest in D&A solutions, both internal and external to the organization. The problem is that D&A effectiveness is becoming increasingly difficult to measure. A reason for this is that D&A is becoming more complex and therefore the ‘distance’ between the upstream investment in people and raw data and the downstream value to the organization is increasing. It is sometimes the case that decision makers do not understand how to evaluate the specific actions being undertaken by analysts and data scientists, or that the greatest impacts of D&A efforts are felt ‘behind the scenes’, e.g. improving access to information or elevating the rigor with which an organization handles its data.

When organizations are not able to assess and measure the effectiveness of their D&A, chances are that decision makers will miss the full value of their investments and assume that a large proportion of their D&A projects ‘do not work’. This, in turn, erodes trust and limits long-term investment and innovation. Organizations that are able to assess and validate the effectiveness of their analytics in supporting decision-making can have a huge impact on trust at board level. The result of this, of course, is that organizations that invest without understanding the effectiveness of D&A may not increase the trust or value at all.

Key concerns in D&A: Effectiveness

  • Accuracy of models in predicting results
  • Appropriate use by employees of D&A insights into their work
  • Effectiveness of D&A support in decision-making

3. Integrity

Integrity can be a difficult concept to pin down. In the context of Trusted Analytics, we use the term to refer to the acceptable use of D&A, from compliance with regulations and laws such as data privacy through to less clear issues surrounding the ethical use of D&A such as profiling. This anchor is typically the main concern of consumers and the public in general.

Behind this definition is the principle that with power comes responsibility. Algorithms are becoming more powerful, and can have hidden or unintended consequences. For example, a navigation application could route users past businesses that pay a fee to the developer, or trading algorithms seeking to maximize profit may react unpredictably to unforeseen market circumstances, leading to increased volatility.

How do we decide what is acceptable and what is not? Where exactly does accountability lie, and how far does it reach? This is a new, uncertain and rapidly changing anchor of trust with few globally agreed best practices. Individual views vary widely and there is often no correct answer. Yet integrity has a high media profile and has potentially enormous implications, not only for internal trust in D&A, but also for public trust in the reputation of any organization that gets it wrong.

Key concerns in D&A: Integrity

  • Ability to meet regulatory requirements surrounding D&A
  • Transparency towards both customers and regulators about data collection and usage
  • Alignment with ethical policies and accountabilities

4. Resilience

Resilience in this context is about optimization for the long term in the face of challenges and changes. Failure of this trust anchor undermines all the previous three: it only takes one service outage or one data leak for consumers to quickly move to (what they perceive to be) a more secure competitor. Furthermore, it only takes one big data leak for the regulators to come knocking and for fines to start flying.

Although cyber security is the best-known issue here, resilience is broader than security. For example, many organizations put employees at risk of sharing confidential data with unauthorized people, both inside and outside of their organization. They may further lack controls on which people are permitted to change data. Change management is also very important to this anchor: does the organization follow proven methodologies and practices to enable and take advantage of insights emerging from D&A?

Key concerns in D&A: Resilience

  • Tailoring governance policies to specific data use cases
  • Authorization and logging for data access, use and analysis
  • Cyber assurance for proactively identifying security threats

Trusted Analytics in practice

The field of D&A is broad and diverse, and the Anchors of Trust can manifest themselves in different forms depending on the context. To examine how Trusted Analytics works in practice, we zoom in to the specialist areas of Business Analytics, Process Mining, and Advanced Analytics.

Business Analytics

Of the three practices that we focus on in this article, Business Analytics has been around the longest and has matured the most. Analytics have been around ever since Enterprise Resource Planning (ERP) systems started to gain ground as the heart of financial administration. The initial rudimentary form of one-off reporting, such as balance sheets and income statements, has over time involved into a whole array of valuable ways to control risks and improve efficiency. With analytics both serving external stakeholders and supporting internal decision-making, consequences of incorrectness are typically financially material. This of course underwrites the necessity of trust.

Trust in Business Analytics is predominantly built on the quality, effectiveness and integrity anchors. Consistency, completeness, correctness and regulatory compliance are key concerns, especially for financial reporting. Organizations look for assurance on the quality of the data they employ by hiring IT auditors to test the data-producing IT infrastructure. Building on the technical integrity of data, the question of reliability emerges. Especially when analytics get more advanced, it is essential that results can be properly interpreted by the intended user. This requires key users to take ownership of the entire process: both upfront, in the functional and technical design, and afterwards, during testing and review. They must also ensure that current and new analytics do not conflict or contradict, unless explicitly designed and properly communicated.

There are several hallmarks of effective Business Analytics. First comes the level to which analytics are embedded in the organization: are analytics available, understood and centrally positioned in the way of working? It is particularly important to stress this for projects that are initiated top-down, where the end-user may not initially recognize the need to use analytics expressed by the board-room . Second comes the alignment between business and IT: the business knows the requirements and will eventually have to use the analytics, IT can expand their understanding of what would be possible.

Integrity and resilience also have their impact on trust in Business Analytics. You could think of compliance with privacy laws: what data about your customers are you preserving, in order to employ fraud analytics? Which analytics do you run on your own employees and how specific do you report? And resilience: in our survey, just 52% of all respondents stated that their data is only changed by authorized people. How do you manage your master data? What governance do you have in place to safeguard resilience?

Example of mishaps in trust

In 2012, US-based retailer Target became the center of a now well-known case of analytics gone wrong. The New York Times ([Duhi12]) reported that predictive analytics had revealed a teenaged girl’s pregnancy, and Target sent her marketing materials geared towards new parents. Unfortunately, the girl’s parents were unaware of her pregnancy, and the incident resulted in considerable embarrassment for all parties involved. Target’s D&A was clearly of high quality and effectiveness in this case, but their failure to consider integrity still led to a breach in trust.

Process Mining

Like many other disciplines in data science, recent breakthroughs in Process Mining have provided unprecedented opportunities to sense, store, and analyze data in great detail and resolution. Developments in Process Mining have resulted in powerful techniques to discover actual business processes from event logs, to detect deviations from desired process models, and to analyze bottlenecks and waste. However, Process Mining can also be plagued by issues of trust. How can an organization benefit from Process Mining while avoiding trust-related pitfalls?

The quality of a Process Mining analysis can be negatively impacted by both expectations and presentation. Starting from process models may lead to flawed predictions, recommendations and decisions. To provide analysis results with a guaranteed level of accuracy, it is important to use cross-validation techniques to provide adequate confidence about complex analysis results. Resilience can be aided by communicating clearly about the certainty of findings. Where it is necessary, uncertainty about results should be explicitly calculated. At the very least, inconclusive parts of an analysis should be openly presented as requiring further investigation. This can help manage expectations, and is also an opportunity to demonstrate transparency and measure effectiveness. Transparency can be further enhanced by including the ability to drill-down and inspect the data. For example when a bottleneck is detected in a Process Mining project, one needs to be able to drill down to the instances that are delayed due to the bottleneck. It should always be possible to reproduce analysis results from the original data.

Because Process Mining techniques can be used to ‘blame’ individuals, groups or organizations for deviating from some desired process model, integrity plays a key role in trust. Many analysis techniques tend to discriminate among different groups. For example, data analytics can help insurance companies to discriminate between groups that are likely to claim and groups that are less likely to claim insurance. This is often useful and desired, but care must be taken to actively prevent discrimination based on sensitive variables in a given context, for example race, sexuality, or religion. Discriminative-aware Process Mining needs to make a clear separation between likelihood of a violation, its severity, and the blame. Deviations may need to be interpreted differently for different groups of cases and resources.

The Anchors of Trust should be considered in all parts of a Process Mining project including: data extraction, data preparation, data exploration, data transformation, storage and retrieval, computing infrastructures, various types of mining and learning, presentation of explanations and predictions, and exploitation of results taking into account ethical, social, legal, and business aspects.

Example of mishaps in trust

By most accounts, 2016 was a bad year for polling, with pollsters worldwide being consecutively shocked by the outcome of the Brexit referendum in June, and Donald Trump’s victory in the American presidential election in November. Polling agencies use D&A to disseminate information about public opinion, taking great care to ensure integrity by trying to eliminate bias in their methods. However, these recent upsets are very high-profile failures in effectiveness, which in turn lead to questions about quality and harm trust in this application of D&A overall.

Machine Learning / Advanced Analytics

‘Machine Learning’ refers to a set of techniques used to identify patterns in data, without specifically programming which patterns to look for. In this way new insights can be discovered that may not occur to human analysts. Many of these techniques have great potential, but they are almost always statistical by nature: typical results are not precise, but indicative. For example, the results will carry some amount of uncertainty, or they may only apply to a group on average, as opposed to getting specific results for single individuals. This needs to be taken into account when assessing the quality of the output of analyses employing machine learning. Due to the effectiveness of machine learning in identifying complex relationships if they exist in data, the accuracy and therefore quality of predictions combining various sets of data that are available to the organization. The effectiveness of machine learning must be viewed through a similar statistical lens. It can be enhanced by adding rigor to both the design and testing processes, and of course by ensuring that the input data itself is of high quality and consistency.

The integrity of machine learning is a hot topic. With algorithms becoming more complex, it can be difficult to understand what exactly the model has learned, and how it will behave in a certain situation. Ensuring that consumers are treated fairly by algorithms is one of the hallmarks of integrity. Also central to integrity is limiting how much algorithms learn about individual people, to prevent feelings of privacy invasion or ‘creepiness’. Long-term resilience of machine learning can be achieved by resisting the temptation to run many individual exploratory projects without bringing the insights derived into production. A culture of openness can also aid in resilience, helping to shield against (inadvertent) bias creeping into algorithms.

C-2017-2-Veld-t01-klein

Table 1. The Anchors of Trust: examples of challenges in practice. [Click on the image for a larger image]

A transition from financial audit to D&A assurance

Another area where the earlier mentioned concerns are important, is the rise of trust statements or D&A assurance. During internal and external audits, data integrity has always been a key concern and audit focus, this is no different in a data driven economy. However, the need for assurance about data (not necessarily only financial data), will increase. In a rapidly changing data environment which is impacting how society interacts, the need for an audit (or digital assurance) about the compilation and effect of data driven decision models, will change the audit industry to become an assurance industry. Presently the audit industry is reinventing their business models and service lines in order to find a new fit between the digital revolution in the market and the data and technology transformation that is happening with its clients.

The future of Trusted Analytics: interview with Prof. Dr. Sander Klous

Sander Klous is the Managing Director of Big Data Analytics at KPMG in the Netherlands. He is the founder of this team and is responsible for the global advanced analytics technology stack of KPMG. Sander is professor in Big Data Ecosystems at the University of Amsterdam. He holds a PhD in High Energy Physics and worked on a number of projects at CERN, the world’s largest physics institute in Geneva, for 15 years. He contributed to the research of the ATLAS experiment that resulted in the discovery of the Higgs Boson (Nobel Prize 2013). He shares his thoughts on the future of Trusted Analytics.

Q: How have you seen trust in D&A evolving over time?

‘Three years ago, when I gave lectures on big data, the biggest question was “What is Big Data?” It was a new concept. Once people started to grasp the fundamentals, they began asking “Now what? How do we get started?”, which turned the conversation towards techniques and technology. Then people became concerned with issues like reliability, quantity and quality of data, and how to recruit the right people. These days, when I talk to the board of an organization, they say “D&A is nice, but I’m responsible for the decisions being taken by this organization based on these algorithms, so I need to know that they are reliable (or else I go to jail). But there is another part too: does this algorithm adhere to the norms and values we have as a society? If my algorithm is reliable, but it is always discriminating against a certain race, then it might be reliable and resilient and repeatable, but this is still not acceptable and I will still go to jail.” So this is a hot topic these days.’

Q: What is the biggest step that can be taken to improve trust in D&A? Is there a need for a trusted party?

‘If you look at the Dutch organization for protecting privacy, APG (Autoriteit Persoonsgegevens), they used to have the obligation to check all the organizations, and if they made a mistake then they had an issue. However, when it came to data leaks, they turned around the responsibility, and made organizations themselves responsible for reporting leaks. This is more scalable, since the work is distributed to all organizations, and the APG only intervenes in the case of a leak. However, it is clear from the number of reports that organizations are underreporting, so the next step is for authorities to require independent organizations to certify the reporting of data leaks. This is the accountancy model: keep centralized complexity as low as possible, and have the intelligence come from the boundaries, the organizations that are participating in the system. This will first happen for data leaks, but then maybe other regulatory bodies will come with other requirements that need to be checked to ensure that organizations are doing D&A in a responsible manner. So you need independent organizations that know how to deal with trust, and that also have the knowledge to perform these checks.’

Q: Is there a limit to how much control we should give to algorithms and analytics? Should we avoid a situation where all our decisions are made for us?

‘Well, we are actually basically in that situation already, and there is even a term for it, from Big Data philosopher Evgeny Morozov: “invisible barbed wire”. He says that most of our decisions are already impacted by technology in one way or the other, either voluntarily, for example choosing to use an app for navigation, or involuntarily, for example automatic gates at train stations that deny you access if you have not bought a ticket. The thing is that at the moment, this barbed wire is not really invisible. You still feel it sometimes: when decisions are wrong. If your navigation system directs you down a street that is closed, then you are upset with your navigation system. A decision is made for you and you are not happy with the decision, and that is the barbed wire. Five or ten years from now, the techniques will have improved such that you will not feel the barbed wire anymore, and then it will be too late. We have a window now of five years, maybe ten years, when we can feel the barbed wire, where we as a society can enforce compliance with our norms and values. And just like with the APG and data leaks, this can only be done by reversing the responsibility: making organizations responsible for complying with these values, and subjecting them to regular investigation by a trusted third party. This is the only way to keep the complexity of the task under control.’

Conclusion: closing the gap

The trust gap cannot be closed by simply investing in better technology. Despite different levels of investment, our survey suggests that more sophisticated D&A tools do little to enhance trust across the analytics lifecycle. We believe that organizations must instead think about Trusted Analytics as a strategic way to bridge the gap between decision-makers, data scientists and customers, and deliver sustainable business results.

In practical terms, this begins with an assessment of the current trust gaps affecting an organization, and a reflection on how to address these. In many cases simple solutions such as implementing checklist-type procedures can already have a big impact. A similar assessment should be conducted for all current D&A activities; this can reveal opportunities for streamlining and alignment.

The quality of D&A can be improved by simplifying interconnected activities as discovered during the initial assessment, encouraging the sharing of algorithm and model design to prevent the (perceived) appearance of ‘black boxes’, and establishing cross-functional D&A teams or centers of excellence. Cross-functional teams will also help improve effectiveness as they are able to apply their expertise to multiple areas, breaking out of their traditional silos. These teams should be approached with an investor mindset, valuing innovation over the avoidance of failure.

Integrity can be enhanced by fostering a culture of transparency, for example by open-sourcing algorithms and models, and by communicating very openly to consumers about how their data is being used. Openness between business leaders and D&A professionals will also improve resilience, helping to accelerate awareness and align priorities. Resilience is further enhanced by continuously monitoring D&A goals and progress, rigorously test the outcome of analyses  and maintaining a whole-ecosystem view of the D&A landscape.

The transition to digital assurance is an opportunity that will have impact on society (people), technology and regulations. A risk emerges if standard setters and regulators would not embrace the digital assurance with the same velocity as the market is doing. This mismatch could develop into a threat for the industry, sparking discussions on relevance of audit procedures in general. A holistic view is vital; each of the parties involved can solve their challenges, but more than before, a multidisciplinary discussion between all parties is required, which may lead to better assurance for corporations and for society in general.

Contributions to this article were made by prof. dr. Sander Klous, drs. Mark Kemper, Erik Visser and dr. Elham Ramezani.

References

[Duhi12] C. Duhigg, How Companies Learn Your Secrets, The New York Times Magazine, February 16, 2012.

[KPMG16] KPMG, Building trust in analytics: Breaking the cycle of mistrust in D&A, KPMG International, 2016.

Capitalizing on external data is not only an outside-in concept

Throughout most large and medium sized corporations data is generated and consumed within core processes. This has caused an increase in data on products, consumers and companies and has unfolded in an increasing availability of data generated by external sources. This availability has facilitated the rapid evolution of ‘business as usual’, but has also enabled service differentiation in the periphery. Whether external data is applied within the corporation (outside-in) or generated to be made available externally (inside-out), companies face unique data management challenges that often require tailored solutions.

Introduction

Corporations are integrating more and more data generated outside their company in their internal processes to increase efficiency, understand customers or gain new insights. This external data is becoming increasingly important when more and different data becomes available. However, very few organizations have standardized procedures to deal with external data. Even fewer organizations utilize the externally available data to its full potential.

C-level executives understand that concepts like analytics and process automation are essential for a successful business. Employees are already using data generated within the company in their daily work and their dependency on data will keep increasing in the years to come.

Due to upcoming technologies such as predictive analytics, machine learning and robotics, the corporate taste for applying data will further reduce human involvement in numerous business processes.

But this insight is not new. What is new, is that the value of data created externally is becoming more important than the data that you acquire from internal sources ([Wood12]). Data that is not captured internally can provide new insights into customer behavior and preferences not previously accessible. This enables companies to further tailor their services, sales and marketing to those customers that are most likely to buy their products.

This is not the only method to capitalize on external data however. Companies can:

  1. increase organizational or operational efficiencies;
  2. use internal and external data in new business models;
  3. directly monetize from making internal data externally available.

Increase Organizational Efficiencies

The most straightforward method to capitalize on external data is by integrating it within internal processes.

A case for external data integration that is becoming more common is using customer sentiment to improve the efficiency of marketing campaigns ([Fran16]). This typically starts passively by looking at the number of shares and likes a campaign generates on social media, but can go as far as real time interaction with customers and active participation in discussions to identify potential sales leads.

A more internally focused example is product information. Retailers within the food industry integrate data on product labeling, product packaging and ingredients from their suppliers ([Swar17]). This not only reduces time at the moment of data entry, but also when the data is consumed further downstream, given the reliability and quality of this data is correct.

Besides this outside-in concept to capitalize on external data by increasing the bottom-line, recent developments change corporate perspective and turn data monetization inside-out.

New Business Models

If your company generates data or possesses proprietary information, you can consider how the data and information you already possess can be reapplied. That staying close to your current business is beneficial is confirmed in an HBR study. The authors have found that top performing companies, across 62 industries, consistently expand their business on the periphery of their existing operations ([Lewi16]).

There are three ways one can go about building new business models, by creating value added services:

  1. from only internal data;
  2. from only creating additional insights and reselling external data;
  3. by combining internal and external data sources.

This is also shown in figure 1.

C-2017-1-Verhoeven-01-klein

Figure 1. New business models can be constructed in one of three ways. [Click on the image for a larger image]

Create value for customers only from internal data

A familiar example of generating value from internal data is Google. Google has always had a data driven business and has originally provided value-added data services from their search business. Since 2005, the company has been using their proprietary audience and machine learning data in their Google Analytics offering. Since March 2016, this offering has been expanded with an enterprise-class solution: Analytics 360, which adds functionality that enables personalized user experienced testing and much more.

Creating value for customers only from external data

The added value of businesses that capitalize only on external data (generally advertised as data providers) is the addition of structure through analytics. Transforming data to information is complex and not every company is able or willing to do this on its own. Companies like Experian, Acxiom and GNIP collect and aggregate data from social media, financial sources and open, publically available data and turn this into insight.

Through these value-added services, these data providers provide companies with the necessary information to increase the efficiency of their business. Examples include the evaluation of the borrowing capacity of clients, the likelihood estimation of a customer having any interest in a specific service, and the evaluation of customer sentiment on social media.

Combining internal and external data

Several of the large food and agriculture multinationals have acquired analytics and data driven business in the last few years. Presently they are competing with services that help farmers optimize crop yields. These services integrate proprietary data on their products’ growth properties and externally available data such as historical weather patterns, soil properties and satellite imaging. Cargill’s NextField DataRX, Dupont’s Encirca Services and Monsanto’s FieldView help farmers grow crops better and more efficiently and navigate weather shifts ([Bung14]). Moreover, Dupont’s Pioneer company has developed mobile applications that help making farming easier and more reliable. These apps provide farmers with information on crop yield estimates, weed and pest control and even help farmers estimate the growth stage of their crops.

Direct Monetization

A specific new business model to generate value with your data is selling it directly to other companies. This sounds counterintuitive. Many companies’ core business is collecting data on their customers, assets or users. And many suspect that selling this data could undermine their position. The key is to sell your data to companies that aren’t your competitors, or aggregate the data sufficiently to ensure that true insights into your core business don’t shine through ([Lewi16]). Although not every company generates data that is of interest to other parties, we hope you get some inspiration from the following examples of companies which do.

UnitedHealth, an American health insurance provider, has created a business of selling aggregated claims and clinical information that it receives and generates from about 150 million individuals. UnitedHealth sells this data to pharmaceutical companies to give insights on how a product is being used, the product’s effectiveness and its competitiveness. It provides data attributes such as, but not limited to, educational background, histology results of clinical exams, hours of self-reported sleep, tobacco or alcohol use and gender, ethnicity and age. This creates a model that can be easily adopted by similar companies, but hasn’t found widespread application.

In January 2016, Telefonica announced they were launching a joint-venture in China to sell mobile consumer data. Besides their existing consumer base in several European and South American countries, Telefonica will now generate and sell anonymized and aggregated mobile network data on 287 million additional China Unicom users. The data is enriched with aspects such as social demographics, home and work location, modes of transport and other attributes, allowing sophisticated profiling. It is being used to find optimal locations for new store placement but also for safety initiatives such as crowd control.

Challenges dealing with external data

Although these examples of successful business models that incorporate or generate external data are inspiring, companies that adopt these models face many challenges. These challenges are sometimes specific to external data, but are often generic inefficiencies that are resolved by good data management.

We can distinguish between these challenges in the phase of the data lifecycle they occur; 1) Acquisition, 2) Transformation and 3) Integration (ATI). This is similar to the Extract, Transform, Load (ETL) taxon, but broadens the scope slightly. Figure 2 contains a non-exhaustive overview of aspects involved in this process.

C-2017-1-Verhoeven-02

Figure 2. Different aspects contribute to the success of external data management.

Acquisition

During the acquisition an organization should manage data acquisition concepts such as procurement, quality control and service level agreements (SLAs), but also interfaces with the data providers and authorizations within your organization. In corporations, external data is often incrementally introduced in different places in the organization. Local initiatives find solutions for the challenges they face. But these local solutions don’t get implemented organization wide.

Not aligning these initiatives can be costly and are often not transparent to top level management because of their fragmentation throughout the organization. It is therefore important for top level management to lead a unified data management agenda to achieve alignment and leverage across the organization ([Loga16]). This not only covers data acquisition, but includes data governance, data quality and other organization-wide data management aspects.

Multiple people at your company have acquired the same data set

If one or more external data sets are relevant to a certain department in your organization, chances are high that the same data set is used in other departments for the same reason. Disregarding whether or not these data sets can be freely acquired, having to store, manage and update often large amounts of data multiple times is a costly affair. In order to combat this, a central data repository should keep track of all external data sets, interfaces, updates and authorized users within the company. Moreover, provider and api management should be implemented.

Dealing with different versions of a single data set

Not only duplicate data sets are a risk for an organization, storing and maintaining different versions of the same data set introduces similar complications. There are good reasons to keep different versions of a data set, such as to keep track of historic patterns. In this instance detailed version control is important to ensure traceability (or: data lineage) of your data through your companies processes. This is particularly important for regulatory compliance, but also for reporting entities to ensure consistency and prevent complications with aggregated data based on different versions.

Transformation

The transformational aspects of external data management should include data conversion efforts to unify data formats such as dates, numbers, addresses etc. with your internal data model. It should also include (automated) data cleansing for external data and anonymization of internal data when you are exposing data to the outside world.

Applying data set updates

Wilder-James estimates the amount of time spent on conversion, cleansing and previously mentioned acquisition activities make up 80% of the total time spent on data operations ([Wild16]). When dealing with a fixed portfolio of data sets, tooling can automate much of these tasks for each update of the data. This will significantly reduce effort on these currently manual tasks.

Automating alone does not solve this completely. Version control is also very important to ensure automation does not have adverse effects within the organization. In some cases, automated updating is not wanted. For example, when changes to the data are applied annually (vendor naming, model types etc.), a more frequent updating regiment could bring unnecessary complexity and error.

Issues with data privacy

Data privacy is a hot topic ([A&O16]). With the newly adopted European General Data Protection Regulation (GDPR) in place by 2018, data subject consent and rights are aspects to apply to your data management processes. Selling aggregated and anonymized data outside the country it was collected in is becoming more complicated. More requirements are placed on asking subject consent and corporations have to ensure contractual documentation is adequate for GDPR standards.

Integration

Within the integration activities, the organization is faced with many technical challenges. Deploying a data lake or applying the data through direct (on demand) integration are complicated affairs. Successful integration depends on available architecture, technologies and desired data sources, but also heavily on strong data governance ([Jeur17]).

Reliability of external data

One aspect of data that is often overlooked is reliability. The reliability of data refers to a multitude of aspects of data that we deem important. For external data integration relevant reliability measures are a combination of the data’s accuracy and appropriateness.

Accuracy is defined as the closeness from the data to its actual value. This is especially important for quantitative measures and should be taken into account when further calculations rely on this data. Sometimes, when dealing with external data sources, the data’s accuracy is mentioned and can be taken into account during analysis.

Appropriateness is more difficult to quantify but can be a major factor in the reliability of the data as a whole. For example, it plays an important role within the Solvency II regulatory framework for insurance and re-insurance companies. Within the context of external data, appropriate data sources should ensure that data corresponds to the goal it is intended for, it requires the data to be consistent with underlying statistical assumptions, and it requires the data to be acquired, converted and integrated in a transparent and structured manner.

The reliability of external data is difficult to pin-point accurately. However, during integration and application into analyses, keeping track of the data sources reliability can prevent issues later on. Imagine using a data set from a data vendor you have worked with for 5 years versus using a newly published data set from a not well-known university. The quality of these data sets might be the same, but their reliability could differ. Making c-level decisions based on the latter set might upset shareholders when the data set turns out to be unreliable.

We propose to keep track of data set accuracy and appropriateness throughout the data lifecycle. These aspects for each (critical) attribute can be documented in a data directory or similarly structured documentation. However, documentation alone does not achieve reliable results. End-users of data within your company should reflect on their analyses with such a data directory in order to ensure that their analyses are in their turn reliable.

Conclusion

Whether you are integrating external data in your processes, you are starting a new business by using external data, or you are selling the data you own to third parties, there is great potential in the application of external data.

However, throughout the life cycle of external data, either created by or applied within your organization, many challenges need to be tackled. Even if company-wide data management maturity is high, there might still be aspects unique to external data integration or creation that should be organized. Topics mentioned such as API and Provider management, automated data cleansing and conversion, and sufficiently anonymized data for publication, largely contribute to the success of an external data-driven business model.


Data Quality GS1

In order to improve the data quality of product data in the food industry, the non-profit GS1 organization created a whole new solution, including third-party Data Management Services that will administer or check the product data from suppliers on quality. This must solve many challenges which are faced in this area and ensure that regulations are complied with.

Importance of data quality in the food industry

High quality data is increasingly important for answering the demand from consumers in the food industry. Inaccurate or incomplete product information can lead to complaints from customers and even non-compliance of regulations (such as EU-1169).[http://eur-lex.europa.eu/legal-content/NL/TXT/PDF/?uri=CELEX:32011R1169&from=FR] Complaints can arise for example from people with allergies with regard to inaccurate nutrition information or misleading information on products. The impact of this cannot be underestimated (e.g. damage to brand image and reputation, and non-compliancy). Moreover, high data quality increases customer satisfaction by ensuring the completeness and accuracy of product and nutrition information.

The food industry is quickly responding to more demanding consumers and changing habits. They increasingly demand to know what they are actually consuming for health, allergy, economic, environmental, social or even ethnical purposes. More and more sources are available to customers, making it easier for them to assess the correctness of labels on food nutrition. Incomplete data will be considered as misleading information by customers. For example for jam products the amount of fruits and sugars per 100 grams of the product is not mentioned. This makes it impossible for customers to compare these products with products where this information is stated as required.[http://www.hetnieuweetiketteren.nl/streekproducten-en-consument/] The detection of incorrect data will be communicated in a few seconds by (social) media, having an enormous impact on a company’s reputation. Along with responding to increasing consumer demands, high quality data also increases supply chain efficiencies through cost and error reduction. This has also been acknowledged by several big players in the Dutch food sector, such as Ahold and Superunie. Suppliers were providing products including data to several retailers, however this information was communicated using different systems, standards and definitions.

In addition to increasing customer demands, high quality data is also important for the transportation of goods by increasing the reliability and efficiency of product transportation and delivery to stores and warehouses. High data quality of dimension attributes (height, weight) leads to reduced measurement errors of products and can be used to improve efficiency of processes and optimization of transportation through the supply chain. In one example freight trucks were loaded inefficiently because the packaging material of a product was smaller than expected, leading to non-used space in these trucks and therefore higher costs.

The importance of high quality data has also been addressed by government authorities. Mainly health related factors have resulted in stricter legislation and requirements from government bodies. This requires companies to be in control of their data. Specifically the EU-1169 regulation has been introduced to control the importance of data quality in the food sector. More specifically, this EU regulation on the provision of food information brings together different EU rules on general food and nutrition labeling. Regulation is generally intended to protect consumers with several requirements for the food industry sector to provide accurate and complete product and nutrition information on the label. In practice this regulation makes nutrition labeling mandatory, and instructs food manufacturers to provide information on nutrients. Hence, retailers need to have access to the data which is created by suppliers in the supply chain. Obviously retailers have multiple suppliers that use a variety of data transfers standards and want to exchange data at different times. For this reason, a central data source has been set up that functions as a storage facility for both suppliers (deliver and enter data) and retailers (extract data to inform customers with nutrition information). This data pool is governed by a non-profit organization, called GS1.

C-2017-1-Swartjes-01

Figure 1. Data entry into GS1 Datasource.

Over the last couple of years GS1 has made good progress (e.g. data quality programs) but is still facing challenges to achieve the desired level of data quality. Initiatives, lessons learned and activities to improve data quality in the food sector, together with future challenges will be addressed in this article.

Specific challenges of data quality in the food industry

The importance of data quality has been acknowledged across various industries such as financial services, medical devices and consumer goods. More and more industries are subject to increasing customer demands and stricter regulations regarding the use and quality of data. Along with increasing regulation, more and more organizations are transforming into data-driven organizations.

In general, high data quality becomes relatively more important according to the size and complexity of an industry. The supply chain in the food industry is known to be very complex, dynamic and consumer driven. The food industry is also a highly competitive environment. High data quality is therefore a requisite to enable process efficiency and increased customer satisfaction. In practice, this means that companies dealing with product, article or nutrition data are facing the following typical challenges.

Dimensions

Dimension data such as size or weight of materials might be pretty straightforward if you have agreed upon the measurement rules. However, with food products it is not always that clear which dimension is applicable, e.g. is it the length of the product or the width? Try to apply this to a net of oranges to see how difficult this can be. Errors due to incorrect dimension data possibly lead to the inefficient transportation of goods, as trucks and shipping are planned based upon such measures. Consistent definitions of dimensions also contributes to effectiveness of collaboration between departments and organizations resulting in a more integrated supply chain.

Packaging

Another challenge occurs with the packaging of food products. Do you include the foldable tips of the packaging of a sausage or do you fold it back to have the minimal size? Why bother about this at all and just agree on one way of measuring or the other? Because it actually does have an impact, since the transportation, storage, and locations, are arranged based on this information. Consider the additional costs that a supplier incurs as a result of a half-empty truck as mentioned in the example earlier, caused by calculation errors.

And then we have single articles and bags and boxes and all other kinds of packaging which make things more complicated than they may look at first sight. There may also be several types of packaging for one product, all of which might have different label information and also contain not only text, but also logos which also need to be recorded in text. It can be assumed that logos will be interpreted differently by each person.

Labels

One other typical aspect in the food industry is with regard to label information. Some data only needs to be recorded if it is actually presented on the label, such as the percentage of alcohol. In fact this is a very simple rule, however it is difficult to check or even to automate this. Because while an empty field might indicate a data quality issue, you can only be sure by actually checking the label to see whether this data is or is not available and therefore whether the empty field is valid or not.

A collaborative ‘taskforce’ approach as a starting point

Some major players in the food industry realized something needed to happen in this area in order to provide an answer to the challenges and requirements they faced with regards to the quality of product data. In order to get sector-wide support for the data quality 2.0 program a taskforce was appointed. This 2.0 program was introduced soon after the 1.0 program as a renewed and broader approach and because solutions seemed to be necessary. The taskforce is a collaboration of twenty industry leaders consisting of suppliers, retailers and branch organizations. The suppliers are among others represented by Federatie Nederlandse Levensmiddelen Industrie (FNLI),[http://www.fnli.nl/] Unilever, Pepsico, Proctor and Gamble and Nestle and the retailers by Albert Heijn, Jumbo, Sligro and SuperUnie. Together the taskforce created the outlines, commitment and funding of the data quality 2.0 program.

At the start of the data quality 2.0 program the taskforce collaborated intensively to create the outlines and principles of the program. There were long debates on topics like the data fields that need to be checked, the involvement of third party data capturing companies and the sample sizes of the physical checks. Now the outlines are clear and the data quality 2.0 program has already started, the taskforce involvement is decreasing, with only a few meetings this year. GS1 is driving and coordinating this program as an independent organization. So who is GS1?

GS1 organization, history and role

GS1 Netherlands is a not for profit company that was founded 40 years ago with the introduction of the barcode.[https://www.gs1.nl/over-gs1/over-ons] Albert Heijn himself took the barcode from the US and introduced it to the Netherlands, due to its potential to improve cash register systems in the 70s. In order to fully implement the barcode in the supply chain an independent party was necessary to bring retailers and suppliers together to make the supply chain more efficient. GS1 Netherlands was founded for this purpose.

Nowadays, GS1 Netherlands offers (international) standards for the unique identification, capture and sharing of data. We are still using the barcode, and new central article databases and electronic communications are now available. With the global usage of the barcode GS1 has member organizations all over the world, spread across almost one hundred countries. The global head office in the US is collaborating with companies such as Google, Walmart and Alibaba. Together GS1 works with over a million companies to create industry-wide agreements on identifying, capturing and sharing information.

GS1 Netherlands has grown significantly, GS1 Netherlands now consists of 70 employees, as a result of the data quality program. With a focus area that has changed from sector (projects) managers to an IT and data analytics skilled HR focus.

Data quality program

Over the last couple of years suppliers in the food industry have invested in many good initiatives to deliver product information into the GS1 DataSource. Suppliers aim to provide retailers in the industry with complete and accurate product information. It seems however that despite these good initiatives, data is still in many cases actually delivered incomplete or incorrect. This is applicable for both product/label information and logistics information, such as packaging measurements. GS1 is aiming for 100% accurate and complete product information. In the end, this contributes to the efficiency of processes within the food chain and furthermore provides reliable and accurate information to the consumers.

For these reasons, GS1 has initiated a collaborative data quality program together with CBD (Central Agency of Drugstores)[www.drogistensite.nl], CBL (Central Agency of Food)[http://www.cbl.nl/], the FNLI (the Dutch Food Industry Federation), some retailers and manufactures. This program is called ‘DatakwaliTijd 2.0’.

The goal of this program is to improve data quality with a significant impact on the supply chain within the food industry and provide more reliable and accurate data to customers. More specifically, this entails:

  • simplifying data entry into GS1 DataSource;
  • preventing incomplete or inaccurate data entries;
  • correcting incomplete or inaccurate data within GS1 DataSource;
  • extending automatic controls within the supply chain;
  • making physical controls applicable for both new product information and modified products.

External Data Management Services (hereinafter DMS) play an important role in this solution and will mainly be used for entering or checking the product data in the systems. These DMSs need to be certified and are therefore specialized in order to perform these activities and need to be contracted by suppliers themselves. The next paragraph will detail more the services they can provide with regards to data quality for product data and the associated certificates.

Data management service solution and certificates

The main goal of the project is to guarantee the quality of the product data for which the DMS plays an essential role. They perform data quality controls to assess the quality of the delivered product information by comparing the data in the GS1 DataSource with physical product information. A DMS can also enter logistic and product information into the GS1 DataSource on behalf of the supplier. This product information is excluded from quality controls.

To perform activities related to data quality controls and data entry, a DMS needs to be certified by GS1 and attain a GS1 Quality Mark. Hence, the landscape of the DMS solution can be considered as complex. This has been illustrated in figure 2.

C-2017-1-Swartjes-02-klein

Figure 2. Data Management Solution. [Click on the image for a larger image]

In general, a DMS can attain the following GS1 Quality Marks:

  • recording/entry of logistical data and label information (for both the food sector and the health & beauty sector);
  • checking logistical data and label information (for both the food sector and the health & beauty sector).

To attain a GS1 Quality Mark, the DMS will be assessed with regard to the following areas:

  • location: assessment of organizational structures, (data) processes, skills and knowledge of employees;
  • system: assessment of tooling and systems, more specifically the extent to which the DMS system environment is able to communicate and interface properly with suppliers;
  • quality: assessment on the output of data entry and data auditing related activities.

The location and system assessment will be performed by an external auditor, while the quality assessment is executed by GS1. Companies need to pass all 3 assessments in order to gain a certificate. Recertification of location and system is on an annual basis, but quality is assessed more frequently depending on the quality of the DMS.

The ultimate goal of the program is obviously to provide high data quality. Hence, a GS1 Quality Mark makes sure that data entry and controls are performed in accordance with the agreements and standards that apply to the Dutch food and drug industry. So for now there is a foundation to reach this goal, but what about the future of GS1?

Future

GS1 is continuously exploring new areas to operate in. As stated at the beginning several triggers did lead to this solution and will provide new triggers when, for example, new legislation and requirements from government bodies are introduced. Also, the scope of this solution, the food and drug industry can easily be copied into other markets which face more or less the same ‘challenges’ as the health care sector.

GS1 Netherlands is also looking into opportunities to work in a more global way with affiliate organizations in other countries fulfilling the same services. Currently there are already some global meetings and initiates but a lot is still to be achieved in this matter. As GS1 was and still is in a steep learning curve and continuing to mature, opportunities are extensively explored into the automation of parts of the solution.

However, the main future impacts will be caused by future developments which cannot be predicted that easily. Who knows when the new ‘Albert Heijn’ will introduce something totally new and inspiriting to this sector requiring services from the GS1 organization? So while GS1 is getting ready for the future, new innovations might require GS1 to innovate as well.

Data Management activities

There is a high need of standardization for better data quality within organizations. Most resulting from internal initiatives, like process optimization or requirements deriving from law and regulations. Standardization doesn’t have to mean that an organization needs to centralize all activities to achieve control. There are different ways to manage the activities around data within an organization. This article gives an introduction on the topic, including some practical examples.

Introduction

The absolute net value of data management activities within companies has yet to reach its peak. Departments have an increasing need for good quality data for reasons of analysis, compliance, growth and efficiency. Maintaining their critical data is for that reason alone the most important activity in the era of digitalization we live in. Therefore, companies should think hard how they want to position and implement these activities for the long term and to consolidate it within a professional data management office.

The evolvement of the Data Management Office

There are several trends visible in the positioning of the data management office over time. But before we continue, we first need to clarify what the definition of a data management office is. We define a data management office as ‘a delegated function of data management activities from the designated data owner’. For example, data maintenance activities and the management of the data lifecycle. The trends identified in figure 1 follow the evolution of the digital developments within organizations:

  1. Data management within the IT function: back in time when organizations first started using automated systems (pre-ERP) as administrative tooling, data was just a record ‘doing nothing’. When issues occurred, this was seen as an IT issue. Obviously, ownership of data was within IT.
  2. A first step towards the business: starting to realize that data is the fuel of many primary business processes, organizations positioned data management activities in the back office of the business. These activities were primarily administrative and operational and did not yet concern the cleansing and/or enrichment of data.
  3. Standardization and centralization: next, organizations started realizing the need for standardization and even centralization of data management activities for different reasons. For example, an ERP implementation, process integration activities; such as optimizing the supply chain and legislation and regulations (for example: SolvencyII, BCBS239, but also data protection regulations). Data collected in ‘secondary systems’ such as file shares was still left most of the time to the whims of the individual, with an incidental records manager as the proverbial exception to the rule.
  4. Hybrid data management organization: currently many companies are struggling with the question of how far should they go with the centralization of the management of data. A centralized data management office often means long lead times, sometimes losing connection with the business. But a decentralized data management office (often within business units), means inconsistencies, less overall view, no specific knowledge of the business and the impact on the IT infrastructure.

C-2017-1-Staaij-01-klein

Figure 1. The evolvement of the Data Management Office. [Click on the image for a larger image]

In other words, there is no right or wrong in centralizing or decentralizing data management activities. Since, we are discussing the positioning of the data management office, there first needs to be a common understanding of two statements. These statements are a pre-condition for successful data management:

  • Data governance needs to be organized top down at a strategic level ([Unen12]). A pre-condition for centralizing or delegating data management is a well-organized data governance structure. Data governance facilitates data ownership and then makes it possible to successfully centralize or delegate data management activities.
  • Data should always be owned by the business ([Jonk11]). Independent from where the data management function will be positioned, the business is always accountable for their data.  Shared service centers or data management offices therefore always have a delegated accountability to maintain the data which is primarily owned by the business (for example: a G/L account is owned by Finance, but can be maintained in a shared service center outside of the finance department).

The above statements will not be further discussed here, but are seen as a condition sine que non for organizing the data management activities.

In the next paragraphs, we will first identify the most important types of data management offices and the most important influencing factors before we elaborate on the positioning of these offices. We will cluster this in a tangible tool (see figure 4) which can be used to facilitate the discussion around centralizing data maintenance activities. This is made tangible with an example of product or material data.

Types of positioning the Data Management Office

As presented in the statements above, data governance needs to be organized top down at a strategic level. The underlying fact of most data management models is that data governance should be centralized as a precondition for an efficient data management office. In the end, delegated operational activities are in need of guidance. A simple example; delegating the data maintenance activities around material master data are in need of guidance. It is not only administrating data, but also validating and enriching the data based on standard definitions and business rules. Three operational models can be recognized, which will be elaborated hereafter.

Centralized

Data will be maintained centrally. The data management office handles all data requests centrally, with no intervention from other stakeholders. This is often a delegated function from a data owner in the business.

Hybrid

Data is maintained partly centrally and partly within other organizational departments. But, the complete data maintenance process end-to-end is managed centrally.

Decentralized

In a decentralized environment all data management activities are managed decentrally. There is no overall data management office managing the process.

Factors of influence: data dimensions, level of automation and available expertise

The choice of the best data management model is dependent on multiple influencing factors: data dimension, the level of automation and available expertise. In choosing the position for your data management office, the first thing to do is identifying the data dimensions that need to be maintained. For example, is the data maintained and used by more than one business function? Secondly, you should focus on the question which level of automation is required and for what processes? Finally you should answer the question, what is the level of expertise within the business related to data management? Can they maintain the quality of data at a decentral level?

Data dimensions

In the context of the decision to maintain data centralized or decentralized the data is categorized into four dimensions: corporate data, shared data, process data and local data. The key reason is that data which is maintained or used from an overarching perspective is potentially relevant for centralized data management activities.

C-2017-1-Staaij-02

Figure 2. Types of positioning the Data Management Office.

Corporate data

External verifiable data is defined as corporate data. There is only one version of the truth which is valid for the entire organization. Corporate data is often externally supplied, for example acquired by a data supplier, such as GS1 where organization can acquire a set of GTIN (EAN) to uniquely identify their products. Also, this data can be delivered via a business relation (client, supplier, etc.). Since there can only be one version of the truth in the entire organization, the data management activities should be organized in a manner that for example the risk of inconsistency in the data and the use of outdated data is mitigated. Governance and even maintenance should be conducted preferably centrally.

Shared data

Like corporate data, there is only one version of the truth throughout the entire organization. Shared data is valid for the entire organization and used for multiple purposes within multiple processes, Such as the name/description of a product. This description should be unique throughout the entire organization. The difference is that this data is not externally verifiable. The risks are the same as with corporate data, but it takes more effort to control the data quality, since the data is not externally verifiable. Governance and maintenance should be managed preferably in the same manner as corporate data.

Process data

A variant of shared data is so called process data. This is data which is used over different disciplines but within one business process. A good example is that of a material or product which has multiple units of measures. One for commercial purposes (define planogram), one for logistical purposes (delivery on pallet or roll container), etc. Independent of the place of maintenance the governance should be managed centrally, but operational activities could be deployed decentrally.

Local data

Local data is only relevant for one discipline, within one process, one department for one purpose. If this data is incorrect it will affect only that specific department and not a complete process or even the entire organization. The risk is therefore relatively low, which means there is no direct need for central governance.

C-2017-1-Staaij-t01-klein

Table 1. Examples of data dimensions. [Click on the image for a larger image]

Level of automation and level of expertise

There are multiple factors to define whether data should be maintained centrally or decentrally. In the end these factors determine whether data can or should be maintained in the business (at source) or in a centralized department, which is purely focusing on data management activities.

As data is owned by the business, the data should preferably be maintained close to the source: the business ([Unen12]). In conclusion, the statement: ‘Data should be maintained in the business, unless…’ is used to define whether this is true or data should be maintained in a centralized data management office. Two important influencing factors are related to the level of automation and the level of expertise in an organization, related to data management activities.

The level of automation defines whether activities can be decentralized

The data management architecture within an organization is highly relevant to decide on the centralization of data management activities or not. As stated in [Unen12] there are three types of data management architectures. This example relates to Master Data Management (MDM), a specific field of expertise within Enterprise Data Management (EDM).

The first model refers to a consolidated approach, where data is maintained in several applications and consolidated in one MDM environment. Purely for the facilitation of consolidated reporting. In the second model, harmonized architecture, the operational maintenance is still in several applications. The difference is that data is centralized and governed in the back-end (MDM) solution, with push functionality to the feeding applications to have the golden record in place. At last we recognize a centralized MDM solution in the architecture, which is feeding all relevant applications using this data. In this last situation all data maintenance activities are centralized in one system.

C-2017-1-Staaij-03-klein

Figure 3. Representation of three types of MDM architectures ([Unen12]). [Click on the image for a larger image]

A data maintenance process can be managed procedurally or it can be automated (or both). This is especially relevant when data ownership (source of data) is divided across multiple stakeholders. A valid and monitored working procedure or workflow needs to be in place to manage the result: complete, accurate and timely data. Therefore, the more data maintenance activities are centralized and automated in a single system (at source) the more activities can take place in the business (decentralized). The main reason is that specific tooling can provide workflow functionality (request, check, update, approve and distribute) to manage the process over multiple stakeholders. A lot of reasons to centralize activities are not relevant in this situation, because extensive workflow functionalities can mitigate a lot of risks, for example:

  • Efficiency: SLA/timings can be implemented in each workflow step;
  • Quality: data quality checks can be implemented in each workflow step;
  • Responsibility: workflow makes the process visible and easier to manage and employees gain a greater insight into how their activities affect other activities in other process steps.

If activities are decentralized in different systems, a strict process management procedure needs to be in place. The relevancy to centralize these activities is more relevant in this situation. This is because efficiency, quality and responsibility is harder to manage decentralized.

Level of expertise in the business

Of course not everything can be automated. Knowledge and expertise to perform data management activities in complex environments cannot be automated completely. Therefore each data management activity should be checked to see whether knowledge and expertise to perform this activity can be transferred to for example back-office functions. The employees managing the data should understand the relationships between data dimensions and attributes to be able to perform an impact analysis on how data will be affected when a new data attribute is introduced or an old one is changed. They should be able to perform control measures on data quality and act when people start deviating their way of working from the desired one.

Decision tree Data Management Office

A decision tree can be used to decide whether data should be maintained in the business (decentralized) or in a data management office (centralized). All elements discussed above are integrated in this decision tree. The decision tree should be used separately for each data object which should be maintained.

C-2017-1-Staaij-04-klein

Figure 4. Decision tree Data Management Office. [Click on the image for a larger image]

The starting statement is as follows: ‘Data should be maintained in the business, if…’:

  1. the data dimension is local data: local data can be maintained in the business. There is no risk of incorrect data which is used over multiple disciplines, departments or processes. Local data is often very specific with no need to delegate or centralize the data management activities of this data dimension. Corporate data, shared data and process data can potentially be considered for central data management in a data management office.
  2. knowledge and expertise cannot be transferred (level of expertise): if the knowledge and expertise needed for data management activities is very complex (in business expertise) and therefore it is not possible to transfer this knowledge to a delegate, these activities should be preferably in the business (at source).
  3. there is a high level of automation: a high level of automation facilitates data management over multiple disciplines, departments or processes. Within one single source of truth and management, workflow management (and related metadata) can facilitate the data management activities over multiple stakeholders.
  4. there is continuity in knowledge, expertise and availability: continuity of data management activities is critical. Data management is no longer just data entry. There is specific knowledge and expertise needed to perform these tasks. For example the continuity of the personnel performing these tasks is relevant in defining if tasks can be done at the business or should be centralized. For example a sales assistant enters their own customers in a system. The job rotation in these functions is high and after one or two years the sales assistant is promoted. Tasks, knowledge and expertise is lost. To have sustainable knowledge and expertise available, continuity is very important in data management. This could therefore be a reason to centralize activities to a dedicated team, where rotation is lower and focus and knowledge management can more easily be integrated in their daily routines.
  5. there is a necessity for speed: all decisions for centralized data management have been made. Centralization means delegation, which means an extra process step. What if the data needs to be directly available for use? For example a new customer calling a sales assistant requesting an order. The necessity of speed in the process is therefore a relevant influencing factor in deciding to centralize activities or not.

The outcome of using the decision tree is not directly set in stone. This decision tree is a tool to think about the reasoning for centralizing activities or not. The tool can be used for each data attribute (field), set of attributes or at an entity level.

C-2017-1-Staaij-t02-klein

Table 2. Examples of using the decision tree on product or material data. [Click on the image for a larger image]

Applying a practical example: product or material data

The management of data about a product or material is often complex in organizations. An example is given to make the use of the decision tree slightly more tangible. But first a quick introduction on some key benefits in the example organization and its product or material data management process.

  1. Receive external data: different external data sources are the fundament of the reflection of the product  or material in the system. Data could be derived from suppliers or for example external data pools. This is often corporate data such as GLN/EAN, with in addition shared data as, for example, the description of the product and unit of measurement (weights, measures).
  2. Enrich with internal data for primary processes (e.g. relevant for ERP): each discipline within the organization, relevant to a product or material is owner of several extra attributes, mostly specific for their process: process data. Examples here are pricing conditions (commercial department) and logistical unit/transportation unit (logistics).
  3. Enrich with internal data for additional purposes (e.g. e-commerce): next to data which is used for the traditional transactional ERP processes, other activities within the company may need far more data for a product or material. Examples here are mainly omni-channel activities, for example, online. Additionally commercial texts, food & beverage information and other digital assets need to be maintained.
Additional context

The data architecture in this example is  highly automated and centralized. The external data sources are interfaced into data management tooling, where advanced workflow functionalities manage the enrichment and validation of the data. Further, this organization is a mature business entity with very few fluctuations in business functions.

Since there are multiple data sources and a complex data management process the question arises: should we maintain the data centrally or can we manage to let each discipline maintain their own part of the data? In table 2 some examples show how to use the decision tree

Conclusion

It is again important to state that there is no right or wrong when positioning a data management office. Before initiating a data management office it is important to identify the critical data and the level of expertise in the organization. In practice there are many cases where organizations forgot the first and acted on the latter, with the result an office full of people who were still formally performing data activities for their previous divisions while doing nothing on data management for the organization as a whole. We have also seen organizations doing the first while forgetting the latter, with the result a highly efficient design and target operating model for data management but with no commitment from departments and no commitment on dedicated or capable resources.

Secondly, data governance remains the critical precondition for success. Without ownership of data people will always give preference to local interests, instead of the interest of the organization as a whole. And it should be enforced from the top down, to ensure standardization, consistency and action on the right scale.

Finally, automation is instrumental in achieving your goals, but IT tooling is just one of the instruments you should use. Alone it can be a solution for the short term, but it will become a problem for the long term. Without the other organizational measures the IT department will again own the data and that is something the business will not accept anymore. The level of automation when used properly will facilitate the movement of data management closer to the business, which is the actual owner and source of the data. Knowing your data is owning your data, and your office is the key.


Data Management through the value chain

Organizations experience an increasing demand for high quality data due to a rise in analysis techniques and the availability of data, as well as increasingly demanding regulations and legislation. However, this demand for quality is not limited to the data residing in the source systems. It has become clear that control over data quality should cover the entire flow of data: from source to report. This gives organizations the opportunity to achieve true data driven reporting and decision making, but also brings along several challenges that need to be overcome.

Introduction

The importance of good data quality is eminent within various sectors and industries ([Jonk12]). It is evident that having more and more access to data from various sources proliferates the importance of high data quality. The need for high data quality is also stimulated by increasing possibilities for analysis and reporting purposes. It is however less clear that this increasing demand for high data quality simultaneously increases the complexity of data. For example, high data quality is moreover demanded to improve organizational performance, support growth, competitive advantage and comply to the growing demands of data driven regulations.

This seems like a contradiction. Having a strong focus on data should gradually resolve quality and maintenance issues throughout an organization. For some organizations this is true for their source systems (i.e. master data management). More and more companies realize that the importance of data quality is not limited to their source data. It extends to the flow of data within their reporting chain (the so-called data flow). This flow requires usage of consistent data definitions and data quality criteria, from source to report.

A focus on this flow of data is relatively new and can be seen throughout different sectors. Internal and external users of reports are wondering if their control information is timely and fact-based, supported by good data quality. Various sectors such as financial services, medical devices, telecommunication, pharmaceutical, the public sector and consumer markets are subject to stricter regulations regarding data collection and usage ([Voor16]). Supervisory authorities are shifting their traditional reporting (output) based monitoring towards data driven supervision, requiring proven data quality consistently used within reporting chains (input and throughput).

The quality of data from source to report

The focus on data quality within reporting chains is seen across industries. Due to progressive regulation as a reaction to the financial crisis, organizing data quality is maturing most rapidly within the Financial Services sector. Various legislation is impacting the data management:

  1. BCBS #239 regarding the collection, disclosure and usage of data right down to the quality of internal decision making;
  2. an extensive and common set of standardized reporting templates complete with built-in data validation rules (Data Point Model);
  3. extensive data-sets at transactional data level (AnaCredit) opening the door to true data-driven reporting (Banking Integrated Reporting Directive).

These requirements all have one thing in common: data quality is paramount and subject to review by external parties such as supervisors. Portfolio decision making can suffer material consequences if data is incorrectly defined and classified. Examples of this are in the Financial Services sector where risk weighting depends on the correct channeling of data into the appropriate portfolios. Failure to do so can severely impact capital and liquidity positions and put the bank or insurance company and its customers at risk. All this strongly increases the need for improved data quality throughout the reporting chain.

It is not only the Financial Services sector, however, that is working on improving the data flows in their reporting chains. In general, the more complex the organization becomes, the more risk it has of not having adequate steering information. For example, a large global energy company with local plants, regional offices and several locations for their head office wants to get a grip on their data flow. Asking themselves relevant questions such as: which data is used within local plants to derive reports, what data quality criteria is applied and which data transformations take place along its flow? In other words: how can insights into the quality and consistency of the data flow be derived?

Within the retail industry there is also a focus on legislation which is driving the need for data flows. Although not (yet) as extensive as financial regulations, the EU regulation on the provision of food information to consumers combines EU rules on general food labeling and nutrition labelling into one piece of legislation.[https://www.food.gov.uk/enforcement/regulation/fir/labelling] The new regulation makes nutrition labeling mandatory, and instructs food manufacturers to provide information on the energy value and six nutrients. This means for retailers that they need to have access to the data which was created earlier in the manufacturing supply chain, i.e. by the supplier. Given the fact that retailers have a multitude of suppliers a so-called data pool (governed by GS1)[www.gs1.com] has been set up that functions as a storage facility for both the food suppliers (delivering input into the data pool) and retailers (using the data pool to be able to inform their customers with specific data about, for instance, allergies). Thus setting up a complete data flow where suppliers, retailers and consumers deliver and use consistent, correct and timely data.

Main challenges in managing data flows

Whether organizations are driven by increasing regulations within their sector or because there is acknowledgement that the environment requires fast and flexible insights and fact-based decision taking, a growing number of organizations are transforming to a data-driven organization. Those organizations have already found that improving their existing data management and usage activities is usually experienced as complex. This is caused by amongst others unclear ownership, limited understanding of data (quality) and the tendency to be convinced that data management is an IT department responsibility rather than a business responsibility. However within this complexity, capturing and improving a data flow (or reporting flow) has turned out to have its own distinctive set of challenges.

Understanding data flows
  • Unfamiliarity with compliance at the required granular data level means that organizations have the tendency to back away from it, especially if data is transported and transformed. Particularly when transformations are complex, it can require specialist effort to determine which data elements refer to one another;
  • Organizations have difficulties in distinguishing a process flow from a reporting flow, assuming that existing process flows can function as a data flow overview;
  • Lacking overview of the Key Data Elements (KDEs) that are used for different reporting purposes within systems, departments, processes and End User Computing solutions (e.g. Excel) within the reporting flow – especially if employees are only familiar with their (silo-based) tasks and cannot oversee the complete or even partial flow, nor the materiality of these KDEs;
  • The complexity of tracking data increases in companies with complex IT environments for example caused by many legacy systems and/or an extensive reporting flow. A general rule of thumb is that the more End User Computing within a flow, the more complicated it is to capture and maintain.

Solid Data Management is a good starting point

To address data driven challenges in general, organizations adopt, develop and incorporate comprehensive data management ([Voor13]). The adaptation of data management for the complete value flow has led to the development of a set of measures supporting control of data quality from source to reporting. These measures support requirements of data driven regulatory compliance:

  • Data policy and organization: this set of measures consists of a data management strategy, resulting in policies and guidelines. The set of policies and procedures that determine the who, how, and why of data management within the organization, thereby offering clear guidance on how data is governed and managed;
  • Data: this set of measure consists of an end-to-end overview of data used (i.e. a data flow), specifying data sources, key data and meta data such as data ownership, characteristics, usage and modifications. As well as risks and limitations concerning the data;
  • Data processes: this set of measure consists of data management processes (i.e. data lifecycle processes) including relevant external and internal data interfaces, requirements and controls. It includes data quality management and data issue resolution processes (all activities and procedures that aim to avoid errors or omissions in data and if errors are discovered, all activities to correct and prevent recurrence), data delivery agreements and/or service level agreements should be in place;
  • General IT: this set of measures consists of a complete overview of the IT infrastructure landscape and the related – risk based – IT general controls, thereby safeguarding continuity and integrity. The landscape includes all relevant outsourced and/or managed by third parties systems and applications;
  • Application systems: this set of measures consists of a complete overview of all used application systems: source systems, end user computing, risk engines and other tooling. This includes all descriptions concerning the functioning, controlling and continuity application controls, risk classification, access management, change and version management;
  • Data controlling: this set of measures consists of all aspects that monitor and control the effectiveness of policies, procedures, processes, IT and application systems maintain the required data quality standards.

These measures to support capturing and maintaining the data flow within the reporting chain are heavily interlocked. For example, once a data quality rule has been defined, data ownership needs to be in place to validate that rule. Determining controls within a data flow, means that system owners need to be in place who can rely on risk analysis and policies. Having a data management organization (DMO) in place means pro-active and consistent governance of the data from record to report. An extensive elaboration on DMOs and data governance can be found in [Staa17]. So having data management in place supports capturing, sustainable maintenance and improving a data flow.

Principles for good future-proof Data Management

To define and manage data within the reporting flow, all the measures as mentioned before need to be placed. This makes data management complex to address. So organizations are especially interested in guiding principles to be able to cope with data (quality) challenges within the reporting flow from record-to-report.

  • Organizations need to understand, identify and document how data moves (flows) and transforms throughout their reporting chain from source to reports. In order to fully understand and communicate the data flow to different stakeholders (e.g. report owners or an external supervisory body), it needs to be distinguished at different levels of detail and granularity. The starting point is to identify systems, applications and databases in which relevant data has been stored (i.e. the system level). This overview subsequently enables the identification of relevant data sets and moreover how data sets move across the systems, departments and processes (i.e. data set level). Finally, each data set consists of data attributes; this is the lowest level of detail. Tracking and tracing data attributes from source to report is considered as data lineage. Data lineage is the most detailed description of the data flow, from the source system to its destination, including all transformations, mutations and enrichments it undergoes along the way.
  • In theory, most organizations strive to completely capture the data flow in their IT systems by means of Straight-Through Processing (STP). In practice and for most organizations, data flows are (to an important extent) manually transported, transformed and controlled. Manual activities are usually time consuming and have an increased risk of errors. The current rise of software robotics offers a relatively low-cost alternative for automating the flows and reporting deviations, at least as a short-term solution until STP is embedded.
  • Once relevant data attributes have been identified throughout the dataflow (data lineage), data can be classified into various categories. Classification of data enables categorization of data based on homogeneous characteristics in order to assess the impact and materiality of data elements in end-user reports. This also helps identify Key Data Elements (KDEs) which are the basis for reports.
  • The next step is to document consistent definitions of those data elements. A data definition should explicitly describe the meaning of the data element and the context for which (business) purpose the data is being used. Data definitions should be documented in a centralized repository such as a Data Directory. A Data Directory can be considered as an inventory that specifies (e.g.) the source, location, definition, ownership, usage, and destination of all of the data elements that are stored in a database.
  • When data definitions are formulated and documented, data quality criteria (also known as business rules) should be created from a business perspective. Data quality criteria can be distinguished in different dimensions (e.g. to measure the completeness, accuracy, timeliness, correctness or uniqueness of the data). Again, the set of applied data quality criteria should be stored in a single repository such as a Data Directory. Within the complete dataflow, risk based controls need to be in place. This consist of both application controls, manual controls as well as IT General Controls.
  • The data quality criteria can subsequently be used to measure, monitor and demonstrate the actual quality of the underlying data elements which are used in your reports (finance, risk, management information). Dashboarding or data quality tools can support this process. Data which does not comply to the data quality criteria can be considered as data issues. A data cleansing process should be in place to cleanse those identified data issues.

Turning theory into practice: examples of practical approaches

Several organizations have defined their data flow based on the data management methodology and guiding principles as described above, some generating regulatory compliance in the process and setting up a management organization to maintain their data quality from source to report.

Insurer and Solvency II regulation

A large Dutch insurer pursued regulatory compliance for Solvency II. As Solvency II requires that each insurer has to ‘prove that they are in control of the data which is used for regulatory reporting’ the company recognized data quality and data management as a substantial domain of their SII approach. The current status of their data quality as well as the data flow/lineage was not clear. Nor was a governance body in place to maintain and assure sustainable data control.

The approach consisted of setting up a data governance, including a Target Operating Model for the Data Management Organization, standardized data life cycle & governance processes, policies, roles and responsibilities. Simultaneously the insurer assessed the data quality of SII relevant master data. providing data quality insights at an early phase of the implementation is beneficial for the common understanding of data, data quality, the requirement to address data at the smallest detail level (Key Data Elements) as well as generating a changing attitude towards data. Visualization of data quality makes people from executive level (e.g. the data owners) through to the operation level (data entry) understand how good data quality and consistent data definitions impacts their daily business as well as chain overarching processes. This attitude supported a speedy design of complete and a clear end-to-end description of their data flows within the reporting chains, including the extensive usage of End User Computing (here: MS Excel) within their actuarial processes. As an additional benefit of these insights into their data flows, discussions started to further improve and automate the processing of data, mainly in the actuarial departments.

Data quality online investment bank

This bank strived to become a data driven organization, where it had – as Tier 2 bank – less focus on regulation and more on fact based control information and fast customer insights. For these purposes they defined two tracks:

  1. realizing a data management organization based on data governance, process and IT controls and retention framework (e.g. privacy retention periods);
  2. setting up a data flow for reporting purposes based on new functionalities of a data lake (see also the ‘Data Lake’ text box).

Within this data lake quality criteria and definitions for data attributes where defined for both input from internal and external data suppliers as well as data users (i.e. data scientists). This meant that within the data lake attributes needed to be known and governed, based on the set of – interlocked – measures for data quality in the reporting flow.

So, whether the data in a reporting flow is governed from a compliance or innovation perspective, data quality measures do always need to be in place.

Data Lake

There are two primary solutions for storing large amounts of data for analysis purposes: a data warehouse and a data lake. While they serve the same purpose, they differ in some key areas ([Kuit16]).

A data warehouse is a combination of multiple databases and/or flat files, creating one integrated, time-variant and non-volatile collection of data. In practice, this means that data from multiple databases is stored in the warehouse through an ETL (Extraction, Transformation, Loading) process. This process ensures the data is integrated before entering the data warehouse. The fact that it is time-variant means historical data is stored in the data warehouse where the data does not change once it’s inside the data warehouse.

Recently, the concept of the data lake has made its appearance. The idea of the data lake is similar to a data warehouse: providing a large collection of data to analyze. However, whereas the data warehouse only uses structured data, the data lake uses a combination of structured data and unstructured data (emails, social media, PDF files, and so on). As it uses this combination, the data is not integrated before entering the data lake. Rather, the structure of the provided data is determined when the analysis starts. This also means a data lake is more agile in its configuration than the data warehouse: it can be reconfigured as needed.

In practice, both solutions affect the insight an organization has into its record-to-report process differently. As a data warehouse has a more rigid structure, it should theoretically be quite easy to see where the data used for the report originates from. In practice this is not always the case, as organizations do not always have complete insight into their data warehouse structure and the ETL process, which were often built relatively long ago. The data lake offers better insight into the record-to-report process, as the analysis (and thus the structure) is very flexible and created only as early as it is needed for the report. This means that as you create the analysis for the report, you simultaneously define the data flow.


It’s nothing personal, or is it?

The common way of working of an individual employee has radically transformed since the digitization of companies in the twenty-first century. Many versions of the same document are scattered throughout the company, or stored somewhere on a shared server, and communication goes directly through email, Skype, WhatsApp, and so on. All very flexible and fast, but the number of documents and communication has become so large that oversight is lost in most companies, raising serious compliance and operational issues. How to get a grip on documents and records? By making it personal!

Just another day at the office…

A critical deadline is quickly approaching. For months you and your closest colleagues have been working on a complex report for the board, but your efforts were fruitful and you seem to be ready on time. Then, disaster strikes. The input of one of the stakeholders who needs to approve the report appears not to be included in the final version and nobody seems to know in which version to search. Another question pops up: who has the latest version? Who is the owner of the final version? Where can I find the documents that contain the input of the stakeholder, but seem to be stored ‘somewhere on the share’? Did that colleague email it to me yesterday? If so, where are the attachments? Have we been working separately in the same document without knowing? Who is responsible for this mess? Can we still meet our deadline?

If you recognize yourself in the situation described above, do not be alarmed, you are not alone… Ever since the digitization of companies in the early twenty-first century, the common way of working of an individual employee has radically transformed. Every day, companies create, change, share and store millions of documents and emails. All aspects of the document life cycle, from creation to archiving, including the correspondence within and outside the company have fundamentally changed. We do not send letters anymore, but communicate directly by email, Skype, WhatsApp, and so on. We do not work in isolation on a product anymore, but send our earliest versions at any convenience to anyone we want to read it. We were used to expect a reply within a week; now some of us get annoyed when we have to wait more than an hour. We misuse our e-mail inbox intentionally as a back-up and search medium, because we are either too preoccupied or simply too lazy to manage our documents properly. And finally we used to keep our relevant documents close, now we store them without thinking on a shared server without using a good description most of the time, let alone making them ready for the purpose of archiving.

Challenges of our new era

It is obvious that this new way of working creates challenges. The number of documents and communication has become so large, even employees no longer have insight into what they have or have not received. Consequently, this leaves a feeling of work that is never finished, it causes frustration when documents are for example not immediately found, or despair when going through a flooded email inbox. Furthermore, knowledge and expertise is strongly fragmented among individual employees, because information is perceived as personal property. This creates a working environment in which it is unclear what the relevant information is, who the owner is and what the corporate strategy is to manage the information.

This leads to the unfortunate effect of an inefficient daily course of operations, a situation of incompliancy with laws and regulations and a high dependency on specific people. The same is illustrated in one of our client cases.

We ourselves are to blame for our current situation

It is a fact that not many companies have invested in Document and Records Management yet, let alone are on par with what is necessary to ensure good quality of information. What are the reasons behind the lack of attention for this domain? The answer is complex. One of the reasons that many companies are struggling to deal with this topic is that information has become something personal, instead of the property of a company. In essence, we consider document and records a personal asset without taking corporate ownership and responsibility. Back in the days when the number of documents was still manageable and communication was not as elusive as it is today, documents were perceived as an organizational asset. Today, many employees keep documents and information collected and created over the course of years to themselves, without feeling the need to share the company’s intellectual property. All knowledge about relevant documents is mostly concentrated at a small group of persons who use these documents primarily for the benefit of themselves and their direct colleagues. This situation could only arise because digitization was introduced gradually, and the responsible management could not judge appropriately what the impact would be on the information structure and way of working within the enterprise.

The case of a Dutch pension fund

A Dutch pension fund was facing similar issues as described earlier. In our assessment, it turned out that this company possessed almost one million files, some almost thirty years old. Documents critical to the organization or with a formal status were not always properly stored, nor were they traceable, archived or deleted. Examples were given in which employees were searching for a relevant document for more than three days, delaying other work and creating risks to the fund in legal cases.

The situation was created by the employees of the fund over the course of more than 20 years. It was certainly not done on purpose; Document and Records Management was simply not a point of attention. It created an environment for the individual employee to exercise their daily job without limits to document storage and archiving, leading to a large share containing many files in numerous versions without any form of naming convention. Not to mention the use of email and files stored locally. Email boxes were unlimited in size and therefore used as an easy way to chat with colleagues or exchange hundreds of versions of a file with many colleagues or as a poor substitute of an archiving application.

What was intriguing about the chaos that had emerged is that the direct effect on the daily business was not directly visible. The employees of the pension fund all developed their own way of working, knowing where to find documents in the latest version and accepting the loss of time in the use of several work-arounds. If information could not be found, one knew who to ask and another version was created and mailed. Still, all of the knowledge kept was concentrated at one or just a few employees. If these employees will  leave the organization at some point in time, or when one of them forgets the location of  relevant documents, then the full effect of this tolerated inefficiency will be become clear.

As a solution, we designed and implemented Document and Records Management at the pension fund, focusing on implementing a new more controlled individual way of working.

However, we ourselves are to blame. We blame our organization for not supporting us enough with ‘our’ information, while storing all relevant documents in our personal mailbox. We get irritated when we do not find the right document, but forget that we ourselves stored that document somewhere, somehow, without providing it with a proper description in the first place. We lose track of which version to use, but do nothing to manage earlier versions and finally we know policies on archiving and using templates exist, but decide to circumvent them where possible.

C-2017-1-Martijn-01-klein

Figure 1. Value and necessity of Document and Records Management. [Click on the image for a larger image]

What is Document & Records Management?

Document Management is the (automated) coordination and control of the flow (storage, retrieval, processing, printing, routing, and distribution) of electronic and paper documents in a secure and efficient manner, to ensure that they are accessible to authorized personnel as and when required.

Some, but not all, documents within an organization become records. A record is a document with a formal status that needs to be made unchangeable for the sake of evidence and needs to be kept apart from other documents that are still necessary for the day-to day operations.

Records Management is focused on applying the required retention periods to stored items, identifying the owner of each records series, determining that a chain of custody and a proper audit trail both exist, assisting in e-discovery issues and applying legal holds to records when needed, managing the disposition (disposal of documents) and finally preserving records throughout their life cycle.[Derived partly from https://www.laserfiche.com/ecmblog/whats-the-difference-between-document-and-records-management for a concise definition. The proper standards for Document Management and Records Management are at this moment respectively ISO 10244 and ISO 15489.]

Does this mean that the situation of some decades ago was better in every way? Certainly not. Collaboration and the creation of documents is far easier these days. However, we used to have clear agreements on what documents and what records were important. We knew how long information needed to be stored or archived and when to discard the information. Finally, we had departments on a corporate level that supported us in managing information on an operational level. Setting the challenges aside, the digital era of today also brings numerous advantages compared to the past, such as easy collaboration, reuse of data, place and time-independent working and data accessibility wherever necessary.

To unlock the hidden value of documents and records in the digital era, we have to acknowledge our individual responsibilities more than we do now to rely on our own information and provide enough support from a corporate level for those documents and records that are important for the organization as a whole. But most importantly: make it personal!

Step 1: Make it personal

The first step is to make it personal. Consequently, the organization should start by creating awareness with the employee. Below are some examples of important statements regarding Document and Records Management:

  • Realize that you are part of a process, so act accordingly. This includes knowing which tasks to fulfil, including the documents that should be created, shared, administered and handed over, but certainly also what the relation of those tasks is to other tasks in the process and those in related processes.
  • Make a clear distinction between documents and records (archive) in your daily operations and handle them accordingly.
  • Identify documents with a formal status or those that have a value for more than one department or business process and hand them over to those responsible in the organization when the document is in a final state.
  • Understand the value of metadata and keep a list of relevant keywords you use to tag documents.
  • Use predefined templates as much as possible, though keep challenging yourself and those responsible for the document in the application of the template.
  • Keep only those versions of a document that are necessary for the completion of tasks; remove the rest.
  • Agree upon ownership during the life cycle of a document upfront, before starting a process.
  • Do not misuse your email box for archiving purposes and chat functionalities, but only use it for formal communication.
  • Take notice of the agreed-upon naming conventions within your organization, or when absent, propose naming conventions.

Step 2: Enabling the organization

Parallel to creating awareness among employees, the organization should be enabled for proper Document and Records Management. The company should at first develop a framework for Document and Records Management; including a set of guiding principles, ownership of information, the desired end-state and a strategy to reach this new desired situation. Again, it is key to focus this framework both from the perspective of the company as from an individual perspective. The implementation of the frameworks asks for a tailor-made personal approach, requiring the employee to change his or her way of working, even though it may have been the same for the last 20+ years. We provide you with an example of such a framework in Figure 2.

C-2017-1-Martijn-02

Figure 2. KPMG’s framework for Document and Records Management.

The example framework (Figure 2) contains the following elements:

  • Organization deals with information governance and other organizational aspects. This includes for example the definition of roles and their accountabilities, ownership structures and the commitment of stakeholders.
  • Systems & Information covers aspects about IT infrastructure and the quality of documents, templates, metadata and records in terms of completeness, accuracy and reliability. Moreover, appropriate systems need to be available in order to deliver proper functionalities (e.g. template management/versioning/archiving).
  • The pillar Processes is about the design and implementation of relevant processes, such as processes where data has been created, stored, maintained, transmitted, used, updated, handled, stored and destroyed, including their controls, KPIs and legal requirements.
  • The pillar People deals with questions around the employee as an individual and organizational culture. For example, which interventions need to be taken in order to achieve that every employee will work in an integral and consistent manner with regard to Document and Records Management.

The second action is to provide the individual with the set of principles and show the gap between the current way of working and the desired way of working. Those include the elements as outlined in the framework. Thirdly, set up a small division dedicated to supporting information management, parallel to the already existing IT department. Thereafter, provide them with the proper tooling and automation of process steps where possible and finally, involve important key experts on certain documents and records in the implementation, to safeguard their knowledge and expertise for the organization as a whole.

For our client, we designed and implemented Document and Records Management according to the principles as outlined in this article; make it personal and enable the organization.

Dutch pension fund: personal approach to structure the company’s information

We designed and implemented Document and Records Management at the pension fund according to the displayed framework, focusing on the individual way of working. To achieve this, we started by defining principles together with the board, based on our assessment. These principles defined the guidelines for Document and Records Management within the pension fund, determining the roadmap to design and implement these and in the near future even the larger ambition of information management.

At first, a policy for document management and an archiving policy were drafted, as the basis for the newly designed governance organization for documents and records. This sets the boundaries for the redesigned processes. We reviewed the existing business processes such as contract management for the creation, editing, archiving and deletion of documents and introduced measures such as the settlement of ownership, the mandatory creation of metadata (e.g. keywords, owner, subject) and the use of pre-defined templates for common and important documents.

Most importantly, the employees had to be guided in changing their way of working. In this new way of working, the employee requires more extensive knowledge of its role in the process and the context in the organization, but also the documents and records that he or she handles. Contrary to earlier, the employee has to take into account metadata creation, the use of templates and compliance to legal requirements through for example archiving procedures. All this is facilitated by SharePoint, incorporating controlled document storage, archiving and governance through workflows. To achieve the change, we involved experts in the field of change management, to assist us in ‘delivering the message’.

Concluding

Unlocking the hidden value of Document and Records Management can be achieved by conducting two essential steps: make it personal and enable the organization. Properly taking into account these two aspects will create structure in the document and archive chaos that has emerged over the last decades and support business efficiency and compliance.