
The database evolution: modernization for a data-driven world

As AI emerges, data is becoming more important than ever. In order to stay relevant, organizations have to start using their data to fuel their business models and improve their operations. However, large volumes of data do present challenges. In this article, we briefly revisit the history of databases to learn how these challenges have been tackled one by one in the course of the history of databases. Finally, we will discuss why organizations need to adopt the latest in database technology and the possible scenarios to implement this technology.

Introduction

During the COVID-19 pandemic, businesses needed to respond to immediate needs created by the global crisis. On-premises systems lacked the scalability to support working from home for many people. Cloud technology helped businesses to respond to these challenges with cloud-based VPNs, cloud-based firewalls and modern workplace systems. Many organizations needed to work through the recovery from the pandemic with new approaches leveraging cloud-based technology, and in some cases, even looking to reimagine their businesses for the long term.

Data is a valuable commodity for companies because of its potential to empower better decision-making. However, data management tools and processes must be equipped to handle the volume, velocity, and variety of data that companies face today. According to [Abdu22], the exploding volume of data and the many new applications that generate and consume it have created an urgent need for data management programs to help organizations stay on top of their data.

Now let’s first take a step back into history to see where we came from and get an understanding of what these data management programs need to accomplish. We will then briefly explain the pain points of classic database systems before we discuss how modern database management systems overcome some of the challenges that many organizations face today. Finally, we will discuss the different approaches that database management programs can take to implement a modern database management system.

A brief history of database management systems

The history of databases dates back long before computers were invented. In the past, data was stored in journals, libraries, and filing cabinets, taking up space and making it difficult to find and back up data as well as making analyses and correlations. The advent of computers in the early 1960s marked the beginning of computerized databases. In 1960, Charles W. Bachman designed the integrated database system, the “first” DBMS. IBM, not wanting to be left out, created a database system of its own, known as IMS. [Foot21] describes both database systems as the forerunners of navigational databases. According to [Kell22] however, the history of databases as we know them, really begins in 1970.

In 1970, a computer scientist from IBM named Edgar F. Codd published an academic paper titled A Relational Model for Data for Large Shared Banks. Codd described a new way of modeling data by introducing relational tables to store data only once. This system (Relational Database Management System (RDBMS) ) allowed the database to answer any question as long as the data was in it, and allowed efficient use of storage. Back then, storage was still a major challenge with hard drives having the size of a truck wheel and being quite expensive.

In the eighties and nineties, relational databases grew increasingly dominant. IBM developed SQL the Structured Query Language, which became the language of data and became ANSI and OSI standards in 1986 and 1987. When processing speeds got higher and “unstructured” data (art, photographs, music etc.) became much more commonplace, a new requirement came to light. Unstructured data is both non-relational and schema-less. RDBMS were simply not designed to handle this kind of data. With growing amounts of data and new purposes being explored, new database management systems were developed, such as systems using column stores and key-value stores. Each of these systems had strengths and limitations that would make them suited for a limited use case. NoSQL (“Not Only” Structured Query Language) came out in response to the need for faster speed and processing of unstructured data ([Foot21]).

In the 2010s and 2020s, Database Management Systems (DBMS) have been evolving and innovating to meet the emerging needs and challenges of management information systems and other applications. It started with the ability to run your DBMS in the cloud on a cloud-based infrastructure, but soon after software companies such as Microsoft began to offer native cloud DBMS. In a native cloud DBMS, the vendor is responsible for the full service of the DBMS, including hosting, hardware, licenses, upgrades and maintenance. Cloud DBMS, which are hosted and managed on cloud platforms, offer benefits in cost, availability, scalability, and security, as well as enabling users to access data from anywhere and anytime. Based on research by [Ulag23], AI-enhanced DBMS use artificial intelligence techniques to enhance the functionality and performance of DBMS, with benefits in automation, management, optimization, and intelligence.

Larger volumes of data, the need to work with varying teams across different locations with this data and the need to keep costs down, continues to drive new database technologies.

Pain points of classic database systems

Classic on-premises database systems are limited in terms of scalability and maintainability. The hardware behind these systems limits the size of their storage and their computational power and can often not be expanded without significant investment. Since these systems often have a different array of capabilities which requires products from multiple vendors, maintenance is expensive and difficult.

Classic, on-premises, databases eventually create the following pain points:

  1. Cost and infrastructure management:
    • Hardware costs: One of the most significant pain points is the substantial upfront cost associated with purchasing and maintaining the necessary hardware infrastructure. This includes servers, storage devices, networking equipment, and cooling systems. Organizations need to budget for hardware upgrades and replacements over time.
    • Operational costs: Apart from the initial capital expenditure, there are ongoing operational costs, such as electricity, space, and skilled IT personnel to manage and maintain the on-premises infrastructure. Scaling the infrastructure to accommodate growth can be both costly and time-consuming.
  2. Scalability and flexibility:
    • Limited scalability: On-premises DBMS solutions often have finite capacity limits based on the hardware infrastructure in place. Scaling up to accommodate increasing data volumes or user demands can be slow and expensive, requiring the procurement of new hardware.
    • Lack of flexibility: Making changes to the infrastructure or DBMS configurations can be cumbersome. It may involve downtime, complex migration processes, and compatibility issues, limiting an organization’s ability to quickly adapt to changing business needs.
  3. Maintenance and security:
    • Maintenance overhead: On-premises DBMS solutions require constant maintenance, including software updates, patch management, and hardware maintenance. This can be time-consuming and may disrupt normal operations.
    • Security concerns: Organizations are responsible for implementing robust security measures to protect their on-premises databases. This includes physical security, data encryption, access control, and disaster recovery planning. Failing to address these security concerns adequately can lead to data breaches and regulatory compliance issues.
    • While on-premises DBMS solutions provide organizations with greater control over their data and infrastructure, they also come with significant challenges. Many businesses are turning to cloud-based database solutions to alleviate these pain points, as they offer greater scalability, reduced infrastructure management overhead, and enhanced flexibility, among other benefits. However, the choice between on-premises and cloud-based databases should be based on an organization’s specific needs, budget, and regulatory requirements.

Most companies, today, use combinations of public clouds and private clouds. The database management systems need to be able to provide access to data sources across these different cloud offerings. In classic database management systems, different workloads are needed to work on their own data, each workload having its own governance structure. This leads to redundant data in different locations and the need to duplicate this data to a data warehouse for analytics resulting in redundant data. Security across these different workloads and redundant, scattered data is a common pain point for organizations.

The case for modernization

According to [Ulag23]: In the age of artificial intelligence (AI), the ability to analyze, monitor and act on real-time data is becoming crucial for companies that wish to remain competitive in their industries. Therefore, modern database systems need to be able to handle large volumes of data coming from multiple data sources like sensors, IOT devices and many other data sources. This data needs to be ingested into the data analytics environment with high throughput and low latency.

When considering application modernization and therefore also database modernization, the question might be how to get this complex database technology transformation right. Almost any application collects, stores, retrieves and manages data in some sort of database. As we have seen, traditionally this was often done using a relational database management system (RDBMS) on a dedicated, often on-premises, server. As discussed, these types of databases provide organizations with increasing problems regarding:

  • high license and hardware costs;
  • license compliance constraints (e.g. expensive Java clients);
  • new sources and types of data, often unstructured;
  • scalability performance and global expansion needs;
  • modern applications often needing cloud-native agility and speed of innovation which cannot easily be achieved with dedicated hardware in an on-premises situation.

According to [Gris23], a modernization path therefore needs to include the following business and technology gains:

  • Use open-source compatible databases with global scale capabilities.
  • Remove the undifferentiated heavy lifting of self-managing database servers and move to managed database offerings.
  • Unlock the value of data, and make it accessible across application areas and organizations such as analytics, data lakes, Business Intelligence (BI), Machine Learning (ML) and Artificial Intelligence (AI).
  • Enable decoupled architectures (event driven, micro services).
  • Use highly scalable purpose-built databases that are appropriate for non-relational and streaming data.

Database modernization patterns

In our consulting practice we recognize four common patterns for database modernization:

  1. Lift and shift: Move a database server to a public cloud service like Azure, Google Cloud or Amazon Web Services.

    In this scenario, the organization simply deploys a Virtual Machine (VM) in their private or public cloud and runs the exact same database management software from this (IaaS) machine. Each application is migrated as-is. It is a quick solution without the risks or costs associated with making changes to code or software architecture. The downside of course is that the organization remain responsible for the maintenance of the VM, still must pay the associated licenses and although improved, still has scalability limitations with respect to storage and compute.
  2. Refactor or repackage: This migration strategy involves limited changes to the application design and moves the database to a managed instance such as Azure SQL Managed Instance or Amazon RDS for SQL Server.

    In this scenario, licenses are replaced by a consumption-based model and limitations with respect to scalability decrease. The database system is managed by the service provider and the organization therefore no longer has to manage the hardware, operating systems or perform maintenance on the RDBMS.
  3. Rearchitect: By modifying or extending the application’s code base, the application is scaled and optimized for the cloud. In this scenario, the application will be using a public cloud-native database management system such as Aurora (AWS), Google’s Cloud SQL or Azure SQL Database. This scenario has all the advantages of leveraging a modern database solution that fulfils the need of a better practice modernization path as described above. However, not all applications can be modernized to the extent needed, sometimes it is simply better to build cloud-native applications.
  4. Rebuild: The application and its database will be rebuilt from scratch in this scenario. Leveraging cloud-native development platforms and leveraging cloud-native database solutions such as Microsoft Dataverse, Microsoft Azure Serverless SQL Pools, Google Cloud SQL and Amazon Aurora Serverless.

Compare the complexity and value proposition for these options in Table 1 containing different modernization patterns. A low complexity means that few dependencies and not much changes need to be made to the software that use the DBMS, and high complexity means that many dependencies and substantial changes need to be made to the software that uses the DBMS.

C-2023-2-Vierling-t1-klein

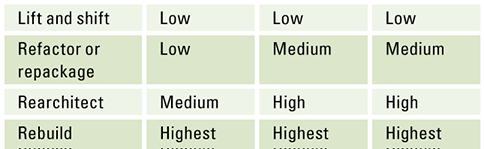
Table 1. Different modernization patterns. [Click on the image for a larger image]

A lift and shift approach is a quick solution with minimal risks, it helps in cases where hardware needs to be replaced imminently and reduces the risk associated with changing software. It does not change the licensing nor the limitations with respect to storage and compute that are associated with the limitations of a Virtual Machine and the RDBMS system. It can be a very good start when an organization needs to renew their data center contracts or when hardware needs to be replaced.

If the goal is to improve the management of data around your application landscape and not yet modernize the applications, rearchitecting the application landscape by changing to a managed instance for your database system can be a viable solution. It helps the organization to become less dependent on hardware and maintenance of the database management system. It will however remain dependent on dedicated hardware, now managed by a service provider, and will therefore still have limitations with respect to scalability (storage and compute). The risk of this scenario is also relatively low since it does not require changes to the DB schema, data types, and table structure.

If the goal is to fully modernize the application landscape and independent of hardware, maintenance and licenses a complete rebuild is in order. This modernization pattern has the highest risk and will cost the most, because both software and DBMS need to change, but it does allow the organization to use the database as a service and become fully independent of hardware, maintenance and licenses.

Conclusion

With the increase of data volumes, the increasing need for speedy access to data, the processing of unstructured data and the decentralization of data, database management systems have evolved from simple relational databases to modern cloud-based database management systems that can:

  • manage the needs of the increasing number of cloud-native applications;
  • manage governance across databases;
  • perform data analytics on a large volume of data in near real time, with no extraction, transformation or loading pipelines and no performance impact on transactional workloads; and with anyone in the organization able to access and analyze the data.

Breaking free from legacy databases allows the organization to migrate away from complex licensing structures to a pay-as-you-go scenario. It also breaks free from scalability limitations since most of the cloud-native database management systems separate storage from compute and have these run in a separate layer completely detached from the hardware layer. Owners of serverless applications are not concerned with capacity planning, configuration, management, maintenance, fault tolerance, or scaling of containers, VMs, or physical servers, the cloud provider allocates machine resources on demand, taking care of the servers on behalf of their customers.

In our consulting practice, we see four different migration patterns that organizations can choose from to migrate to a modernized data platform with varying degree of risks and costs and therefore also rewards. Depending on the organization’s goals and ambitions, a fitting migration pattern can be chosen.

References

[Abdu22] Abdullahi, A. (2022, October 28). What is data modernization? Retrieved from: https://www.techrepublic.com/article/what-is-data-modernization/

[Foot21] Foote, K.D. (2021, October 25). A Brief History of Database Management. Retrieved from: https://www.studocu.com/row/document/federal-college-of-education-special-oyo/computer-science/a-brief-history-of-database-management/40351890

[Gris23] Grischenko, A. & Rajain, S. (2023, July 12). How to plan for a successful database modernization. Retrieved from: https://aws.amazon.com/blogs/database/how-to-plan-for-a-successful-database-modernization/

[Kell22] Kelly, D. (2022, February 24). A brief history of databases: from relational to no SQL to distributed SQL. Retrieved from: https://www.cockroachlabs.com/blog/history-of-databases-distributed-sql/

[Li23] Li, A. (ASA). (2023, July 27). Microsoft Fabric Event Streams: Generating Real-time Insights with Python, KQL and PowerBI. Retrieved from: https://blog.fabric.microsoft.com/en-us/blog/author/Alicia%20Li%20(ASA)

[Ulag23] Ulagaratchagan, A. (2023, May 23). Introducing Microsoft Fabric: Data analytics for the era of AI. Retrieved from: https://azure.microsoft.com/en-us/blog/introducing-microsoft-fabric-data-analytics-for-the-era-of-ai/

Celebrating fifty years of Compact and Digital Trust

On 7 June 2023, an event was hosted by KPMG to celebrate 50 years of Compact, in Amstelveen. Over 120 participants gathered to explore the challenges and opportunities surrounding Digital Trust. Together with Alexander Klöpping, journalist and tech entrepreneur, the event provided four interactive workshops, focusing on each topic of ESG, AI Algorithms, Digital Trust, and upcoming EU Data Acts, giving participants of various industries and organizations insights and take-aways for dealing with their digital challenges.

Introduction

As Compact celebrated its fiftieth anniversary, the technology environment had experienced technology evolutions that people could never have imagined fifty years ago. Despite countless possibilities, the question of trust and data privacy has become more critical than ever. As ChatGPT represents a significant advancement in “understanding” and generating human-like texts and programming code, you would never be able to predict what could be possible by AI Algorithms in the next fifty years. We need to take actions on ethical considerations or controversies. With rapidly advancing technologies, how can people or organizations expect to protect their own interest or privacy in terms of Digital Trust?

Together with Alexander Klöpping, journalist and tech entrepreneur, the participants had an opportunity to embark on a journey to evaluate the past, improve the present and learn how to embrace the future of Digital Trust.

In this event recap, we will guide you through the event and workshop topics to share important take-aways from ESG, AI Algorithms, Digital Trust, and upcoming EU Data Acts workshops.

C-2023-2-Saski-f1-klein

Foreseeing the Future of Digital Trust

Soon a personally written article like this could become a rare occasion as most texts might be AI-generated. That’s one of the predictions of the AI development shared by Alexander Klöpping, during his session “Future of Digital Trust”. Over the past few years, generative AI has experienced significant advancements which led to the revolutionary opportunities in creating and processing text, image, code, and other types of data. However, such rapid development is – besides all kinds of innovative opportunities – also associated with high risks when it comes to the reliability of AI-generated outputs and the security of sensitive data. Although there are many guardrails around Digital Trust which need to be put in place before we can adopt AI-generated outputs, Alexander’s talk suggested the possible advanced future of Artificial General Intelligence (AGI) which can learn, think, and output like humans with human-level intelligence.

Digital Trust is a crucial topic for the short-term future becoming a recurring theme in all areas from Sustainability to upcoming EU regulations on data, platforms and AI. Anticipated challenges and best practices were discussed during the interactive workshops with more than a hundred participants including C-level Management, Board members and Senior Management.

C-2023-2-Saski-f2-kleinC-2023-2-Saski-f3-klein

Workshop “Are you already in control of your ESG data?”

Together with KPMG speakers, the guest speaker Jurian Duijvestijn, Finance Director Sustainability of FrieslandCampina shared their exciting ESG journey in preparation of the Corporate Sustainability Reporting Directive (CSRD).

Sustainability reporting is moving from a scattered EU landscape to new mandatory European reporting standards. As shown in Figure 1, the European Sustainability Reporting Standards (ESRS) ) consists of twelve standards including ten topical standards for Environment, Social and Governance areas.

C-2023-2-Saski-1-klein

Figure 1. CSRD Standards. [Click on the image for a larger image]

CSRD requires companies to report on the impact of corporate activities on the environment and society, as well as the financial impact of sustainability matters on the company, consequently resulting in including an extensive amount of financial and non-financial metrics. The CSRD implementation will take place in phases, starting with the large companies already covered by the Non-Financial Reporting Directive and continuing with other large companies (FY25), SMEs (FY26) and non-EU parent companies (FY28). The required changes to the corporate reporting should be rapidly implemented to ensure a timely compliance, as the companies in scope of the first phase must already publish the reports in 2025 based on 2024 data. The integration of sustainability at all levels of the organization is essential for a smooth transition. As pointed out by the KPMG speakers, Vera Moll, Maurice op het Veld and Eelco Lambers, a sustainability framework should be incorporated in all critical business decisions, going beyond the corporate reporting and transforming business operations.

The interactive breakout activities confirmed that sustainability reporting adoption is a challenging task for many organizations due to the new KPIs, changes to calculation methodologies, low ESG data quality and tooling not fit for purpose. In line with the topic of the Compact celebration, the development of the required data flows depends on a trustworthy network of suppliers and development of strategic partnerships at the early stage of adoption.

C-2023-2-Saski-X-klein

CSRD is a reporting framework that could be used by companies to shape their strategy to become sustainable at all organizational and process levels. Most companies have already started to prepare for CSRD reporting, but anticipate a challenging project internally (data accessibility & quality) and externally (supply chains). While a lot of effort is required to ensure the timely readiness, the transition period also provides a unique opportunity to measure organizational performance from an ESG perspective and to transform in order to ensure that sustainability becomes an integral part of their brand story.

Workshop “Can your organization apply data analytics and AI safely and ethically?”

The quick rise of ChatGPT has sparked a major change. Every organization now needs to figure out how AI fits in, where it’s useful, and how to use it well. But using AI also brings up some major questions, for example in the field of AI ethics. Like, how much should you tell your customers if you used ChatGPT to help write a contract?

During the Responsible AI workshop, facilitators Marc van Meel and Frank van Praat, both from the KPMG’s Responsible AI unit, presented real-life examples that illustrate the challenges encountered when implementing AI. They introduced five important principles in which ethics dilemmas can surface: the Reliability, Resilience, Explainability, Accountability, and Fairness of AI systems (see Figure 2). Following the introduction of these principles and their subsequent elaborations, the workshop participants engaged in animated discussions, exploring a number of benefits and drawbacks associated with AI.

C-2023-2-Saski-2-klein

Figure 2. Unique challenges of AI. [Click on the image for a larger image]

To quantify those challenges of AI, there are three axis organizations can use: Complexity, Autonomy, and Impact (see Figure 3).

C-2023-2-Saski-3-klein

Figure 3. Three axis of quantifying AI risks. [Click on the image for a larger image]

Because ChatGPT was quite new when the workshop took place (and still is today), it was top of mind for everyone in the session. One issue that received substantial attention was how ChatGPT might affect privacy and company-sensitive information. It’s like being caught between two sides: on the one hand, you want to use this powerful technology and give your staff the freedom to use it too. On the other hand, you have to adhere to privacy rules and make sure your important company data remains confidential.

The discussion concluded stressing the importance of the so-called “human in the loop”, meaning it’s crucial that employees understand the risks of AI systems such as ChatGPT when using it and that some level of human intervention should be mandatory. Actually, it automatically led to another dilemma to consider, namely how to find the right balance between humans and machines (e.g. AI). Basically, everyone agreed that it depends on the specific AI context on how humans and AI should work together. One thing was clear; the challenges with AI are not just about the technology itself. The rules (e.g. privacy laws) and practical aspects (what is the AI actually doing) also matter significantly when we talk about AI and ethics.

There are upsides as well as downsides when working with AI. How do you deal with privacy-related documents that are uploaded to a (public) cloud platform with a Large-Language Model? What if you create a PowerPoint presentation from ChatGPT and decided not to tell your recipient/audience? There are many ethical dilemmas, such as lack of transparency of AI tools, discrimination due to misuses of AI, or Generative AI-specific concerns, such as intellectual property infringements.

However, ethical dilemmas are not the sole considerations. As shown in Figure 4, practical and legal considerations can also give rise to dilemmas in various ways.

C-2023-2-Saski-4-klein

Figure 4. Dilemmas in AI: balancing efficiency, compliance, and ethics. [Click on the image for a larger image]

The KPMG experts and participants agreed that it would be impossible just to block the use of this type of technology, but that it would be better to prepare employees, for instance by providing privacy training and use critical thinking to use Generative AI in a responsible manner. The key is to consider what type of AI provides added value/benefit as well as the associated cost of control.

After addressing the dilemmas, the workshop leaders concluded with some final questions and thoughts about responsible AI. People were interested in the biggest risks tied to AI, which match the five principles that were talked about earlier (see Figure 3). But the key lesson from the workshop was a bit different – using AI indeed involves balancing achievements and challenges, but opportunities should have priority over risks.

Workshop “How to achieve Digital Trust in practice?”

This workshop was based on KPMG’s recent work with the World Economic Forum (WEF) on Digital Trust and was presented by Professor Lam Kwok Yan (Executive Director, National Centre for Research in Digital Trust of the Nanyang Technological University, Singapore), Caroline Louveaux (Chief Privacy Officer of Mastercard) and Augustinus Mohn (KPMG). The workshop provided the background and elements of Digital Trust, trust technologies, and digital trust in practice followed by group discussions.

C-2023-2-Saski-5-klein

Figure 5. Framework for Digital Trust ([WEF22]). [Click on the image for a larger image]

The WEF Digital Trust decision-making framework can boost trust in the digital economy by enabling decision-makers to apply so-called Trust Technologies in practice. Organizations are expected to consider security, reliability, accountability, oversight, and the ethical and responsible use of technology. A group of major private and public sector organizations around the WEF (incl. Mastercard) is planning to operationalize the framework in order to achieve Digital Trust (see also [Mohn23]).

Professor Lam introduced how Singapore has been working to advance the scientific research capabilities of Trust Technology. In Singapore, the government saw the importance of Digital Trust and funded $50 million for the Digital Trust Centre, the national center of research in trust technology. While digitalization of the economy is important, data protection comes as an immediate concern. Concerns on distrust are creating opportunities in developing Trust Technologies. Trust Technology is not only aiming to identify which technologies can be used to enhance people’s trust, but also to define concrete functionality implementable for areas shown in Figures 6 and 7 as presented during the workshop.

C-2023-2-Saski-6-klein

Figure 6. Areas of opportunity in Trust Technology (source: Professor Lam Kwok Yan). [Click on the image for a larger image]

C-2023-2-Saski-7-klein

Figure 7. Examples of types of Trust Technologies (source: Professor Lam Kwok Yan). [Click on the image for a larger image]

C-2023-2-Saski-f4-klein

Presentation by Professor Lam Kwok Yan (Nanyang Technological University), Helena Koning (Mastercard) and Augstinus Mohn (KPMG). [Click on the image for a larger image]

Helena Koning from Mastercard shared how Digital Trust is put in practice at Mastercard. One example was data analytics for fraud prevention. While designing this technology, Mastercard needed to consider several aspects in terms of Digital Trust. To accomplish designing AI-based technology, they made sure to apply a privacy guideline, performed “biased testing” for data accuracy, and addressed the auditability and transparency of AI tools. Another example was to help society with anonymized data while complying with data protection. When there were many refugees from Ukraine, Poland needed to analyze how many Ukrainians were currently in Warsaw. Mastercard supported this quest by anonymizing and analyzing the data. These could not have been achieved without suitable Trust Technologies.

In the discussion at the end of the workshop, further use cases for Trust Technology were discussed. Many of the participants had questions on how to utilize (personal) data while securing privacy. In many cases, technology cannot always solve such a problem entirely, therefore, policies and/or processes also need to be reviewed and addressed. For example, in the case of pandemic modeling for healthcare organizations, they enabled the modeling without using actual data to comply with privacy legislation. In another advertising case, cross-platform data analysis was enabled to satisfy customers, but the solution ensured that the data was not shared among competitors. The workshop also addressed that it is important to perform content labeling to detect original data and prevent fake information from spreading.

For organizations, it is important to build Digital Trust by identifying suitable technologies and ensuring good governance of the chosen technologies to realize their potential for themselves and society.

Workshop “How to anticipate upcoming EU Data regulations?”

KPMG specialists Manon van Rietschoten (IT Assurance & Advisory), Peter Kits (Tech Law) and Alette Horjus (Tech Law) discussed the upcoming data-related EU regulations. An interactive workshop explored the impact of upcoming EU Digital Single Market regulations on business processes, systems and controls.

The EU Data Strategy was introduced in 2020 to unlock the potential of data and establish a single European data-driven society. Using the principles of the Treaty on the Functioning of the European Union (TFEU), the Charter of Fundamental Rights of the EU (CFREU) and the General Data Protection Regulation (GDPR), the EU Data Strategy encompasses several key initiatives that collectively work towards achieving its overarching goals. Such initiatives include entering into partnerships, investing in infrastructure and education and increased regulatory oversight resulting in new EU laws and regulations pertaining to data. During the workshop, there was focus on the latter and the following regulations were highlighted:

  • The Data Act
  • The Data Governance Act
  • The ePrivacy Regulation
  • The Digital Market Act
  • The Digital Services Act and
  • The AI Act.

C-2023-2-Saski-8-klein

Figure 8. Formation of the EU Data Economy. [Click on the image for a larger image]

During the workshop participants also explored the innovative concept of EU data spaces. A data space, in the context of the EU Data Strategy, refers to a virtual environment or ecosystem that is designed to facilitate the sharing, exchange, and utilization of data within a specific industry such as healthcare, mobility, finance and agriculture. It is essentially a framework that brings together various stakeholders, including businesses, research institutions, governments, and other relevant entities, to collaborate and share data for mutual benefit while ensuring compliance with key regulations such as the GDPR.

The first EU Data Space – European Health Data Space (EHDS) – is expected to be operable in 2025. The impact of the introduction of the EU Data Spaces is significant and should not be underestimated – each Data Space has a separate regulation for sharing and using data.

C-2023-2-Saski-9-klein

Figure 9. European Data Spaces. [Click on the image for a larger image]

The changes required by organizations to ensure compliance with the new regulations pose a great challenge, but will create data-driven opportunities and stimulate data sharing. This workshop provided a platform for stakeholders to delve into the intricacies of newly introduced regulations and discuss the potential impact on data sharing, cross-sector collaboration, and innovation. There was ample discussion scrutinizing how the EU Data Strategy and the resulting regulations could and will reshape the data landscape, foster responsible AI, and bolster international data partnerships while safeguarding individual privacy and security.

Key questions posed by the workshop participants were the necessity of trust and the availability of technical standards in order to substantiate the requirements of the Data Act. In combination with the regulatory pressure, the anticipated challenges create a risk for companies to become compliant on paper (only). The discussions confirmed that trust is essential as security and privacy concerns were also voiced by the participants: “If data is out in the open, how does we inspire trust? Companies are already looking into ways not to have to share their data.”

In conclusion, the adoption of new digital EU Acts is an inevitable but interesting endeavor; however, companies should also focus on the opportunities. The new regulations require a change in vision, a strong partnership between organizations and a solid Risk & Control program.

In the next Compact edition, the workshop facilitators will dive deeper into the upcoming EU Acts.

Conclusion

The workshop sessions were followed by a panel discussion between the workshop leaders. The audience united in the view that the adoption of the latest developments in the area of Digital Trust require a significant effort from organizations. To embrace the opportunities, they need to keep an open mind while being proactive in mitigating the risks that may arise with technology advancements.

The successful event was concluded with a warm “thank you” to the three previous Editor-in-Chiefs of Compact who oversaw the magazine for half a century, highlighting how far Compact has come. Starting as an internal publication in the early seventies, Compact has become a leading magazine covering IT strategy, innovation, auditing, security/privacy/compliance and (digital) transformation topics with the ambition to continue for another fifty years.

C-2023-2-Saski-f5-klein

Maurice op het Veld (ESG), Marc van Meel (AI), Augustinus Mohn (Digital Trust) and Manon van Rietschoten (EU Data Acts). [Click on the image for a larger image]

C-2023-2-Saski-f6-klein

Editors-in-Chief (from left to right): Hans Donkers, Ronald Koorn and Dries Neisingh (Dick Steeman not included). [Click on the image for a larger image]

References

[Mohn23] Mohn, A. & Zielstra, A. (2023). A global framework for digital trust: KPMG and World Economic Forum team up to strengthen digital trust globally. Compact 2023(1). Retrieved from: https://www.compact.nl/en/articles/a-global-framework-for-digital-trust-kpmg-and-world-economic-forum-team-up-to-strengthen-digital-trust-globally/

[WEF22] World Economic Forum (2022). Earning Digital Trust: Decision-Making for Trustworthy Technologies. Retrieved from: https://www.weforum.org/reports/earning-digital-trust-decision-making-for-trustworthy-technologies/

How does new ESG regulation impact your control framework?

Clear and transparent disclosure on companies’ ESG commitments is continually becoming more important. Asset managers are increasing awareness for ESG and there is an opportunity to show how practices and policies are implemented that lead to a better environment and society. Furthermore, stakeholders (e.g., pension funds) are looking for accurate information in order to make meaningful decisions and to comply with relevant laws and regulations themselves. Reporting on ESG is no longer voluntary, as new and upcoming laws and regulation demand that asset managers report more extensively and more in dept on ESG. As a result of our KPMG yearly benchmark on Service Organization Control (hereinafter: “SOC”) Reports of asset managers, we are surprised that, given the growing interests and importance of ESG, only 7 out of 12 Dutch asset managers report on ESG, and still on a limited scope and scale.

Introduction

Before we get into the benchmark we will give you some background on the upcoming ESG reporting requirements for the asset management sector. These reporting requirements are mainly related to the financial statement. However, we are convinced that clear policies, procedures as well as a functioning ESG control framework are desirable to reach compliance with these new regulations. Therefore, we benchmark to what extent asset managers are (already) reporting on ESG as part of their annual SOC reports (i.e., ISAE 3402 or Standard 3402). We end with a conclusion and a future outlook.

Reporting on ESG

In this section we will provide you with an overview of the most important and relevant regulations on ESG for the asset management sector. Most of the ESG regulation is initiated by the European Parliament and Commission. We therefore start with the basis, the EU taxonomy, which we disclose high-over followed by more in detail regulations like Sustainable Finance Disclosure Regulations (hereinafter: “SFDR”) and Corporate Sustainability Reporting Directive (hereinafter: “CSRD”).

EU Taxonomy

In order to meet the overall EU’s climate and energy targets and objectives of the European Green deal in 2030, there is an increasing need for a common language within the EU countries and a clear definition of “sustainable” ([EC23]). The European Commission has recognized this need and has taken a significant step by introducing the EU taxonomy. This classification system, operational since July 12th, 2022, is designed to address six environmental objectives and plays a crucial role in advancing the EU’s sustainability agenda:

  1. Climate change mitigation
  2. Climate change adaptation
  3. The sustainable use and protection of water and marine resources
  4. The transition to a circular economy
  5. Pollution prevention and control
  6. The protection and restoration of biodiversity and ecosystems

The EU taxonomy is a tool that helps companies disclose their sustainable economic activities and helps (potential) investors understand whether the companies’ economic activities are environmentally and socially governed sustainable or not.

According to EU regulations, companies with over 500 employees during the financial year and operating within the EU are required to file an annual report on their compliance with all six environmental objectives on 1 January of each year, starting from 1 January 2023. The EU ESG taxonomy report serves as a tool for companies to demonstrate their commitment to sustainable practices and to provide transparency on their environmental and social impacts. The annual filing deadline is intended to ensure that companies are regularly assessing and updating their sustainable practices in order to meet the criteria outlined in the EU’s ESG taxonomy. Failure to file the report in a timely manner may result in penalties and non-compliance with EU regulations. It is important for companies to stay informed and up-to-date on the EU’s ESG taxonomy requirements to ensure compliance and maintain a commitment to sustainability.

SFDR

The SFDR was introduced by the European Commission alongside the EU Taxonomy and requires asset managers to disclose how sustainability risks are assessed as part of the investment process. The EU’s SFDR regulatory technical standards (RTS) came into effect on 1 January 2023. These standards aim to promote transparency and accountability in sustainable finance by requiring companies to disclose information on the sustainability risks and opportunities associated with their products and services. The SFDR RTS also establish criteria for determining which products and services can be considered as sustainable investments.

There are several key dates that companies operating within the EU need to be aware of in relation to the SFDR RTS. Firstly, the RTS is officially applied as of 1 January 2023. Secondly, companies are required to disclose information on their products and services in accordance with the RTS as of 30 June 2023. Lastly, companies will be required to disclose information on their products and services in accordance with the RTS in their annual financial reports as of 30 June 2024.

It is important for companies to take note of these dates as compliance with the SFDR RTS and adhering to the specified deadlines is crucial for companies. Failure to do so may again result in penalties and non-compliance with EU regulations. Companies should also stay informed and keep up with the SFDR RTS requirements to ensure that they are providing accurate and relevant information to investors and other stakeholders on the sustainability of their products and services as these companies are required to disclose part of this information as well.

CSRD

The CSRD is active as of 5 January 2023. This new directive strengthens the rules and guidelines regarding the social and environmental information that companies have to disclose. In time, these rules will ensure that stakeholders and (potential) investors have access to validated (complete and accurate) ESG information in the entire chain (see Figure 1). In addition, the new rules will also positively influence the company’s environmental activities and drive competitive advantage.

C-2023-2-Rietschoten-1-klein

Figure 1. Data flow aggregation. [Click on the image for a larger image]

Most of the EU’s largest (listed) companies have to apply these new CSRD rules in FY2024, for the reports published in 2025. The CSRD will make it mandatory for companies to have their non-financial (sustainable) information audited. The European Commission has proposed to first start with limited assurance upon the CSRD requirements in 2024. This represents a significant advantage for companies as limited assurance is less time consuming and costly and will give great insights in the current maturity levels. In addition, the Type I assurance report (i.e., design and implementation of controls) can be used as a guideline to improve and extend the current measures to finally comply with the CSRD rules. We expect that the European Commission will demand a reasonable assurance report as of 2026. Currently, the European Commission is assessing which Audit standard will be used as the reporting guideline.

Specific requirement for the asset management sector

In 2023 the European Sustainability Reporting Standards (ESRS) will be published in draft by the European Financial Reporting Advisory Group (hereinafter: “EFRAG”) Project Task Force for the sectors Coal and Mining, Oil and Gas, Listed Small Medium Enterprises, Agriculture, Farming and Fishing, and Road Transport ([KPMG23]). The classification of the different sectors is based on the European Classification of Economic Activities. The sector-specific standards for financial institutions, which will be applicable for asset managers, are expected to be released in 2024, although the European Central Bank and the European Banking Authority both argue that the specific standards for financial institutions is a matter of top priority due to the driving force of the sector regarding the transition of the other sectors to a sustainable economy ([ICAE23]). We therefore propose that financial institutions start analyzing the mandatory and voluntary CSRD reporting requirements and determine – based on a gap-analysis – which information they already have versus what is missing and start working on that. 

Reporting on internal controls

European ESG regulation focusses on ESG information in external reporting. However, no formal requirements are set (yet) regarding the ESG information and data processes itself. In order to achieve high-quality external reporting, control over internal processes is required. Furthermore, asset managers are also responsible for the processes performed by third parties, e.g., the data input received from third parties. It is therefore important for an asset manager to gain insight in the level of maturity of the controls on these processes as well.

Controls should cover the main risk of an asset manager that can be categorized a follows:

  • Inaccurate data
  • Incomplete data
  • Fraud (greenwashing)
  • Subjective/inaccurate information
  • Different/unaligned definitions for KPIs

In order to comply with the regulations outlined in Figure 1, it is recommended to include the full scope of ESG processes in the current SOC reports of asset managers. Originally, the SOC report is designed for providing assurance on processes related to financial reporting over historical data. In our current society, we observe that more and more attention is paid to non-financial processes. We see that the users of the SOC reports are also requesting and requiring assurance over more and more non-financial reporting processes. We observe that some asset managers are including processes such as Compliance (more relevant for ISAE3000A), Complaints and ESG in their SOC reports. KPMG performed a benchmark on which processes are currently included in the SOC reports of asset managers. We will discuss the results in the next paragraph.

Benchmark

By comparing 12 asset management SOC reports for 2022, KPMG observed that 6 out of 12 asset managers are including ESG in their system descriptions (description of the organization), and 7 out of 12 asset managers have implemented some ESG controls in the following processes:

  • Trade restrictions (7 out of 12 asset managers)
  • Voting policy (4 out of 12 asset managers)
  • Explicit control on external managers (4 out of 12 asset managers)
  • Emission goals / ESG scores (1 out of 12 asset managers)
  • Outsourcing (0 out of 12 asset managers)

We observe that reporting is currently mostly related to governance components. There is little to no reporting on environmental and social components. In addition, we observe that none of the twelve asset managers report on or mention third party ESG data in their SOC reports.

We conclude that ESG information is not (yet) structurally included in the assurance reports. This does not mean that ESG processes are not controlled; companies can have internal controls in place that are not part of a SOC report. In our discussion with users of the assurance reports (e.g. pension funds) we get feedback that external reporting on ESG related controls is perceived as valuable given the importance of sustainable investing and upcoming (EU) regulations. Based on our combined insight from both ESG Assurance and advisory perspective we will share our vision on how to report on ESG in the next paragraph.

Conclusion and future outlook

In this article we conclude that only 7 out of 12 asset managers are currently reporting on ESG-related controls in their SOC reports, and still on a limited scope and scale. This is not in line with the risks and opportunities associated with ESG data and not in line with active and upcoming laws and regulations. We therefore recommend that asset managers enhance control on ESG by:

  • implementing ESG controls as part of internal control framework (internal reporting);
  • implementing ESG controls as part of their SOC framework (external reporting);
  • assessing and analyzing with your external (data) service providers and relevant third parties regarding missing controls on ESG.

The design of a proper ESG control framework first starts with a risk assessment and the identification of opportunities. Secondly, policies, procedures and controls should be put in place to cover the identified material risks. These risks need to be mitigated in the entire chain, which means that transparency within the chain and frequent contact among the stakeholders is required. The COSO model (commonly used within the financial sector) could be used as a starting point for a first risk assessment, where we identify inaccurate data, incomplete data, fraud, inaccurate information and unaligned definition of KPIs as key risks. Lastly, the risks and controls should be incorporated within the organizational annual risk cycle, to ensure quality, relevancy, and completeness. Please refer to Figure 2 as an example.

C-2023-2-Rietschoten-2-klein

Figure 2. Example: top risks x COSO x stakeholder data chain [Click on the image for a larger image]

References

[EC23] European Commission (2023, January 23). EU taxonomy for sustainable activities. Retrieved from: https://finance.ec.europa.eu/sustainable-finance/tools-and-standards/eu-taxonomy-sustainable-activities_en

[ICAE23] [ICAE23] ICAEW Insights (2023, May 3). ECB urges priority introduction of ESRS for financial sector. Retrieved from: https://www.icaew.com/insights/viewpoints-on-the-news/2023/mar-2023/ecb-urges-priority-introduction-of-esrs-for-financial-sector

[KPMG23] KPMG (2023, April). Get ready for the Corporate Sustainability Reporting Directive. Retrieved from: https://assets.kpmg.com/content/dam/kpmg/nl/pdf/2023/services/faq-csrd-2023.pdf

Beyond transparency: harnessing algorithm registries for effective algorithm governance

The Dutch government’s creation of a registry for all their algorithms is a positive first step towards increasing public control. But the future will decide whether this is good enough, and if organizations need to take further steps beyond transparency to manage algorithm risks.

We argue that an algorithm registry can also provide a foundation for managing algorithms risks internally. On top of public transparency, there are more functions that organizations should consider when implementing an algorithm registry. Collaboration and knowledge management, risk assessments and general governance are as well functionalities that help organizations to gain more (internal) control over their algorithms. It’s up to each organization to determine the best approach for them. But it goes without saying that with the right measures in place, algorithm registries help to increase public trust in algorithms and internally assure that they are used ethically and responsibly.

Introduction

On February 15th 2023, Dutch State Secretary for Digitalization Van Huffelen made a bold commitment with potentially far-reaching implications. During a debate about the usage of algorithms and data ethics within the Dutch government, she promised that by the end of 2023, information on all government algorithms would be publicly available in the recently launched algorithm registry of the Dutch government ([Over]). This ambitious promise poses a significant challenge. The broad and complex nature of algorithms and their widespread use makes it difficult to obtain a complete overview of all algorithms used in the public sector. In fact, we observe that many organizations – also in the private sector – struggle to create and maintain an inventory of their own algorithms to start with.

There is an increasing demand from society and in the parliament ([Klav21], [Dass22]) for greater control over algorithms. In this light Van Huffelen’s ambition is logical. However, it is open to debate whether the added transparency provided by the Dutch registry will actually effectively mitigate the risks inherent in the usage of algorithms by the public sector. We believe that a public algorithm registry is not enough to enable public oversight or to minimize the potential devastating impact of algorithms and AI. We merely believe that a complete and comprehensive overview of algorithms could be a great start for end-to-end algorithm governance. In this article, we argue that a registry’s true value lies in its use as a tool for governance and risk management.

Transparency, public oversight and internal control

The Algorithm registry of the Dutch Government ([Over]) was presented in December 2022. It was explicitly presented as a first step and it contains information on over a hundred algorithms from twelve different governmental organizations such as municipalities, provinces and agencies. Registration of all algorithms used in the public sector in this registry will become mandatory in the following years. In a letter to the parliament, Van Huffelen explains that citizens should be able to trust that algorithms adhere to public values, law and standards and that their effects can be explained. The registry gives citizens, interest groups, and the media access to general information about the algorithms used by the central government. The presented information in the registry empowers its readers to analyze the algorithms and pose relevant questions. However, transparency alone is only a small contribution towards the goals as stated by Van Huffelen.

General transparency versus individual explainability

From the viewpoint of an individual citizen or customer, the value of an algorithm registry which provides general transparency is questionable. For them, explainability, which answers questions like “Why is my request denied?” or “Why do I have to provide more detailed information?” is more important. It is imperative for organizations to provide individuals with clear and concise information about decisions that impact them, whether they engage with an algorithmic system or a human one. In doing so, individuals can better understand how the system operates and any potential implications. On top of that, it is also crucial that the algorithm can provide meaningful feedback about how its output was derived. This feedback can be critical to ensuring that individuals – citizens and customers, but also users in the organization – have a comprehensive understanding of the decision-making process and can assess the fairness and accuracy of the decision that has been made. Individual citizens benefit more from information that is proactively shared and pertains to them, rather than general information that can only be found through search efforts on one of the thousands of government websites ([AmAL23]) or hidden in a corner of the customer care pages.

The true value of transparency lies in the actions taken by stakeholders in response to the information they receive. For instance, citizens can obtain information about specific algorithms by contacting the relevant public sector organization, and (special) interest groups can challenge the way in which algorithms are deployed, or how specific data is used. Although the registry facilitates these actions, the current set up relies on action and effective challenging by third parties in the prevention of algorithmic risks and errors in the public sector. Relying solely on public scrutiny as a means of ensuring algorithmic accountability is a cumbersome and time-consuming process that demands a lot of effort from external stakeholders. Organizations must also take proactive measures to ensure that their use of algorithms is aligned with ethical and legal considerations.

To proactively manage the risks associated with use of algorithms in (governmental) organizations, it is crucial that organizations are internally in control over these systems themselves. With the introduction of legislation such as the AI Act this is not only the responsible thing to do, but also required by law. This involves obtaining an overview of the algorithms that are being used, to conduct a thorough risk analysis of each one in order to identify potential issues and prevent irreversible mistakes. In order to create and maintain this overview, a comprehensive registry would be a fitting tool. So, rather than being a transparency tool, the registry should be used by organizations as a means of assessing and managing risks. By also utilizing the registry for internal control purposes, organizations are forced to keep it up to date. The registry serves as an internal control system, allowing organizations to remain in control of the deployment and risk management of their algorithms. While some form of oversight is required, it need not necessarily be public in nature. For example, a designated internal or external supervisor can approach their supervision in a structured risk-based way and monitor the system of internal control for each organization individually. The Dutch Data Protection Authority (Autoriteit Persoonsgegevens) started coordinating these efforts ([AP22]). In the case of general public supervision, it may be expected that certain high-risk algorithms or organizations may skip public oversight entirely because an overall structural approach to enforce compliance is missing.

Functional choices for algorithm registries

In the previous section, the algorithm registry as a means to establish internal control was introduced. However, internal control (more comprehensively stated: governance) is a broad concept and can manifest in different ways depending on the type and risk appetite of organizations. It is important to note that solely having a registry is inadequate for governance purposes and that supplementary measures are often necessary. Generally, the following core functionalities can be distinguished for a registry:

Core function 1: Public transparency

Public transparency encompasses two main themes: 1) the provision of transparency and 2) accountability reporting. The former involves providing information on the algorithms being used, how they are being used, and how they impact citizens, businesses, or organizations. Aside from oversight, this also supports demystification1. Examples of algorithms in practice might help to give a more realistic image of the risks and issues that are already at stake which require genuine public debate. The latter involves being able to report to stakeholders on the ethical choices made, the technology involved, and the extent to which standards and regulations are being met.

For public control and trust, information on the use of an algorithm should not only describe what the algorithm does in factual terms, but also provide insight into its impact on citizens. It should answer the question, “How does this algorithm affect my life or that of my target audience?”. Research shows that citizens primarily prefer information on privacy, human control over the algorithm, and the reasons for using the algorithm ([Ding21]). Organizations need to avoid technical or organization-specific jargon, such as acronyms or process names, and instead strive to use language that is accessible to a broad audience. The disclosure of such information is relatively general, and the reader needs to interpret whether this information applies to their specific situation. As such, a registry alone is insufficient to provide satisfactory answers to individual questions. In situations where citizens expect or require information about the impact of algorithms on decisions affecting their lives, explainability becomes a critical factor.

Core function 2: Collaboration and knowledge management

An algorithm registry is able to serve as a valuable resource to enhance knowledge and expertise in the use of algorithms in organizations. By allowing searches for specific information about the inner workings and technologies of algorithms, a registry can provide a knowledge repository for developers to share new techniques and foster innovation. Furthermore, promoting knowledge-sharing can accelerate the adoption of algorithms within organizations in general.

The information that fulfills this core function is more substantive, comprehensive and detailed than the information that is provided for transparency and accountability purposes. The audience for this function typically consists of data engineers, -analysts and -scientists who are more likely to possess a greater level of familiarity with technical language. As such, the avoidance of jargon is less critical in this core function. The additional information that is added to the registry aimed specifically at knowledge-sharing and collaboration is not required to be included in the part of the registry that is available to the general public.

For this function, it is important that the registry is easily searchable for example on the grounds of an organization-specific taxonomy, and that a comprehensive overview of all algorithms in a specific category can be easily obtained.

Core function 3: Integrated risk assessment

Core function 3 of an algorithm registry is to provide organizations with a comprehensive view of the risks associated with algorithm use. By facilitating risk assessments and identifying measures to mitigate the risks, a registry can help organizations to better understand the potential risks and to take proactive steps to mitigate them.

To fully realize the benefits of this function, organizations must develop a methodology for classifying the algorithms used in their operations based on their risk levels. This could involve a system of classification such as low, medium, or high risk or based on factors such as the level of complexity, autonomy and impact of a particular algorithm. Depending on the classification, specific measures to mitigate risks may be required or recommended. The algorithm registry can support the risk identification and mitigation process by maintaining a standard risk and control measure catalog that connects directly to associated risk levels.

In order to effectively implement the integral risk assessment function of the algorithm registry, organizations must have access to up-to-date information about the algorithms in use, as well as the ability to monitor their use and assess their impact on decision-making. The registry must be regularly updated and maintained to enable organizations to assess the combined risks posed by multiple algorithms. In some cases, the use of multiple algorithms may increase the overall level of risk associated with a particular decision. The registry can play a pivotal role in enabling organizations to take a holistic view of their algorithm use and to identify and manage any potential risks that may arise.

Banks already have experience with this for their quantitative financial models. They use a model inventory that serves as a central registry to support so-called Model Risk Management (MRM). With MRM, banks keep an eye on the risks of models, track possible shortcomings and specific dependencies, and ensure that internal reviews (validations) are carried out ([KPMG19]).

Core function 4: Algorithm governance

Algorithm governance refers to the policies, procedures, and controls (core function 3) that an organization puts in place to manage the lifecycle of its algorithms. As algorithms become increasingly prevalent and critical to the functioning of organizations, there is a growing need for effective governance to ensure that they are developed, implemented, and used in a trustworthy manner.

This core function plays a crucial role in algorithm governance by establishing ownership, responsibility, and accountability for algorithms. By doing so, an organization can ensure that there is a clear understanding of who is responsible for the development, implementation, and use of each algorithm. This information can be used to make informed decisions about which algorithms to develop, how to deploy them, and how to monitor their performance.

In addition to providing insight into an organization’s portfolio of algorithms and their ownership, the core function also facilitates active management of algorithm performance and added value. By continuously monitoring an algorithm’s performance, an organization can identify potential issues and take corrective action before they become serious problems. This can help to improve the effectiveness and efficiency of algorithms, as well as enhance their overall value to the organization.

This can also support compliance, similar to how a record of processing activities – “verwerkingsregister” in Dutch – is used. The GDPR mandates organizations to maintain a comprehensive record of all processing activities under its responsibility. This register allows a full overview of what data is processed, for what purpose. The registry is a tool that supports compliance and a tool through which compliance with key aspects of the GDPR can be demonstrated.

Scoping the registry: decisions on width and depth

In scoping for algorithm registries, there are two aspects to consider, namely “width” and “depth”. Width refers to the range of algorithms that are included in the registry (scope), while depth refers to the level of detail captured for each algorithm.

Width

Deciding which algorithms to include in a registry is challenging, given the broadness and variance of definitions of algorithms and AI. A socio-technical approach to algorithms, where the interplay between the technology behind algorithms (complexity), the processes in which they operate and their impact on society (impact), and the level of human oversight (autonomy) is of crucial importance, instead of the code of the algorithm.

  • Impact. The impact of an algorithm on individuals or groups is measured based on the extent to which it influences various outcomes. This impact can be minimal, such as when the algorithm only affects internal financial reporting. However, the impact can be more significant when for example the results of the algorithm are used as input for policy development. The impact is highest when an algorithm is used in processes with a direct impact on the rights and obligations or decisions about citizens or businesses, or when the results of an algorithm have a significant impact on physical safety.
  • Autonomy. The degree of meaningful human control and supervision over the algorithm. Non-autonomous algorithms are controlled by humans, and the results are valued by humans. In the case of autonomous algorithms, there are automatic results and consequences without an effective ‘human in the loop’ making decisions.
  • Complexity. The complexity of the technology used. The simplest algorithms are rule-based algorithms that are a direct translation of existing regulations or policies. More advanced algorithms are based on machine learning or a complex composition of other algorithms.

In this perspective, it is worth noting that not all algorithms need to be registered. Organizations may choose additional criteria based on the above dimensions to limit the scope of their algorithm registry regarding their specific needs and goals. For example, the EU’s AI Act only requires high-risk AI systems to be included in the proposed European database. Through a scoping exercise, organizations can define which algorithms should be included in the registry and what level of control is applicable. The next step is to determine what exactly is registered at what point during an algorithm (development) lifecycle, which we refer to as the depth of the system.

Depth

Next to the width decision to be made, the depth of the information per algorithm is as important to detail out. Three important factors are to be considered.

Firstly, the desired depth of information is closely related to the purpose of the registry and the recipient of the information. For example, if the registry is only aimed at providing public transparency, it probably does not contain the right information to be able to check the substantive functioning of an algorithm. Conversely, information aimed at risk management is likely to be incomprehensible to the average citizen, who is not familiar with the technology and jargon used. For knowledge sharing or (internal) validation of algorithms, it can go a step further. For example, if a data scientist wants to delve into a specific technology for peer review, the algorithm developer will have to provide all desired information via the registry.

Secondly, the quality of information is also crucial. While a comprehensive description of the algorithm may include many technical details, if the quality of that information is poor or lacking in substance, it may not provide meaningful insights into the algorithm’s performance or effectiveness. For instance, the algorithm registry of the Dutch government regularly lacks in-depth and insightful information on specific algorithmic applications. For example, under the “proportionality” section of a license plate recognition algorithm, the only information provided is “No, this is an addition to manual enforcement.” Such a description fails to provide any insights into how the algorithm’s proportionality was determined.

Finally, practical considerations related to the feasibility and resources required for data collection and preparation should also be taken into account when determining the level of detail for an algorithm registry. To fill the algorithm registry with meaningful information, input is needed from various experts, and the content must be aligned with various parties. It can be expected that it will take several days per algorithm to collect and enrich the information about an algorithm. In addition, the timing of inputting information into the registry should also be considered. For impactful use cases, it may be useful to keep the information in the registry up to date tracking the process of development, while in other cases, registration afterwards may be sufficient.

Transparency alone is not enough to enable public oversight on algorithms

A registry of algorithms solely for the purpose of public control would be a missed opportunity. We argue that it is essential that responsible use of algorithms not only becomes a public responsibility but is also anchored internally in algorithm governance within organizations. An algorithm registry can be a powerful tool to assist in achieving this goal, when designed as such.

The Algorithm registry of the Dutch Government is a great start to inventory the use of algorithms in the Dutch governments. However, in its current form it is not enough to serve the Dutch government’s ambitions. To truly build a registry that adds value, the government should decide what core (internal) functionalities the registry should have. Chosen functionalities in turn direct choices on which algorithms should be included in the registry (the width) and what information should be included (the depth). Explicit design choices guided by clear goals, ensure that the algorithm registry is not a mandatory one-off exercise, but a valuable tool for ongoing governance.

Notes

  1. Demystification is one of the five keys tasks when embedding AI in society according to [Shei21].

References

[AmAL23] De Avondshow met Arjen Lubach (2023, January 31). Waarom heeft de overheid zoveel websites | De Avondshow met Arjen Lubach (S3) [Video]. YouTube. Retrieved from: https://www.youtube.com/watch?v=CRmSlxj1mLM

[AP22] Autoriteit Persoonsgegevens (2022). Contouren Algoritmetoezicht AP Naar Tweede Kamer. Retrieved from https://autoriteitpersoonsgegevens.nl/nl/nieuws/contouren-algoritmetoezicht-ap-naar-tweede-kamer

[Dass22] Dassen (2022, October 28). Kamerstuk 35 925 VII, nr. 26 [Motie]. Retrieved from: https://zoek.officielebekendmakingen.nl/kst-35925-VII-26.html

[Ding21] Dingemans, E., Bijster, F., Smulders, M., & Van Dalen, B. (2021). Informatiebehoeften van burgers over de inzet van algoritmes door overheden. Het PON & Telos.

[Klav21] Klaver (2021, January 19). Kamerstuk 35 510, nr. 16 [Motie]. Retrieved from: https://zoek.officielebekendmakingen.nl/kst-35510-16.html

[KPMG19] KPMG (2019). Model Risk Management toolkit. KPMG Netherlands.

[Over] Overheid.nl (n.d.) Het Algoritmeregister van de Nederlandse overheid. Retrieved February 15, 2023, from: https://algoritmes.overheid.nl

[Shei21] Sheikh, H., Prins, C., & Schrijvers, E. (2021). Mission AI: The New System Technology. WRR.

Thorough model validation helps create public trust

Performing risk analyses or detection by using algorithms may seem like a complex process, but this complexity has its origins in human decision-making. To prevent risks and negative consequences, such as unjustified bias, an independent review must be conducted. This guarantees quality and compliance with legal and ethical frameworks. KPMG has developed a method for performing independent model validations, based on a uniform assessment framework that distinguishes between four different aspects. Model validation also includes the performance of technical tests. The work to be performed and the technical tests as part of the assessment framework result in observations, findings and recommendations that the model validator reports to the organization.

Introduction

The analysis of risk by using algorithms in risk models continues to receive public attention. In terms of content, there does not seem to be agreement. Opinions differ on the very definition of a risk model, as well as on when algorithms should be used and what constitutes automated decision-making.

The problems associated with the use of risk models are regularly in the news, such as the Fraud Risk System (FSV) used by the Dutch Tax and Customs Administration. Algorithms are often referred to as “black boxes”, because it is not visible why a risk model has a certain outcome. This perception logically fuels further discussion and distrust of algorithm use.

Court decisions regularly judge that risk models are not readily comprehensible. In a case concerning the System Risk Indication (SyRI), a legal instrument for combating fraud, the court ruled that the SyRI objectives are disproportionate to the additional breach of privacy. Moreover, according to the court, such a model is not sufficiently transparent ([Judi20]). Risk models and algorithms seem to be so complex that it is difficult to follow their internal logic.

Complex matter

But where does it go wrong? It is not the algorithm or the risk model that is “wrong” per se. Human decision-making, such as selecting input data or analyzing generated signals, can also cause problems. If a risk model is elusive or complex, this is often caused by its design and set-up – i.e., by people.

Input data are data provided as input to a model. The model will generate an outcome based on these data. To teach or “train” the model, existing input data are used, where possible including the outcome: the training data. Finally, some of the pre-existing data are also kept separate to test the effectiveness of the model with different data than those used to train the model.

Developing, managing and implementing a risk model within technical, legal and ethical frameworks is a process that does not happen overnight. Recognition of the complexity of this process is key, as is identifying where that complexity stems from. This is an important step in determining how to handle a risk model. It is therefore understandable that applying and verifying risk models and algorithms is a challenge.

Taken from practice

Several examples can be found where the application of risk models goes wrong. Let’s look at a few of them.

In the FSV example cited earlier, the Tax and Customs Administration used data on the dual nationality of Dutch citizens as an indicator in the system that automatically labeled certain applications for childcare benefits as high-risk. Both KPMG and the Dutch Data Protection Authority found after an investigation that the Tax and Customs Administration wrongfully retained these sensitive data for years and made unlawful use of a “black list” ([KPMG20], [DDPA20], [DDPA21]).

A second example concerns the municipality of Rotterdam, which uses an algorithm to assign individuals a risk score to predict welfare fraud. In December 2021, the Rotterdam Court of Audit cautioned that input factors such as gender and residential area were possibly used to determine this risk. This could make the risk model unethical. In response to the Court of Audit’s investigation, SP (Socialist Party) member Renske Leijten submitted parliamentary questions about the use of algorithms by local governments. Minister of the Interior and Kingdom Relations Hanke Bruins Slot decided not to commission an investigation at the central level, partly in view of the fact that the responsibility for investigations lies with the municipalities themselves, not with the national government ([Team22]). The algorithm register published by the municipality of Rotterdam still refers to the risk assessment model used with regard to benefit irregularities, stating that the algorithm does not process data that could lead to discrimination ([Muni22]).

In addition to examples from the Netherlands, there are international examples. International government agencies and judicial institutions also use risk models. The US First Step Act was introduced in 2018 under the Trump administration. The purpose of this act was to shorten unnecessarily long sentences. Based on the PATTERN risk model, prisoners are given the opportunity to win early release if they have a low probability of relapsing into criminal behavior. Civil rights groups were quick to express concerns about possible disproportions based on race. The algorithm was said to assess the likelihood of recidivism significantly higher if someone had an African-American, Hispanic, or Asian background ([FBP22]). Involving a person’s criminal history as a risk factor may be problematic because ethnic profiling is a well-known issue in the US. The additional inclusion of education as a risk factor may have an indirect reinforcing effect. The risk model is still used and can be found on the Federal Bureau of Prisons site ([John22]).

The above examples illustrate the risks and undesirable consequences associated with the use of questionable algorithms in risk models. The examples also show the need for independent validation of such risk models to enforce due diligence in the use of algorithms and predictive models.

Pooling knowledge

Input of sufficient substantive knowledge is a requirement to properly apply and validate risk models and algorithms. This knowledge has a number of aspects:

  • Domain knowledge about the scope is required to determine whether the risk model’s objective is feasible and how this objective can be achieved. In addition, domain knowledge is required to determine the necessary data, hypotheses and prerequisites, and ultimately to verify that the results of the model are correct.
  • Technical knowledge is needed to determine the most appropriate type of algorithm for the risk model, to develop an algorithm for a risk model, to analyze the often large quantities of data, and for final programming.
  • Legal knowledge is needed for the legal frameworks that directly apply to the model and its use, as well as for the legal frameworks and guidelines in the area of data privacy and human rights. By extension, knowledge about the ethical frameworks is relevant with respect to the prevention of possible discrimination or bias.

The pooling of all this knowledge in the development and management of a model or algorithm is critical in determining whether a model can be applied.

Bias in risk models

Bias and the prevention of discrimination is a hotly debated topic in the application of risk models and algorithms. Bias is a distortion of research results, a preconception that can get in the way of an objective observation or assessment. Another concept that is often included is prejudice, where a judgment is made without having examined all the facts. Society is justifiably critical of this subject. An important point to take into account in the public debate and during the development of models is that bias is always part of a risk model or algorithm to some extent. The reason is that bias does not always have to be direct; it can also be indirect. Indirect bias means that a characteristic that itself does not contain direct bias is related to a characteristic that does contain bias. For example, the length of a resume is related to a person’s age, and the zip code of a person’s home address may be related to their level of education, ethnicity or age. For almost every characteristic there is a related characteristic where there is bias. This does not mean, however, that risk models are by definition discriminatory, but it does mean that consideration must be given to possible bias and the ethics involved in applying the model and the effect of bias. This already starts in the step of determining which criteria will or will not be included in a risk model. It is important to recognize and record this direct and indirect bias during the development of a risk model so that the influence and use of this information in an algorithm can be intentionally accepted or mitigated.

Reviewing risk models

To ensure that the right knowledge is used in the development of a risk model and that bias is adequately taken into account, it is important to establish effective frameworks within which to act. Establishing the frameworks of a risk model or algorithm is an important step in assessing whether a model or algorithm can be applied and will still be appropriate later on. For this assessment, it is useful to look at the risk model from a fresh perspective. An independent review of a risk model or algorithm to support the judgment is an effective tool to make a solid decision to start using a risk model.

Review frameworks

The frameworks to be reviewed may include hard requirements, such as “Has a Data Privacy Impact Assessment (DPIA) been performed?” or “Have all personal data used been documented?”, but also less rigid requirements, such as “Is the type of algorithm chosen appropriate for our specific purpose?”. Reviewing these frameworks requires the professional judgment of an auditor or validator. This makes an independent review – also called quality control or model validation – complex but at least as important as the risk model development process. Therefore, it is important that an auditor or validator has knowledge of and experience with the development and verification of models and algorithms, the scope and the legal and ethical frameworks.

Frameworks for the application or verification of risk models or algorithms are also the subject of public debate. The following guidelines have emerged from this:

  • In 2021, the Ministry of the Interior and Kingdom Relations released the Impact Assessment for Human Rights in the Deployment of Algorithms (IAMA) ([MIKR21]). This considers the choice of applying algorithms and the responsible development and implementation.
  • The Court of Audit released an assessment framework ([CoAu21]) for quality control of algorithms in 2021 and applied it to nine algorithms used by government ([NCoA22]).
  • NIST is working on an AI Risk Management Framework, which will be published in late 2022, early 2023. A draft version is already available ([NIST22]).
  • NOREA has also published a set of principles for examining algorithms ([NORE21]).
  • The US offers guidelines from the Office of the Comptroller of the Currency (OCC) on Model Risk Management ([OCC21]), which have been applied to financial and compliance risk models for many years in the financial world.

These documents provide valuable information for establishing frameworks for the development of models and algorithms and their verification or validation.

Method for model validation

We believe that an independent review must be conducted to safeguard the quality and compliance with legal and ethical frameworks of a risk model and its intended use. Therefore, KPMG has developed a method for conducting independent model validations, based on existing frameworks and knowledge of and experience with performing model validations in different sectors.

A model validation should look at several aspects that together form the context of the risk model. The governance of a risk model provides insight into arranged roles and responsibilities. As part of governance, the objective of the risk model – in the larger context of an organization – should also be established, because a risk model should not be completely isolated. Based on this set-up, the concept of the risk model can be developed and embodied in a technical design. The conceptual model and the technical design must show whether the set-up is in accordance with the initial objective. The next step is to analyze whether not only the set-up but also the technical functioning of the risk model fits the objective formulated. It is possible, for example, that a risk model does have predictive value, but based on a different hypothesis than was intended. If the risk model functions as intended, the final component is the periodic evaluation of and accountability for the risk model. Here, too, it is important to recognize that a risk model must fit within its context and take into account changing circumstances such as new laws and regulations or changes in input data over time, so-called “data drift”.

Based on the above, we have set up an assessment framework that covers four aspects:

  1. Governance and design;
  2. Conceptual model and technical design;
  3. Functioning of the risk model;
  4. Evaluation and accountability.

A more detailed description of these aspects follows below. To make it concrete, examples of work to be performed are also included for the specific aspect.

Governance and design

In the “Governance and design” aspect, the development of a risk model is assessed against relevant legislation and regulations and other prevailing systems of standards. For example, it is examined whether the objective of the risk model has been clearly formulated and whether the work was performed within the relevant legal and ethical frameworks. This is the basis of the risk model. Also relevant is whether the risk model does not overshoot itself and whether the development of a risk model is appropriate to the objective it is intended to pursue. Have proportionality (the means used must be in proportion to the objective to be achieved) and subsidiarity (the means used must be the least onerous means of achieving the objective) been sufficiently weighed? In other words: can the purpose of the risk model also be effectively achieved through risk selection with fewer personal data or with less privacy-intrusive or alternative means? Also important is the design of the governance structure for the risk model. It must be clear who bears which responsibilities from which role at various levels within the organization – from project team to management. One question the model validator needs to answer is whether there is sufficient knowledge in the organization based on the defined roles and responsibilities, whereby the number of years of relevant experience or relevant education plays a role. This may lead to the conclusion that there is sufficient or too little expertise in the team using the risk model. It is also important to carry out a thorough risk analysis prior to development.

For this aspect, the model validator also looks at the DPIA. This is relevant to gain insight into evaluations in place within the organization based on identified and described legal guidelines and to prevent bias and discrimination. The considerations concerning the ethical frameworks and the risk analysis must have been documented during the development of a risk model.

An example of non-compliance with legal frameworks on DPIAs, from March 2022, is a dispute between the Internet Covert Operations Program (iCOP) operated by package delivery company USPS and the Electronic Privacy Information Center (EPIC). iCOP deployed facial recognition to identify potential threats while monitoring social media posts. The use of such facial recognition raises significant risks and ethical concerns, and in addition, EPIC said the program used would be illegal due to the lack of a DPIA ([Hawk22]).

Conceptual model and technical design

With respect to the aspect “Conceptual model and technical design”, the model validator performs activities to validate that the conceptual model and technical design are in line with the objective of the risk model and the associated frameworks as identified in the aspect “Governance and design”. In doing so, the model validator analyzes the availability and quality of the description of the conceptual model and technical design in documentation. The model validator tests the clarity and explainability of the description and underlying assumptions.

This aspect includes identifying a description and justification of the assumptions and choices underlying the technical design. There must be sufficient justification for the training data, algorithms and programming language chosen to develop the risk model.

A relevant component for this aspect is the use of variables with indirect bias. An example showing that the prevention of indirect bias is not always given sufficient attention relates to the success rate of applicants at e-commerce company Amazon. In 2015, machine learning specialists at Amazon discovered that the algorithm developed for selecting new candidates was biased. The algorithm observed patterns in resumes submitted over a ten-year period. Given the male dominance in the tech industry, the algorithm taught itself to favor resumes from men – based on history. If a resume contained words such as “women” or “captain of the women’s chess club”, the candidate was removed from the list of candidates ([Dast18], [Logi19]).

Functioning of the risk model

Activities under the review aspect “Functioning of the risk model” are focused on reviewing whether the functioning of the risk model matches the objective and the design of the risk model from the previous two aspects. Has the design been translated correctly into the technical implementation and does the risk model produce the results as intended?

The model validator analyzes as part of this aspect whether technical tests were performed in the development of a risk model to assess the functioning and output of the model. In doing so, the model validator must analyze which tests were performed and what the results were. In addition, the model validator checks whether tests have been performed to check the quality of the input data and whether there is proper version control. The model validator also performs independent technical tests (see the subsection below).

Also relevant to this aspect is a review of the description of the programmed risk model. Here, at least a number of points must be sufficiently explained, such as an overview of the input used, the functioning of the risk model, the algorithm applied, any uncertainties and limitations, and an explanation of why the risk model is suitable for its intended use.

A possible finding of the model validator regarding this aspect may relate to the quality of the data used. If the training data are of poor quality, this will probably mean that the quality of the generated results is also below par. An example of this is an algorithm used by the Dutch Railways (NS). A customer was unable to purchase a subscription because the zip code of applicants was used as input for their credit check. If, as in this case, it turned out that a former resident of the address was a defaulter, the customer received a negative credit score and the application was denied ([Voll22]).

Technical tests

Part of our methodology includes a technical test of the risk model. One of the technical tests we use to validate whether the technical implementation of the risk model matches the conceptual model and the technical design is a code review. This involves – partly automated and partly manual – reviewing the programmed code in detail and “re-performing” it to verify that it matches the design and generates the intended results.

In addition, stability tests can be performed. In this process, the model validator re-runs the programmed code of the risk model several times with the same and minimally adjusted input data to analyze their impact on the results. The input data can also be adjusted with extreme values to determine the impact of these extreme values on the risk model and whether they were handled properly. The purpose is to verify that the risk model is sufficiently stable.

Finally, performance tests can be conducted to determine whether the model is sufficiently effective in “predicting” the intended outcomes.

Evaluation and accountability

Under the aspect “Evaluation and accountability”, the model validator specifically tests that the model is used in accordance with the objective and guidelines. The model validator also tests the organization’s evaluation mechanism, including an analysis of how accountability is provided. This aspect is the culmination of the previous three aspects and looks back at the various elements described earlier.

Part of this aspect is a “layman’s test”: are the results of the risk model logical, viewed from the perspective of a relatively uninformed person? This concerns the comprehension of the logic of the risk model’s ourcomes for uninvolved people and acts as a mirror. The model validator analyzes whether the results generated are to be expected based on logical reasons, what possible explanations there may be for deviations, and whether the outcomes are explainable. It is a test with a helicopter view: is, all things considered, the risk model sufficiently understandable?

Within this aspect, the model validation simultaneously considers whether (in the documentation) any recommendations from performed tests and previous evaluations have been followed up and whether the use and future use of the risk model are described.

An existing risk model where safeguarding of the intended use can be questioned concerns the algorithms behind the determination of the credit scores of individuals at banks in the US. The impact of an overdue payment on the credit score is greater for customers with higher (generally “better”) credit scores than for those with lower credit scores. This effect is caused by the underlying algorithm: when someone has a higher score, this score is more sensitive to negative events, which means that the same event can have a different impact on different individuals ([Sing22]).

Can a risk model be used?

Our starting point for each model validation is a uniform assessment framework based on the above aspects. The assessment framework forms the basis for performing the model validation. It is important that the model validator maintain a professional-critical attitude.

The assessment framework provides the model validator with observations and findings to report to the organization. In doing so, the model validator may make recommendations, where necessary. The model validator’s report is a sound basis for determining whether a risk model can and may be put into use.

Conclusion

As is so often the case, it is all about the relationship between people and technology. Did the developer set up a suitable process to arrive at an appropriate risk model? Was thorough risk analysis, broader than just a DPIA, conducted prior to the development of the risk model? Does the technology match the design, by human beings, and does the risk model deliver the intended results? These and other important questions that arise during the process of developing a risk model, and the technical risk model itself, have been incorporated into an independent review.

Whether it is called an independent review, quality control or model validation – they all refer to the same activity. KPMG has developed this method for the systematical validation of risk models, from the creation process, the technique, to the outcomes. The method was developed on the basis of the IAMA, the assessment framework of the Dutch Court of Audit, the OCC Model Risk Management guideline and more than ten years of experience in performing model validations in various sectors. KPMG has been using this method for four years.

Unfortunately, as noted at the beginning of this article, risk models do not always function as intended. This damages public trust to such an extent that the benefit of using a risk model – increased effectiveness and efficiency – is quickly canceled out. This is despite the fact that the risk model should actually contribute to public trust, partly because it should be more objective than a completely manual assessment. However, the technology of a risk model or algorithm is also based on human decision-making; it is a good thing that thorough checks and balances are in place to achieve the most reliable joint performance of man and machine.

References

[Boer21] Boer, A., & Van Meel, M. (2021). Algoritmes en mensen moeten blijven leren. KPMG. Retrieved from: https://home.kpmg/nl/nl/home/insights/2021/06/algoritmes-en-mensen-moeten-blijven-leren.html

[CoAu21] Court of Audit (2021, 26 January). Aandacht voor algoritmes. Retrieved from: https://www.rekenkamer.nl/publicaties/rapporten/2021/01/26/aandacht-voor-algoritmes

[Dast18] Dastin, J. (2018, 11 October). Amazon scraps secret AI recruiting tool that showed bias against women. Reuters. Retrieved from: https://www.reuters.com/article/us-amazon-com-jobs-automation-insight-idUSKCN1MK08G

[DDPA20] Dutch Data Protection Authority (2020, 17 July). Werkwijze Belastingdienst in strijd met de wet en discriminerend. Retrieved from: https://autoriteitpersoonsgegevens.nl/nl/nieuws/werkwijze-belastingdienst-strijd-met-de-wet-en-discriminerend

[DDPA21] Dutch Data Protection Authority (2021, 7 December). Boete Belastingdienst voor discriminerende en onrechtmatige werkwijze. Retrieved from: https://www.autoriteitpersoonsgegevens.nl/nl/nieuws/boete-belastingdienst-voor-discriminerende-en-onrechtmatige-werkwijze#:%7E:text=In%20de%20zomer%20van%202020,de%20bestrijding%20van%20georganiseerde%20fraude.

[FBP22] Federal Bureau of Prisons (n.d.). BOP: First Step Act, Resources. Retrieved from: https://www.bop.gov/inmates/fsa/pattern.jsp

[Hawk22] Hawkins, S. (2022, 29 March). USPS Escapes Claims Over Its Facial Recognition Technology. Bloomberg Law. Retrieved from: https://news.bloomberglaw.com/tech-and-telecom-law/usps-escapes-claims-over-its-facial-recognition-technology

[Hiji22] Hijink, M. (2022, 12 January). Wie zet z’n tanden in de foute algoritmes? NRC. Retrieved from: https://www.nrc.nl/nieuws/2022/01/12/wie-zet-zn-tanden-in-de-foute-algoritmes-a4077972

[John22] Johnson, C. (2022, 26 January). Flaws plague a tool meant to help low-risk federal prisoners win early release. NPR. Retrieved from: https://choice.npr.org/index.html?origin=https://www.npr.org/2022/01/26/1075509175/justice-department-algorithm-first-step-act?t=1650375204324&t=1652358333950

[Judi20] The Judiciary (2020, 5 February). SyRI-wetgeving in strijd met het Europees Verdrag voor de Rechten voor de Mens. Retrieved from: https://www.rechtspraak.nl/Organisatie-en-contact/Organisatie/Rechtbanken/Rechtbank-Den-Haag/Nieuws/Paginas/SyRI-wetgeving-in-strijd-met-het-Europees-Verdrag-voor-de-Rechten-voor-de-Mens.aspx

[KPMG20] KPMG Advisory N.V (2020, 10 July). Rapportage verwerking van risicosignalen voor toezicht: Belastingdienst. Retrieved from: https://open.overheid.nl/repository/ronl-42970d17-d8b9-41d6-aa8f-d0cc52ab97c8/1/pdf/kpmg-rapport-fsv-onderzoek-belastingdienst.pdf

[Logi19] Logically (2019, 30 July). 5 Examples of Biased Artificial Intelligence. Retrieved from: https://www.logically.ai/articles/5-examples-of-biased-ai

[MIKR21] Ministry of the Interior and Kingdom Relations (2021, July). Impact Assessment Mensenrechten en Algoritmes. Retrieved from: https://www.rijksoverheid.nl/documenten/rapporten/2021/02/25/impact-assessment-mensenrechten-en-algoritmes

[Muni22] Municipality of Rotterdam (2022). Algorithm register. Retrieved from: https://www.rotterdam.nl/bestuur-organisatie/algoritmeregister/

[NCoA22] Netherlands Court of Audit (2022, 18 May). Algoritmes getoetst. Retrieved from: https://www.rekenkamer.nl/publicaties/rapporten/2022/05/18/algoritmes-getoetst

[NIST22] National Institute of Standards and Technology (2022). NIST Artificial Intelligence Risk Management Framework (AI RMF). Retrieved from: https://www.nist.gov/itl/ai-risk-management-framework

[NORE21] NOREA (2021, December). NOREA Guiding Principles Trustworthy AI Investigations. Retrieved from: https://www.norea.nl/download/?id=10966

[OCC21] Office of the Comptroller of the Currency (2021, 18 August). Model Risk Management: New Comptroller’s Handbook Booklet. OCC Bulletin 2021-39. Retrieved from: https://www.occ.treas.gov/news-issuances/bulletins/2021/bulletin-2021-39.html

[Pols21] Pols, M. (2021, 15 December). Privacywaakhond AP krijgt nieuwe taak als algoritmetoezichthouder en meer geld. FD.nl. Retrieved from: https://fd.nl/bedrijfsleven/1424029/privacywaakhond-ap-krijgt-nieuwe-taak-als-algoritmetoezichthouder-en-meer-geld-nle2cacLRh0P

[Sing22] Singer, M. (2022, 22 March). How To Guard Against Sudden, Unexpected Drops In Your Credit Score. Forbes. Retrieved from: https://www.forbes.com/sites/theyec/2022/03/22/how-to-guard-against-sudden-unexpected-drops-in-your-credit-score/?sh=2f89893e6bf5

[Team22] Team Stadszaken.nl (2022, 21 March). BZK: gemeenten moeten zelf bepalen hoe ze met algoritmes omgaan. Stadszaken.nl. Retrieved from: https://stadszaken.nl/artikel/4169/bzk-gemeenten-moeten-zelf-bepalen-hoe-ze-met-algoritmes-omgaan

[Voll22] Vollebregt, B. (2022, 18 January). Zo werd Myrthe Reuver de dupe van haar data: ‘Ze geloven in eerste instantie het systeem’. Trouw. Retrieved from: https://www.trouw.nl/economie/zo-werd-myrthe-reuver-de-dupe-van-haar-data-ze-geloven-in-eerste-instantie-het-systeem~b17af53f/

[VVD21] VVD, D66, CDA and ChristenUnie (2021, 15 December). Omzien naar elkaar, vooruitkijken naar de toekomst: Coalitieakkoord 2021 – 2025. Retrieved from: https://www.kabinetsformatie2021.nl/documenten/publicaties/2021/12/15/coalitieakkoord-omzien-naar-elkaar-vooruitkijken-naar-de-toekomst

Blockchain technology in the luxury watch industry: moving beyond the hype towards effective implementation

Because of its ability to provide unforgeable proof of ownership and authenticity of watches through digital certificates, Blockchain can benefit consumers by creating trust in pre-owned market transactions and transparency on brands’ commitment to environmental sustainability. In this article, we review the drivers behind the adoption of blockchain technology in the luxury watchmaking industry during the last few years. We will take a close look at how Blockchain is being used to create digital twins of watches to ensure the traceability and authenticity of watches, with particular attention to the case study of Breitling, one of the pioneering watchmaking companies in the use of blockchain technology. Finally, we will take a glimpse at how the collection of luxury watches may become a fully digital experience through the launch of non-fungible watches, or digital-only watches.

Introduction

Blockchain has often been referred to as the internet of the future and its potential for disruption has been compared to the changes brought by the Internet to our way of life since the turn of the century. First appearing in 2008, when developers under the pseudonym of Satoshi Nakamoto published a white paper defining its model, Blockchain has since found applications in the world of crypto currencies and in organizations’ supply chains.

If a few years ago the adoption of Blockchain in the luxury watch industry seemed to be a hype, nowadays it has become a mature trend that is changing the relationship between watch owners, collectors, consumers in general and luxury watch brands. An increasing number of brands are adopting Blockchain to implement digital IDs or “Digital Passports” for their watches in order to grow their Direct-to-Consumer (DTC) channels and increase their margins – by cutting out intermediaries (i.e. multi-brand retailers) – and better connect with consumers and take control of the customer relationship.

A 2021 McKinsey study forecasts that about 2.4 USD billion in annual watch sales, spanning the premium to ultra-luxury segments, will shift from multi-brand retailers to direct-to-consumer brands by 2025 ([Beck21]). Driven by the young consumer segment, with Millennials and Generation Z leading the way, the e-commerce of luxury watches will be the fastest-growing direct-to-consumer (DTC) channel, rapidly expanding from just 5% of sales in 2019 to between 15% and 20% by 2025.

What is Blockchain technology?

Blockchain is a digital ledger, decentralized and distributed over a network, structured as a chain of registers responsible for storing data. It is possible to add new blocks of information to the chain of registers (i.e. blockchain), but it is not possible to modify or remove blocks previously added to the chain. Encryption and consensus protocols guarantee security and immutability across the blockchain. The result is a reliable and secure system, where our ability to use and trust the system does not depend on the intentions of any individual or institution (see Figure 1).

C-2022-2-Galantini-1-klein

Figure 1. Blockchain Fundamentals. [Click on the image for a larger image]

Blockchain enables the digitalization and storage of the identity of a watch as a block onto the digital ledger as a digital ID (e.g. think of it as a “digital passport”) and this identity cannot be tempered with. Throughout the life cycle of the watch, the owner will be able to add blocks of information to the existing first identity block – e.g. additional information on servicing and lost and found – and form a chain of blocks representing a chronology of events relating to the watch. This chronology, or chain of blocks, ensures the traceability and transparency of the watch and therefore its authenticity and ownership.

The digitalized identity of the watch is created through non-fungible tokens (NFTs): unique cryptographic tokens that exist on a blockchain and cannot be replicated. NFTs can represent real-world items like artwork and real-estate, in addition to luxury products. They can even represent individuals’ identities, property rights, and more. “Tokenizing” real-world tangible assets such as watches makes buying, selling, and trading them more efficient while reducing the probability of fraud.

The Drivers behind the adoption of Blockchain

An increasing number of brands are adopting Blockchain to grow their Direct-to-Consumer (DTC) channels, which is made possible by digitalization of the relationship between brands and their customers. Social and consumer behavior trends are behind the key drivers behind digitalization.

The customer base of luxury watches has been getting younger. Nowadays, as reported in the McKinsey study, affluent young consumers prefer buying their watches directly from mono brand retail channels. They have a much greater knowledge and culture of watchmaking, which allows them to consider an online purchase without having to visit a store.

The success of the online auctions in 2021 reflects changing social and consumer behaviors: younger generations are more open to purchasing luxury goods online, a trend that was only facilitated and accelerated by the pandemic effects. A snapshot of online auctions buyers and participants shows a large number of them being newcomers (e.g. Phillips 40%; Sotheby’s 44%; Christie’s over 20%), a majority of them being under the age of 40, and bidding from over 80 different countries.

The pandemic has accelerated the digitalization of the relationship between luxury watch brands and consumers. The lockdowns and restrictions caused a temporary stoppage of production and distribution and considerably affected business in the entire high-end watch industry. As a result, many consumers turned to the online market to satisfy their desire for a luxury watch.

Most brands are also moving into the pre-owned market. The pre-owned market was the industry’s fastest growing segment in 2021. It is expected to reach 20 to 32 billion USD in sales by 2025, up from 18 billion USD in 2019, which will be more than half the size of the first-hand market at that time. That’s an 8 to 10% per year increase compared to the 1 to 3% market increase for new watches. High-end watch brands see the pre-owned market as an opportunity to allow new clientele to experience the brand or enter the luxury market in general. Technologies like Blockchain and Artificial Intelligence are helping with authenticity and in creating secure, and intelligent user-friendly e-commerce platforms that establish trust in digital transactions and combat counterfeiting.

A “Digital Passport” for all watches

A “Digital Passport” is essentially a digital certificate of authenticity and ownership of a watch stored on a blockchain. The passport represents a means to monitor and control the long life cycle of watches: from production, to sale, to resale, and to the recycling the materials from the watch case. Blockchain is used to record information (data, photos, documents) characterizing a collector’s watch for example – from point “zero” in time (issue of the certificate) throughout the life of the watch, and in a fully secure and non-falsifiable manner, while also maintaining the anonymity of the owner.

Take the case of this year’s Bulgari Octo Finissimo Ultra limited edition (see Figure 2), a technological excellence with its case of only 1.8 mm thickness. The Italian watchmaker part of the Richemont group announced that each one of the 10 pieces produced has a QR code laser engraved on the barrel and visible on the dial. When scanned, the QR code yields access to a unique NFT representing digital artwork and serving as a method of authentication. The launch of the Octo Finissimo Ultra and its digital passport was made in partnership with LVMH-founded AURA Blockchain Consortium.

C-2022-2-Galantini-2-klein

Figure 2. The Octo Finissimo Ultra by Bulgari. It carries a laser engraved QR code on the dial which gives access to its digital passport. [Click on the image for a larger image]

By creating a unique digital ID for each watch, the AURA Consortium delivers proof of authenticity and ownership, product history information, and access to improve after sales services for clients. It establishes client trust and protection against counterfeiting, transparency as to the material and standard used to produce the watch, and ability to monitor the life of the watch through pre-owned markets.

Using “Digital Passports”, brands connect directly with their customers and get access to consumer data bypassing intermediaries like multi-brand retailers, enabling them to implement more effective marketing and product strategy.

The case of Breitling

In October 2020, Breitling announced that all its new watches would come with a Blockchain-based digital passport. Since then, each new Breitling watch is assigned a unique unforgeable digital certificate that proves authenticity and is also capable of storing information about all events throughout the life cycle of the watch (i.e. repairs, change of ownership, etc.). The solution creates a direct, secure, permanent, and anonymized communication channel between Breitling and its products, and its watch owners.

As explained by Breitling on their website, the goal of embedding its new watches with a digital blockchain technology is to transform its customer relations and watch owner experience by delivering transparency, traceability, and tradability.

The digital passport ecosystem (see Figure 3) enables Breitling to deliver a series of digital after-sales services to its customers starting with the full digitalization of the warranty program, customer support (e.g. repair & service, lost & found, insurance), transparent tracking of the history and transactions of the watch, while ensuring watch owners to maintain control over their personal data and remain anonymous. The innovative approach by Breitling includes connecting the community of Breitling owners via a trade-in platform where they can transfer the ownership of their watches, enriched with real time estimates of the watch value.

C-2022-2-Galantini-3-klein

Figure 3. The Breitling-Arianee “Digital Passport” Ecosystem. [Click on the image for a larger image]

Breitling’s digital passport is secured by Arianee technology. Arianee is an independent participatory organization created in 2017 providing a global standard based on Blockchain for the digital certification of authenticity of luxury watches. For Breitling’s watches with a Arianee certificate, watch owners can scan the QR code on the e-warranty card using their smartphone and then claim ownership of the watch’s digital passport.

In addition to Bretiling, Vacheron Constantin and other luxury watch brands like Audemars Piguet, Roger Dubuis, and MB&F have also subscribed to Arianee’s digital passport.

Conclusion: What’s next? Non-fungible watches are here!

Consider non-fungible watches (NFWs) as the final frontier of watchmaking. A non-fungible watch is essentially a purely digital watch: a non-fungible token (NFT) sold in the form of a video, image, or the intellectual property to a watch prototype. Where watchmakers like Breitling are using NFTs to store on the blockchain the digital passports of a physical watch, other market players have begun using NFTs to store a digital watch not linked to a physical item and sell it or auction it.

Beyer Chronometrie, the world’s oldest watch store located in Zurich, Switzerland, for example, has launched in 2021 one of the market’s first NFWs collections. In collaboration with FTSY8 Fictional Studio, Beyer has designed and created a selection of collectible NFWs called Time Warp Collection (see Figure 4). In the words of Beyer, the collection “explores the intersection between traditional watchmaking and the aesthetics of technology, gaming, fashion, and street wear”. Beye’s NFWs can be purchased via the retailer’s website and can be traded on the OpenSea platform, the largest digital platform for NFT sales and auctions.

C-2022-2-Galantini-4-klein

Figure 4. NFT Watch Allevio from the Time Warp Collection by Beyer Chronometrie and FTSY8. [Click on the image for a larger image]

A NFW is not linked to a physical watch in the real world; it represents a unique item in the blockchain and as such it is valued for its scarcity. Where a watch collector will value the quality of craftsmanship and technical complexity of a mechanical watch, the owner of a NFW will enjoy possession of a unique digital watch that cannot be damaged or stolen. Whether NFWs point to the end of mechanical haute horlogerie as we know it, or they simply represent a hype, only time – measured from a real watch – will tell us.

References

[Aria22] Arianee (2022). Website of Arianee. Retrieved from: https://www.arianee.org

[Aura22] Aura Blockchain Consortium (2022). Website of Aura Blockchain Consortium. Retrieved from: https://auraluxuryblockchain.com

[Beck21] Becker, S., Berg, A., Harris, T., & Thiel, A. (2021, June 14). State of Fashion: Watches & Jewelry. McKinsey & Company. Retrieved from: https://www.mckinsey.com/industries/retail/our-insights/state-of-fashion-watches-and-jewellery

[Beye22] Beyer Chronometrie (2022). The first Beyer NFT Drop – limited to 100 pieces. Retrieved from: https://www.beyer-ch.com/en/blog/the-first-beyer-nft-drop-limited-to-100-pieces/

[Brei20] Breitling (2020, October 13). Breitling becomes the first luxury watchmaker to offer a digital passport based on blockchain for all of its new watches. Retrieved from: https://www.breitling.com/us-es/news/details/breitling-becomes-the-first-luxury-watchmaker-to-offer-a-digital-passport-based-on-blockchain-for-all-of-its-new-watches-33479

[Bulg22] Bulgari (2022). Octo Finissimo Ultra. Retrieved from: https://www.bulgari.com/it-ch/orologi/uomo/octo-finissimo-orologio-titanio-grigio-103611

[Chia19] Chiap, G., Ranalli, J., & Bianchi, R. (2019). Blockchain: Tecnologia e applicazioni per il business. Hoepli.

[Gala19] Galanti, S. (2022, January – March). Lo stato del settore orologiero svizzero nel 2021. La Rivista n.1 – Anno 113, p. 44.

[LVMH21] LVMH (2021, April 20). LVMH partners with other major luxury companies on Aura, the first global luxury blockchain. Retrieved from: https://www.lvmh.com/news-documents/news/lvmh-partners-with-other-major-luxury-companies-on-aura-the-first-global-luxury-blockchain/

AI for data quality management

Every day seems to deliver new solutions and promises in data analytics, data science and artificial intelligence. Before investing in a shiny new emerging technology, however, ask yourself one question: is my data quality fit for purpose? Unfortunately, many organizations have low trust in their own data quality, which paralyzes the investment in data-driven solutions. How can organizations efficiently achieve their data quality goals? How can AI improve data quality management processes?

What is data quality? In simple terms, data has the desired quality if it is fit for use and meets the requirements set by its users. Data quality can be classified along seven different dimensions: completeness, consistency, accuracy, timeliness, validity, currency and integrity.

We know from experience that it is not always easy to rigorously define data quality requirements. At the same time, data quality requirements are based on trade-offs: how does the impact of an incorrect data point compare with the cost of ensuring its quality? Can a business confidently move ahead with the deployment of a solution with the data at hand and the existing data quality management processes? The existing definition of data quality relies on our ability to estimate the repercussions of poor data quality on business activities and processes. For instance, incorrect information on product weights can lead to an inefficient estimation of storage needs, or the overestimation of the profitability of a new distribution center, or even hinder the possibility of exporting goods into a certain country. The consequences can be severe as data quality issues can trigger cascades: “compounding events causing negative downstream effects” ([Samb21]). The importance of data quality can never be understated, especially in AI projects. To the point that there is an increasing number of AI experts advocating a transition from model-centric AI, where the focus is on model improvement, to data-centric AI, which claims that the focus should be on curating data.

Modern data quality processes

The starting point of data quality is a rigorous definition of all the entities and fields in your data model. From there, the building blocks of a data quality system are manually defined rules, sets of constraints that limit the value that data is expected to assume. Can price be negative? Can the field value country be NULL? The need for precise definitions and data quality rules propagates downstream as the data is transformed from raw to informative dashboards and data visualizations.

Traditionally, the identification of data quality issues has been performed through two complementary approaches: one based on a 24/7 monitoring of the data quality rules; a second one based on the setup and design of a workflow that allows the consumers of data to easily report quality issues. This approach is still necessary as it is possible that rules might not offer complete coverage. At the same time, it is possible that rules become obsolete. It is therefore necessary to offer stewards a platform to not only report data quality issues but also contribute to the maintenance and improvement of rules.

Alongside workflows for the identification of data quality issues, mature organizations have workflows for their remediation. Remediation workflows should facilitate the collection of all the necessary information on the records identified as faulty, offer transparency on their root causes and provide input on how issues should be remediated.

Defining rules for identifying data quality issues as well as their manual remediation is very cumbersome. AI can boost the efficiency of both processes.

C-2022-2-Ferrini-1-klein

Figure 1. A modern process for identifying and remediating data quality issues. [Click on the image for a larger image]

Artificial Intelligence for the identification of data quality issues

AI algorithms can automate the identification of issues. For example, the use of anomaly detection algorithms is particularly beneficial in the analysis of large, multi-dimensional datasets where the manual compilation of rules is complex and cumbersome. The use of anomaly detection algorithms also brings an additional benefit: anomaly detection algorithms can produce a score that quantifies the likelihood of data, whereas rules just result in a binary outcome (constraints are either satisfied or not).

Often, data is entered manually by human operators. Computer vision and natural language processing algorithms can also be leveraged to tap into the original data sources, such as PDF and word files, extract data and validate what has been typed in the system.

Furthermore, machine learning models can support the deduplication of data, estimating the probability that two records refer to the same entity (entity resolution).

Artificial Intelligence for the remediation of data quality issues

AI models (regression, clustering) can support the imputation of missing data and the correction of anomalies. Alongside recommending a resolution for data quality issues, models can be designed to output a score that measures the degree of confidence that the AI system has in its recommendation. It is therefore possible to design human-in-the-loop remediation processes where operators are involved only when the confidence of the AI systems falls below a given threshold.

Data quality is an ongoing effort

Getting data quality right is not a one-off activity but an ongoing effort. Cleansing data should be a daily exercise. At the same time, improving the data quality management processes should also be a continuous improvement effort which entails reviewing data quality rules as well as improving the AI models involved in identifying and remediating data quality issues. Mature organizations are increasingly adopting a setup where data scientists are involved in data quality management efforts on an ongoing basis.

Conclusion

The importance of quality data in AI projects is well recognized in the industry: no data analytics or data science initiative can be successful if data quality requirements are not met. Garbage in – garbage out is an old and well-known truth that also applies to data analytics. However, the role that AI can play in improving data quality is often overlooked. Ask not what data quality can do for AI, ask what AI can do for data quality.

Reference

[Samb21] Sambasivan, N., Kapania, S., Highfill, H., Akrong, D., Paritosh, P., & Aroyo, L.M. (2021, May). “Everyone wants to do the model work, not the data work”: Data Cascades in High-Stakes AI. In CHI ’21: Proceedings of the 2021 CHI Conference on Human Factors in Computing Systems (pp. 1-15).

Mastering the ESG reporting and data challenges

Companies are struggling how to measure and report on their Environmental, Social, and Governance (ESG) performance. How well a company is performing on ESG aspects is becoming more important for investors, consumers, employees, and business partners and therefore management. This article tries to shed a light on how companies can overcome ESG reporting (data) challenges. A nine-step structured approach is introduced to give companies guidance on how to tackle the ESG reporting (data) challenges.

Introduction

Environmental, Social and Governance (ESG) aspects of organizations are important non-financial reporting topics. Organizations struggle with how to measure ESG metrics and how to report on their ESG performance and priorities. Many organizations haven’t yet defined a corporate-wide reporting strategy for ESG as part of their overall strategy. Other organizations are already committed to ESG reporting and are struggling to put programs into place to measure ESG metrics and to steer their business as it is not yet part of their overall heartbeat. Currently, most CEOs are weathering the COVID storm and are managing their organization’s performance by trying to outperform their financial targets. Besides the causality between the climate developments in our weather; from a sustainability perspective the waves are becoming higher, the storm is increasing rapidly as ESG is becoming the new standard to evaluate an organization’s performance.

How well a company performs on ESG aspects is becoming an increasingly important performance metric for investors, consumers, employees, business partners and therefore management. Next to performance, information about an organizations’ ESG metrics is also requested by regulators.

Investors are demanding ESG performance insights. They believe that organizations with a strong ESG program perform better and are more stable. On the other hand, poor ESG performance poses environmental, social, and reputational risks that can damage the company’s performance.

Consumers want to increasingly buy from organizations that are environmentally sustainable, demonstrate good governance, and take a stand on social justice issues. And they are even willing to pay a premium to support organizations with a better ESG score.

Globally, we are seeing a war on talent, with new recruits and young professionals looking for organizations that have a positive impact on ESG aspects because that is what most appeals to them and what they would like to contribute to. Companies that take ESG seriously will be ranked at the top of the best places to work for and will find it easier to retain and hire the best employees.

Across the value chain, organizations will select business partners that are for example most sustainable and are reducing the overall carbon footprint of the entire value chain. Business partners solely focusing on creating their value based on the lowest costs will be re-evaluated because of ESG. Organizations that will not contribute to a sustainable value chain can find difficulties in continuing their business in the future.

The ESG KPIs are only the tip of the iceberg

The actual reporting on ESG key performance indicators (KPIs) is often only a small step in an extensive process. All facets can be compared to an iceberg, where only certain things are visible to stakeholders – the “tip of the iceberg”: the ESG KPIs or report in this case. What is underneath the water, however, is where the challenges arise. The real challenge of ESG reporting is a complex variety of people, processes, data and systems aspects which need to be taken into account.

C-2022-1-Delft-01-klein

Figure 1. Overview of aspects related to ESG reporting. [Click on the image for a larger image]

In this article, we will first further introduce ESG reporting including the required insights of the ESG stakeholders. After this we will elaborate more on the ESG data challenges, and we will conclude with a nine-step structured approach how to master the reporting and data challenges covering the “below the waterline” aspects related to ESG reporting.

ESG is at the forefront of the CFO agenda

The rise in the recognition of ESG as a major factor within regulation, capital markets and media discourse has led CFOs to rethink how they measure and report on ESG aspects for their organization.

Finance is ideally positioned in the organization to track the data needed for ESG strategies and reporting. Finance also works across functions and business units, and is in a position to lead an organization’s ESG reporting and data management program. The (financial) business planning and analysis organization can connect ESG information, drive insights, and report on progress. Finance has the existing discipline, governance and controls to leverage on the required collation, analysis and reporting of data with regard to ESG. Therefore, we generally see ESG as an addition to the CFO agenda.

ESG as part of the “heartbeat” of an organization

Embedding ESG is not solely focused on the production of new non-financial report. It is also about understanding the drivers of value creation within the organization and enabling business insights and manage sustainable growth over time. Embedding ESG within an organization should impact decision-making and for example capital allocation.

The following aspects are therefore eminent to secure ESG as part of the company’s heartbeat:

  • Alignment of an organization’s purpose, strategy, KPIs and outcomes across financial and non-financial performance.
  • Ability to set ESG targets and financial performance and track yearly/monthly performance with drill downs, target vs actual and comparison across dimensions (i.e. region, site, product type).
  • Automated integration of performance data to complete full narrative disclosures for internal and external reporting and short-term managerial dashboards.

Embedding ESG into core performance management practices is about integrating ESG across the end-to-end process – from target setting to budgeting, through to internal and external reporting to ensure alignment between financial and non-financial performance management.

An important first step is related to articulate the strategy which is about translating the strategic vision of the organization into clear measures and targets to focus on executing the strategy and achieve business outcomes. ESG should be part of the purpose of the organization and integrated into the overall strategy of an organization. In order to achieve this, organizations need to understand ESG and the impact of the broad ESG agenda on their business and environment. They need to investigate which ESG elements are most important for them and these should be incorporated into the overall strategic vision.

Many organizations still run their business using legacy KPIs, or “industry standard” KPIs, which can allow them to run the business in a controlled manner. Conversely, this is not necessarily contributing to the strategic position that the organization is aiming for. These KPI measures are not just financial but look at the organization as a whole. Although the strategy is generally focused on growing shareholder value and profits, the non-financial and ESG measures underpin these goals, from customer through to operations and people/culture to relevant ESG topics.

The definition of the KPIs is critical to ensure linkage to underlying drivers of value and to ensure business units are able to focus on strategically aligned core targets to drive business outcomes. When an organization has (re-)articulated its strategy and included ESG strategic objectives the next step is to embed it into its planning and control cycle to deliver decision support.

In addition to defining the right ESG metrics to evaluate the organizational performance, organizations struggle with unlocking the ESG relevant data.

Data is at the base of all reports

With a clear view of the ESG reporting and KPIs, it is time to highlight the raw material required which is deep below sea level: data. Data is sometimes referred to as the new oil, or organizations’ most valuable asset. But most organizations do not manage data as it was an asset; not in the way they would do for their buildings, cash, customers and for example their employees.

ESG reporting is even more complex than “classic” non-financial reporting

A first challenge with regard to ESG data is the lack of a standardized approach in ESG reporting. Frameworks and standards have been established to report on ESG topics like sustainability. For example, the Global Reporting Initiative (GRI) and Sustainability Accounting Standards Board’s (SASB) which is widely used in financial services organizations. However, these standards are self-regulatory and lack universal reporting metrics and therefore a universal data need.

Even if there is one global standard in place, companies would still face challenges when it comes to finding the right data whereas data originates from various parts of the organization like the supply chain, human resources but also from external vendors and customers ([Capl21]). The absence of standard approaches leads to lack of comparability among companies’ reports and confusion among companies on which standard to choose. The KPI definition must be clear in order to define the data needed.

In April 2021, the European Commission adopted a proposal for a Corporate Sustainability Reporting Directive (CSRD) which radically improves the existing reporting requirements of the EU’s Non-Financial Reporting Directive (NFRD).

Besides a lack of a standardized approach, more data challenges on ESG reporting arise:

  • ESG KPIs often require data which isn’t managed till now. Financial data is documented, has an owner, has data lifecycle management processes and tooling but ESG data mostly doesn’t. This affects the overall data quality, for example.
  • Required data is not available. As a consequence, the required data needs to be recorded, if possible reconstructed or sourced from a data provider.
  • Data collectors and providers’ outputs are unverified and inconsistent which could affect the data quality.
  • Processing the data and providing the ESG output is relatively new compared to financial reporting and is in many occasions based on End User Computing tools like Access and Excel which could lead to inconsistent handling of data and errors.
  • The ESG topic is not only about the environment. The challenge is that a company may need different solutions for different data sources (e.g. CR360 or Enablon for site-based reporting (HSE) and another for HR data, etc.).

Requirements like CSRD make it clearer for organizations what to report on but at the same time, it is sometimes not clear to companies how the road from data to report is laid out. Looking at these data challenges mentioned above, it is also important for organizations to structure a solid approach on how to tackle the ESG challenges which will be introduced in the next paragraph.

A structured approach to deal with ESG reporting challenges

The required “below the waterline” activities can be summarized in nine sequential steps to structurally approach these ESG challenges. Using a designed approach does not cater for all but will be a basis for developing the right capabilities and to move in the right direction.

C-2022-1-Delft-02-klein

Figure 2. ESG “below the waterline” steps. [Click on the image for a larger image]

This approach consists of nine sequential steps or questions covering the People, Processes, Data and Source systems & tooling facets of the introduced iceberg concept. The “tip of the iceberg” aspects with regard to defining and reporting the required KPI were discussed in the previous paragraphs. Let’s go through the steps one by one.

  1. Who is the ESG KPI owner? Ownership is one of the most important measures in managing assets. The targets and related KPIs are generally designated to specific departments and progress is measured using a set of KPIs. When we look at ESG reporting, this designating is often less clear. Having a clear understanding of which department or role is responsible for a target also leads to a KPI owner. It is often challenging to identify the KPI owner since it can be vague who is responsible for the KPI. A KPI owner has multiple responsibilities. First and foremost, the owner is responsible for defining the KPI. Second, a KPI owner is an important role in the change management process. Guarding consistency is a key aspect, as reports often look at multiple moments in time. It is important that when two timeframes are compared, the same measurement is used to say something about a trend.
  2. How is the KPI calculated? Once it is known who is responsible for a KPI, a clear definition of how the KPI is calculated should be formulated and approved by the owner. This demands a good understanding of what is measured, but more importantly how it is measured. Setting definitions should follow a structured process including logging the KPI and managing changes to the KPI, for example in a KPI rulebook.
  3. Which data is required for the calculation? A calculation consists of multiple parts that all have their own data sources and data types. An example calculation of CO2 emission per employee needs to look at emission data, as well as HR data. More often than not, these data sources all have a different update frequency and many ways of registering. In addition to the difference in data types, data quality is always a challenge. This also starts with ownership. All important data should have an owner who is, again, responsible for setting the data definition and to improve and uphold the data quality. Without proper data management measures in place ([Jonk11]), the data quality cannot be measured and improved which has a direct impact on the quality of the KPI outcome.
  4. Is the data available and where is it located? Knowing which data is needed brings an organization to the next challenge: is the data actually available? Next to the availability, the granularity of the data is an important aspect to keep in mind. Is the right level of detail of the data available, for example per department or product, to provide the required insights. A strict data definition is essential in this quest.
  5. Can the data be sourced? If the data is not available, it should be built or sourced. An organization can start registering the data itself or the data can be sourced to third parties. Having KPI and data definitions available is essential in order to set the right requirements when sourcing the data. Creating (custom) tooling or purchasing third-party tooling to register own or sourced data is a related challenge. It is expected that more and more ESG specific data solutions will enter the market in the coming years.
  6. Can the data connection be built? Nowadays, a lot of (ERP) systems have integrated connectivity as a standard, this is not a given fact for many systems, however. Therefore, it is relevant to investigate how the data can be retrieved. Data connections can have many forms and frequencies like streaming, batch, or ad-hoc. Dependent on the type of connection, structured access to the data should be arranged.
  7. Is the data of proper quality? If the right data is available, the proper quality can be determined in which the data definition is the basis. Based on data quality rules for example for the required syntax (for example: should it be a number or a date) the data quality can be measured and improved. Data quality standards and other measures should be made available within the organization in a consistent way in which again the data owner plays an important part.
  8. Can the logic be built? Building reports and dashboards require a structured process in which the requirements are defined, the logic is built in a consistent and maintainable way and the right tooling is deployed. In this step the available data is combined in order to create the KPI based on the KPI definition in which the KPI owner has the final approval of the outcome.
  9. Is the user knowledgeable to use the KPI? Reporting the KPI is not a goal in itself. It is important that the user of the KPI is knowledgeable enough to interpret the KPI in conjunction with other information and its development over time to define actions and adjust the course of the organization if needed.

Based on this nine-step approach, the company will have a clear view of all the challenges of the iceberg and required steps that need to be taken to be able to report and steer on ESG. The challenges can be divers starting from defining the KPIs, the tooling and sourcing of the data or data management. Structuring the approach helps the organization for now and going forward, whereas the generic consensus is that the reporting and therefore data requirements will only grow.

Conclusion

The demand to report on ESG aspects is diverse and growing. Governments, investors, consumers, employees, business partners and therefore management are all requesting insights into an organizations’ ESG metrics. It seems like the topic is on the agenda of every board meeting, as it should be. To be able to report on ESG-related topics, it is important to know what you want to measure, how/where/if the necessary data is registered and having a possible approach towards reporting. ESG KPIs cannot be a one-off whereas the scope for ESG reporting will only grow; the ESG journey has only just begun. And it is a journey that inspires to dig deeper into the subject and further mature for which a consistent approach is key.

The D&A Factory approach of KPMG ([Duij21]) provides a blueprint architecture to utilize the company’s data. KPMG’s proven Data & Analytics Factory combines all key elements of data & analytics (i.e., data strategy, data governance, (master) data management, data lakes, analytics and algorithms, visualizations, and reporting) to generate integrated insights like a streamlined factory. Insights that can be used in all layers of your organization: from small-scale optimizations to strategic decision-making. The modular and flexible structure of the factory also ensures optimum scalability and agility in response to changing organizational needs and market developments. In this way, KPMG ensures that organizations can industrialize their existing working methods and extract maximum business value from the available data.

References

[Capl21] Caplain, J. et al. (2021). Closing the disconnect in ESG data. KPMG International. Retrieved from: https://assets.kpmg/content/dam/kpmg/xx/pdf/2021/10/closing-the-disconnect-in-esg-data.pdf

[Duij21] Duijkers, R., Iersel, J. van, & Dvortsova, O. (2021). How to future proof your corporate tax compliance. Compact 2021/2. Retrieved from: https://www.compact.nl/articles/how-to-future-proof-your-corporate-tax-compliance/

[Jonk11] Jonker, R.A., Kooistra, F.T., Cepariu, D., Etten, J. van, & Swartjes, S. (2011). Effective Master Data Management. Compact 2011/0. Retrieved from: https://www.compact.nl/articles/effective-master-data-management/

Leveraging technology within Internal Audit Functions

Keeping pace with the business is the trait demanded from Internal Audit Functions (IAFs) today. As organizations continue to evolve and adopt more advanced technology into their operations, the internal auditors’ mandate remains unchanged. To continue adding value to their organization, IAFs are encouraged to embrace the benefits of technology.

Introduction

Organizations transform, at ever-increasing speeds, and new risks continue to emerge. To continue adding value to their organization, Internal Audit Functions (IAFs) are encouraged to embrace the benefits of technology and data analytics. In this article, we provide a perspective of the future of internal audit, a “technology-enabled internal audit.” We will delve into how a leading IAF could implement technology as part of the internal audit methodology by considering the growth in three base aspects: Positioning, People and Process. Technology will create higher efficiencies, improve effectiveness, identify deeper insights, strengthen data governance and security, and enable IAFs to identify and focus on high priority value-adding activities. Moreover, inspire the trust of their stakeholders, creating a platform for responsible growth, bold innovation and sustainable advances in performance and efficiency of an organization as well as improve IAF attractiveness for students and other new hires.

This article is divided into two parts; the first part will provide background information on the actual and relevant topics in technology for IAFs to understand, identify and leverage the technology, data analytics and their organization’s digital landscape. A roadmap for a leading IAF to grow to be more technology-enabled is discussed in Part II where the basic aspects, Position, People and Process are discussed as viewpoints with a case study of how a pension fund administrator mapped their way to leverage technology.

Part I: Key concepts relevant for internal audit

Many organizations are investing in advanced technologies, such as algorithms and artificial intelligence, predictive analytics, Robotic Process Automation, cognitive systems, sensor integration, drones, and machine learning to automate, labor-intensive knowledge work. Leveraging these technologies is not a matter of keeping up with trends for IAFs. Rather, it is a means to continue adding value to organizations and to meet the expectations of an ever-transforming business environment. IAFs should mirror the evolution of the advanced technologies that organizations are implementing. Figure 1 shows a multilayer mapping for a technology enabled internal audit.

C-2022-1-Axt-01-klein

Figure 1. Technology-enabled internal audit multi-layer mapping. [Click on the image for a larger image]

The expanding landscape of technologies is large and multifaceted but can be broken down into four primary categories that lie on a spectrum from simplest to most complex. Next, we will address the following four categories of technologies that can be leveraged by IAFs:

  1. Data analytics & business intelligence
  2. Process mining
  3. Robotic Process Automation (RPA) & intelligent automation
  4. Cognitive technology
  5. Emerging technologies

1. Data analytics & business intelligence

Data analytics is the science and practice concerned with collecting, processing, interpreting and visualizing data to gain insight and draw conclusions. IAFs can use both structured and unstructured data, from both internal and external sources. Data analytics can be historical, real-time, predictive, risk-focused, or performance-focused (e.g., increased sales, decreased costs, improved profitability). Data analytics frequently provide the “how?” and “why?” answers to the initial “what?” questions often found in the information initially extracted from the data.

IAFs have traditionally focused on transactional analytics, applying selected business rules-based filters in key risk areas, such as direct G/L postings, revenue, or procurement, thereby identifying exceptions in the population data. Leading IAFs are realizing the added value of leveraging business intelligence-based tools and techniques to perform “macro-level” analytics to identify broader patterns and trends of risk and, if necessary, apply more traditional “micro-level” analytics to evaluate the magnitude of items identified through the “macro-level” analytics. Data analytics in internal audit involves (re-)evaluating and, where necessary, modifying the internal audit methodology, to create a strategic approach to implement, sustain, and expand data analytics-enabled auditing techniques and other related initiatives such as continuous auditing, continuous monitoring, and even continuous assurance. See Figure 2.

C-2022-1-Axt-02-klein

Figure 2. Journey towards continuous auditing. [Click on the image for a larger image]

The journey from limited IT assurance to continuous auditing – for an IAF involved in financial audits – is visualized above. The IAF will be able to shift its focus from routine transactions to non-routine and more judgmental transactions. At the same time, more of the work performed is being automated. In this journey, the IAF mirrors the developments of the organization itself to optimize the usage of technologies being implemented.

2. Process mining

A fast-growing and value-adding tool is process mining software. Process mining provides new ways to utilize the abundance of information about events that occur in processes. These events such as “create order” or “approve loan” can be collected from the underlying information systems supporting a business process or sensors of a machine that performs an operation or a combination of both. We refer to this as “event data”. Event data enable new forms of analysis, facilitating process improvement and process compliance. Process mining provides a novel set of tools to discover the real process execution, to detect deviations from the designated process, and to analyze bottlenecks and waste.

It can be applied for various processes and internal audits such as purchase-to-pay, order-to-cash, hire-to-retire, and IT management processes. The use of process mining tools to analyze business processes provides a greater insight into the effectiveness of the controls, while significantly reducing audit costs, resources, and time.

3. Robotic Process Automation (RPA) & intelligent automation

RPA is a productivity tool that automates manual and routine activities that follow clear-cut rules by configuring scripts and “bots” to activate specific keystrokes and interface interactions in an automated manner. The result is that the bots can be used to automate selected tasks and transaction steps within a process, such as comparing records and processing transactions. These may include manipulating data, passing data to and from unlinked applications, triggering responses, or executing transactions. RPA consists of software and app-based tools like rules engines, workflow, and screen scraping.

4. Cognitive technology

Cognitive technologies refer to a class of technology, which can absorb information, reason, and think in ways similar to humans. For years, this has been on the uptrend across all industry areas. Organizations are already embarking on implementing cognitive technologies in their key business processes to improve process execution – and with this new reliance on technology, new risks arise on which IAFs must perform audits.

Today’s intelligent automation innovations have the transformational potential to increase the speed, operational efficiency, cost effectiveness, of the IAF’s internal processes, and to empower internal audit professionals to generate more impactful insights, enabling smarter decisions more quickly. Whether or not an IAF chooses to leverage intelligent automation technologies themselves, they are likely part of an organization which requires them to partake in it, giving rise to need for the technology-enabled Internal Audit Function.

Using the data available and adequate understanding of intelligent automation are pre-requisite skills for performing audits and using cognitive technologies. As IAFs further mature in their use of automation tools, they will become better positioned to harness value for their organization.

We conclude with an overview of advantages and opportunities for IAFs to leverage using these. See Figure 3.

C-2022-1-Axt-03-klein

Figure 3. Advantages of technology for internal audit. [Click on the image for a larger image]

5. Emerging technologies

Emerging technologies refers to numerous technology relevant for IAF, either as an audit object, or as means to improve the audit processes itself. We have identified the following set of technologies which are relevant and emerging for IAFs.

Algorithms / artificial intelligence (AI)

A broad and comprehensive algorithms and AI-related risk assessment process is essential for data-driven organizations that want to be in control. The question for IAFs is how to organize this risk assessment process. One auditable topic to consider is the organizing accountability for uses of data between data management teams, application development teams, and business users. Another auditable topic is the formation of network arrangements with third parties. An element that is needed for an IAF, is a long list of known AI-related risk factors. And another list of associated controls that can be used to audit those risks from a variety of perspectives within an organization. The first step for an IAF is taking the strategic decision to take a good look at its algorithms and AI-related risks and where they come from. Currently, internal auditors can audit algorithms and provide assurance for AI frameworks.

Machine Learning is a way to teach a computer model what to do by giving it many labelled examples (input data) and let the computer learn from experience, instead of programming the human way of thinking into an explicit step-by-step recipe. Deep Learning is a subfield of Machine Learning, where the algorithms are inspired by the human brain (a biological neural network). We therefore call these algorithms artificial neural networks.

Cloud computing

An architecture that provides easy on-demand access to a pool of shared and configurable computing resources. These resources can be quickly made available and released with minimal management effort or provider interaction. We see that some IAFs prepared key-controls frameworks for the data stored in the cloud and providing assurance over cloud computing.

Internet of Things (IoT)

“The network of devices, vehicles, and home appliances that contain electronics, software, actuators, and connectivity which allows these things to connect, interact and exchange data.” Leading IAFs are using IoT technology for continuous monitoring of maintenance parameters.

Drones

In technological terms, are an unmanned aircraft. Essentially, a drone is a flying robot that can be remotely controlled or fly autonomously through software-controlled flight plans in their embedded systems, working in conjunction with onboard sensors and GPS. Or simply, IoT connects physical objects to the digital world and drones enhance the physical observation methodology remotely.

Internal audit conducts independent reviews, exposes (possible) vulnerabilities and risks and points the way to solutions. Leading IAFs are using drones for inventory reviews on remote locations. In this way, IAFs offer organizations assurance and insights on these emerging technologies.

Based on a global KPMG survey ([KPMG21]), we observed that only a few leading IAFs have the expertise and capabilities to perform audits on all these topics or to integrate these technologies within their own operations. A reference framework or a work program is often lacking. For IAFs, it’s not a question of whether there is a need for auditing; it’s a question of when.

In the next section, we provide a roadmap to the technology-enabled internal audit.

Part II: Roadmap towards technology-enabled internal audit

We will discuss the differences and effects of a technology-enabled Internal Audit compared to a more traditional IAF and why Positioning, People and Process are crucial elements for an IAF embedding technology in its methodology to add value and improve operations in the organization.

The Positioning aspect touches on the positioning of IAFs within the organization, its governance, mandate, independence, relationships, and importantly, access to structured and unstructured data. The People aspect looks at the competencies and the skills of those individuals within the internal audit team, or those individuals at the disposal of the internal audit team. Lastly, but most importantly, the Process aspect considers the various tools, options and solutions that allows IAFs to utilize data effectively and successfully as part of its risk-based internal approach and the audit methodology.

To remain relevant in current times, the end goal for IAFs should be to effectively implement the use of technology in its risk-based approach to auditing. Each organization will have a different journey to get to the end goal; however, considering Positioning, People and Process should be the starting point.

Traditional versus tech-enabled IAF

Traditional IAFs established an annual plan and a long-term plan (year or multi-year plan) which is not or hardly being updated based on emerging risks and developments that may arise. The level of assurance of advisory audit is also dependent on the judgmental or statistical sampling work of the audit team and audit findings are based on partial observations.

A technology-enabled IAF moves beyond the traditional approach to a robust and dynamic planning with data-driven feedback loops between the IAF and the Executive Board or Audit Committee which provide greater insight to assist management decision making on process improvement and control effectiveness. The risk analysis is conducted with input from data analytics, resulting in a comprehensive and risk-based audit plan. Technology-enabled IAF provides better assurance and insights based on testing of the entire population. Auditors are freed up to focus on the quality and more strategic parts of the audit.

Positioning

Positioning refers to whether the IAF is sufficiently structured and well placed (reporting lines within the organizational structure) to enable it to contribute to business performance. In this context, positioning refers to having suitable mandated access to data and the business and the respect of the other departments across the organization.

This would suffice for a traditional IAF, however, organizations should consider a strategy to implement, sustain and expand the use of technology in their internal audits. More importantly, they should consider the added value derived from the use of technologies to derive insights from vast volumes of information, drawn from across the organization and external sources.

Successful IAFs of the future will be positioned in such a way that they will leverage technology to add value to management and the board. This requires transforming the way IAFs plan, execute, report audits, and manage stakeholder relationships.

Positioning a technology- enabled IAF is key within an organization, and not just the use of technology in audits, but also effectively making use of data, existing infrastructure, and the technical capabilities of data analytics software in its processes. Specifically, a technology enabled IAF should:

  • be characterized by strong relationships at the highest levels and have a regular presence in major governance and control forums throughout the organization while maintaining its independence and objectivity.
  • have a comprehensive understanding of Governance, Risk and Compliance (GRC) framework of the business, including its strategies, products, risks, processes, systems, regulations, and planned initiatives.
  • be recognized by stakeholders as a function that provides quality challenge, drives change within the organization and can connect-the-dots across lines of business and functions utilizing technology.
  • have an integral role in the governance structure as the 3rd line, which is clearly aligned with the organization’s objectives, articulated, and widely understood throughout the organization; and
  • have a defined and documented brand that permeates all aspects of the internal audit department, IAF strategy and is widely recognized and respected both internally and externally.

People

Many traditional IAFs are facing challenges to concretely implement more data-driven procedures into the internal audit process ([Veld15]). Instead of focusing on tools and technology as the entry point for enablement, IAFs should consider the competencies and capabilities that are needed to utilize these tools and technologies effectively.

Technology-driven internal auditing requires a significant amount of critical thinking and understanding of data. Faced with new business processes, auditors must not only be able to quickly understand a new business process and its related data; they must also identify risks that can be quantified and understand how to create analytics-enabled procedures and visualizations of the results which address those risks. For this reason, evaluating and identifying the IAF team’s skills and competencies are fundamental to successful technology-enabled IAF.

Too often, internal auditors have been trained in the next best tool to quickly keep up to date with the speed of changing technologies, without addressing the fundamental purpose for said technologies. As a result, we are all too familiar with participating in training, forgetting most of what was learned or failed to identify the use case in daily work life within a week. Digital awareness is key for internal auditors to identify opportunities to leverage relevant training.

Technology-enabled IAFs have a staffing strategy and talent attraction plan based on their organizational structure, goals, and long-term strategy. Leading technology-enabled IAFs hire employees such as data scientists and create a fully-fledged digital internal audit center of excellence, while it is more common for emerging technology-enabled IAFs to have one or two data analytics and IT Audit specialists in their team.

IAFs that are starting their tech-enabled journey may find it difficult to balance their short-term and long-term staffing requirements. Reliance on third parties – including IT resources from another internal department, a tool vendor, audit/consulting firms or temporary contractors – is a common way to address initial, part-time, or sudden incremental needs. These auditors can enable greater flexibility and be a catalyst for implementing a more technology-driven approach.

Process

A leading internal audit team has a technology-enabled methodology to embed data analytics, IA management applications and GRC solutions into every part of the internal audit methodology and process. To appropriately integrate technology in each step of the internal audit methodology, the IAF should partner with the organization to be able to understand the systems, data or scripts which supports business areas.

Partnerships with Risk & Compliance teams are leveraged to build joint business cases to improve business processes with data in the business. Moreover, a leading IAF team should also cooperate with IT on an operational level, while maintaining its independent role, and understanding the information that needs to be provided to receive the correct data. Each stage of the IAF’s audit methodology can use data, and prioritizing a “data first” approach will provide the required paradigm shift.

To guide IAFs on how to enhance the overall internal audit cycle, we focus on the following key stages (see also Figure 4):

  1. Planning
  2. Scoping
  3. Fieldwork
  4. Reporting, monitoring and follow-up.

In addition to this cycle per internal audit engagement, technology-enabled IAF can embark on a continuous auditing way of working. The data output of the preceding audit can be leveraged as input for the next audit.

C-2022-1-Axt-04-klein

Figure 4. Internal audit execution process. [Click on the image for a larger image]

Planning & scoping

To succeed in embedding data analytics throughout the audit process, the focus on data analytics is introduced in a risk-based planning phase. To identify points of focus during planning and derive meaningful insights throughout the audit process, a leading IAF should leverage business data, technology, analytics, and external sector relevant factors to:

  • Gain data-driven insights prior to fieldwork.
  • Enhance audit objectives with digitization of risk assessments.
  • Identify risks based and automated KPI calculations and data used for prior reporting; and
  • Take an integrated approach including all governance functions to determine a single risk source of truth.
Fieldwork

The technology-enabled Internal Audit Function is not devoid of detailed manual testing. The IAF is aware of this and can identify what technology is best applied when testing controls and mitigating factors frequently with Computer Assisted Audit Techniques (CAATs). The business area, system, and process are the input factors to determine and approach. An experienced tech-enabled auditor assesses this continuously based on availability of data and required assurance. Leading IAFs should:

  • Identify procedural weaknesses or critical transactions using process mining, data analytics, or ERP analytics. These create meaningful and insightful observations in the audit execution.
  • Harness existing technology to automate audit procedures with prebuilt bots and routines for well-known business processes.
  • Apply internal audit management (or GRC) software to create and facilitate their methodology and templates.
Reporting, monitoring & follow-up

Internal audit reports to various stakeholders on a regular basis. This includes reporting of audit results to auditees and senior management, as well as reporting on other generic topics as guided by the IIA Standards. Written reporting is complemented by data-driven dashboards or connected web-based reports for continuous and real-time reporting. Technology empowers the IAF to monitor and follow-up by simply “refreshing” the input data. Leading IAFs should:

  • Develop an effective communication plan which could make use of web-based reporting platforms, such as KPMG Dialogue, to deliver reports which are integrated and seamlessly clarify observations with links to follow up action plans and embedded data-driven results; and
  • Consider integrated and continuous monitoring reports by visualizing the results of data analysis instead of text-based reporting, for example using PowerBI, QlikView or Tableau.

A roadmap for a large Dutch pension fund administrator

The organization is a non-profit cooperative pension administration organization. They offer their clients pension management and asset management services. They manage the pensions of various pension funds, their affiliated employers, and their employees. Looking to modernize their IAD, they developed into a technology-enabled IAF. The roadmap shown in Figure 5 considers the above-mentioned focus areas Positioning, People and Process.

C-2022-1-Axt-05-klein

Figure 5. Roadmap for technology-enabled internal audit. [Click on the image for a larger image]

Conclusion

Organizations are integrating increasingly advanced technologies into their way of working. IAFs are expected to mirror the evolution of organizations to remain relevant, add value and inspire the trust of their stakeholders. Each IAF will have a different journey to improve and innovate to match their organization’s technology-enablement, whereby Positioning, People and Process should be the starting point. Understanding how to Position an IAF that uses technology is essential for IAFs to continue to meet expectations by the organization. Coupled with the correct People with the right competences and skills to drive a technology-enabled audit process. The right skills and competencies are necessary, but not sufficient for an IAF to improve their function with technology. Understanding the relevance for the skills, competencies and technology in the internal audit process is critical to execution.

Where Process includes tools, options and solutions that allow IAFs to utilize data effectively and successfully as part of its risk-based internal approach and the audit methodology, IAFs must seek to keep up with developments in technology which have an impact or can be leveraged in the internal audit process. In doing so, and positioned correctly in the organization with the right people, the IAF will be able to continue to play a vital and relevant role in their organizations. A technology-enabled IAF can contribute to the fundamental shift in perspective and understanding that a dynamic risk environment presents threats and challenges not just to the organization itself, but to all the stakeholders who have an interest in the organization.

References

[Chu16] Maes, T. & Chuah, H. (2016). Technology-Enabled Internal Audit. Compact 2016/4. Retrieved from: https://www.compact.nl/en/articles/technology-enabled-internal-audit

[Idem18] Idema, S., & Weel, P. (2018). Audit Analytics. Compact 2018/4. Retrieved from: https://www.compact.nl/en/articles/audit-analytics

[IIA] Institute of Internal Auditors (n.d.). Profession. Retrieved from: https://www.iia.nl/iia/profession?lang=en

[KPMG21] KPMG (2021). Agile, resilient & transformative: Global IT Internal Audit Outlook. KPMG International.

[Veld15] Veld, M. A. op het, Veen, H. B. van, & Kessel, W. E. van (2015). Data Driven Dynamic Audit. Compact 2015/3. Retrieved from: https://www.compact.nl/en/articles/data-driven-dynamic-audit

[Velt21] Veltkamp, C., & Jagesar, W. (2021). The impact of technological advancement in the audit. Compact 2021/3. Retrieved from: https://www.compact.nl/en/articles/the-impact-of-technological-advancement-in-the-audit/

Transforming ERP from a system of registration to a system of analytics

To ensure competitiveness in today’s business landscape, companies need to maximize the benefits of their ERP system. Although an ERP system in itself has many benefits, information crucial to strategic decision making can be derived by performing data analytics on data generated from ERP systems. In this article, we will examine the case of Microsoft, and how it has enabled the integration of its ERP system, Dynamics 365 Finance and Operations, with Azure Data Lake and Azure Synapse Analytics to allow companies to reap the benefits of a system of analytics.

Introduction

Rapid business modernization facilitated by cloud-based Enterprise Resource Planning (ERP) solutions such as Microsoft D365 Finance & Operations (D365 F&O) enable organizations to collect and store vast amounts of data. These ERP systems allow companies to have a good overview of their core business processes and track their resources. However, current data analytics, business intelligence, and reporting capabilities that come with standard out-of-the-box ERP systems are limited in scope, inflexible, and mainly utilize descriptive analytics. For example, Microsoft D365 F&O out-of-the-box tools include SSRS reporting (mainly used for printable documents such as invoice and packing slip), which only displays descriptive data and is not customizable by the end user without the help of a report developer.

Companies today need to extract valuable insights from the data coming from ERP systems to develop their business strategies. In the past, ERP systems have been designed to ensure consistency in their business processes to achieve certain KPIs, such as to maximize production. Nowadays, in order to remain competitive in the current business landscape, companies must be flexible and be able to quickly respond to changing customer demands. Thankfully, many data & analytics tools such as machine learning are becoming widely available and can aid in more efficient and accurate analysis of company data.

There are many ways in which data & analytics tools such as machine learning can improve company performance by utilizing data from ERP systems. Machine learning algorithms can help predict which suppliers are likely to provide excellent quality raw materials (and also the poorest quality) based on past delivery performance. Another way is to reduce the frequency of equipment breakdowns by utilizing machine-learning algorithms on predictive maintenance based on the data stream from equipment sensors. Self-learning algorithms can also use incident reports in production to help predict production problems on assembly lines ([Colu19]).

Utilizing data & analytics tools on ERP data is not a straightforward task. ERP generates transactional data and has an online transactional processing (OLTP) structure. This enables ERP systems to rapidly process large numbers of transactions by multiple people. On the other hand, Complex data analysis is best performed on data that has an online analytical processing (OLAP) structure. OLAP is optimized for business intelligence, data mining, and other decision-making applications. In this article, we will focus on how Microsoft is enabling its data analytics tools, such as Azure Machine Learning and PowerBI, to be used with the ERP data in D365 F&O through integration with Azure Data Lake and Synapse Analytics ([Sinh21]).

In this article, we will first present the building blocks of an integrated system of analytics, i.e. Microsoft Dynamics 365 F&O, Azure Data Lake, and Azure Synapse Analytics, explain their added value, and how they integrate together, and finally we will present a business case where this integration will add value for the user.

A system of registration – Microsoft Dynamics 365 F&O

A transition to an ERP system such as D365 F&O is part of the digital transformation journey of many companies. According to [Rozn21], some of its advantages are:

  • Higher management performance by linking different aspects of enterprise activities
  • Better information accuracy and availability
  • Improved coordination between branches or departments
  • Easily adapts to expansion or reduction of the company
  • Cost reduction due to decrease of repetitive manual tasks and speeds up activities that involve various requests and approvals

Although the advantages of an ERP system are clear, the potential benefits of an ERP system such as D365 F&O can be further maximized. For the case of Microsoft, it is important to note that the Microsoft Technology Stack also includes data analytics and business intelligence tools such as Power BI and Azure Machine learning. To utilize the capabilities of these tools and analyze D365 F&O data, it is imperative to first understand an important piece of the puzzle: data storage through Azure Data Lake.

Azure Data Lake

Although the Data Lake has gained popularity only recently in business literature, the technology is not new. James Dixon, former CTO at Pentaho, introduced the term in 2011 ([Wood11]). Simply put, a Data Lake is a repository similar to the Documents folder on your laptop. It is folder-based data storage which can store all kinds of files on-premises or in the cloud (e.g., Azure Data Lake). These files contain data which are divided into three categories: structured, semi-structured and unstructured. Structured data is defined as such as it contains a predefined structure in the shape of tables that contain one or more columns. The tables and columns enforce particular characteristics from the data, e.g., data type (text, number, etc.), data length and compliance with business rules (e.g., customer account value is unique per system). Semi-structured data is still structured data in the sense of a predefined format in which it stored (like CSV, XML, etc.), yet there is none or minimal enforcement of data characteristics. For example, a column in a CSV can neither enforce a particular data type nor can it check on business rules as part of CRUD operations (CRUD = Create, Update, Delete records). Whereas semi-structured data still has some form of structure, unstructured data does not have it at all. For example, a fixed format of the data does not exist in cases of emails, images, and Office documents.

The Data Lake is distinguished from a Database by the fact that a database only accepts structured data, while the Data Lake does not have this limitation. So, the logical follow-up question that we receive often from our clients regarding this topic is: why does my company need a Data Lake instead of a Database? The answer to this question is very straightforward: business decisions are increasingly depending on data which keeps growing in size and variety within companies. Database storage is costly in comparison to a Data Lake and only accepts structured data.

Understanding Azure Data Lake and its added value, we will now take a look at how it integrates with Dynamics 365 F&O.

New Microsoft D365 F&O functionality: Azure Data Lake integration

In August and September 2020, Microsoft made new functionality available for public preview in the area of data integration ([Micr21b]). This functionality enables Dynamics 365 F&O (Microsoft ERP) customers to synchronize their ERP data to an Azure Data Lake in a near real-time fashion (every 10 minutes). So, why is this functionality so valuable?

  1. Access to essential data. For the purpose of conducting data analysis, it is important to have access to essential data from your ERP system.
  2. Connection to data analytics tools. Accessible data means being able to extract this data into a storage which can be connected to a Data Analysis tool like Microsoft Power BI or Azure Machine Learning Studio.
  3. Previous limitations with Azure SQL database. The extraction of data was previously limited to only have Azure SQL database as a target storage, which brought the following problems with it:
    1. limited in terms of data size
    2. low data refresh frequency
    3. prone to performance issues
    4. increasingly costly.
  4. Optimized performance. The Azure Data Lake is optimized for large amounts of data, the refresh frequency is optimized to a maximum of 10 minutes, performance issues are avoided through incremental refresh and the costs of Azure Data Lake storage are much less compared to Azure SQL database storage.
  5. Better performance with analytics. The introduction of an optimization of Azure Data Lake performance (Gen 2 Data Lake) promises even better Analytics performance with Azure Synapse Analytics.

Once Azure Data Lake is integrated with D365 F&O, the next step is to ensure that the information flows from the data lake to the data analytics tools, and this is enabled via Azure Synapse Analytics.

Azure Synapse Analytics

Azure Synapse Analytics is a modern platform for managing all technical artefacts of the Data & Analytics function within a company. The introduction of it logically follows the introduction of the Azure Data Lake integration in D365 platform. Microsoft has been working on this solution for quite some time now. It started with Azure SQL Data Warehouse in 2016 and after some modifications, it was rebranded as Azure Synapse Analytics in 2019.

In simple terms, Azure Synapse is a service provided by Microsoft that combines enterprise data warehousing and Big Data analytics with dedicated resources (for better performance and security) or serverless at scale. Azure Synapse allows users to query and work on their data using SQL or Apache Spark, build pipelines for data integration and Extract, Load, and Transformation (ETL). On top of this, Synapse fully integrates with Other Microsoft tools such as Azure Machine Learning and Power BI that add an analytical power as well. In this way, it is possible to create pipelines from extracting the data, modifying it, analyzing it, to publishing a report containing the generated insights from the data all in one solution without the problem of managing different multiple environments and difficulties connecting them. The bedrock of Azure Synapse is Azure Data Lake Storage Gen2 ([Micr21d]). See Figure 1 for an overview of this structure.

Synapse SQL have streaming and machine learning capabilities. Apache Spark for Azure Synapse can be used for data preparation, ETL, and machine learning. Moreover, Azure Synapse allows effortless mix use of Spark or SQL by removing technology barriers between them, where you can explore and analyze different data types stored in the data lake. Synapse also provides the same data integration experience as Azure Data Factory to create a complete full package. Azure also supports a number of languages used for data analytics such as Python, Java, and R. Nonetheless, the low code development environment of Azure Synapse lowers the difficulty of starting to work with such a sophisticated tool ([Micr21d]).

In Figure 1, you can see different data sources available for import. For example, by streaming data you can achieve real-time analysis ([Micr21a]). One can also ingest data from different Software as a Services (SaaS) using the connectors which Azure Synapse Analytics provides. Aside from Azure Machine Learning or Power BI to provide insights from the data, Azure Purview integration with Azure Synapse Analytics allows customers to have unified data governance on their data ([Micr21c]).

C-2021-3-Hamedtavasoli-01-klein

Figure 1. Azure Synapse Analytics structure ([Micr21d]). [Click on the image for a larger image]

Furthermore, Azure Synapse has advanced security and privacy features which includes Azure Active Directory, automated threat detection, as well as Row-level, Column-level, and object-level security. It also supports network-level securities by the means of virtual networks and firewalls ([Meht20]).

Now that we know the different building blocks of a modern data analytics system, we need to see how they all work together.

A system of analytics – Integration of D365 F&O, Azure Data Lake, and Synapse Analytics

There is an extremely valuable synergy between the concepts of D365F&O, Azure Data Lake and Synapse Analytics. It brings customers into a system of analytics, where it moves towards the higher purpose of a full-blown ERP system: understanding and mastering their business through Data Analysis. This is achieved by creating a platform in which Data Analytics function within an organization.

Azure Data Lake is at the core, acting as the central storage of all business-related data coming from various Microsoft Business Applications, yet it will also be a possible repository of unstructured data from IoT devices, social media, etc.

The data in the lake is still in its raw format, however. So, on top of the Azure Data Lake lays Azure Synapse Analytics is the professional playground of the Data Engineer, Data Analyst and Data Scientist. It is the system which is accessible in the cloud and brings all Data Analytics experts together. It enables the experts to clean the raw data, combine it and create business insights in a controlled IT environment. Azure Synapse will enable the Data Analytics team to:

  1. access the data from the Azure Data Lake;
  2. combine the data from unintegrated systems, and if required, enrich with even more data sources;
  3. perform algorithmic data analysis using the data from step 1 and/or step 2;
  4. utilize Power BI to present the new insights and enable improved decision making processes;
  5. perform their job in a completely scalable solution which is ready for Big Data ingestion and algorithmic data analysis on top of it!

Business case

Let’s illustrate how the synergy works in practice using an example based on a case inspired by an actual client. The company Quality Bikes is a fast-growing organization that manufactures and sells popular bicycles. To facilitate their rapid growth and enable business process standardization across the globe, they have decided to have D365FO as their ERP system covering the back-office processes and the manufacturing processes. Next to D365FO, the client is using D365CE as its CRM system which integrates with D365FO by linking the opportunity to sales quotes. Quality Bikes has a very strong focus on Customer Service as the CEO believes that keeping their existing customers satisfied is the key to their success. Therefore, they developed a unique customer service process, where the management team has decided to hire a third party to build a proprietary application which integrates with D365FO and CE. To comply with their Cloud strategy, the proprietary application is being hosted in Azure.

Once the applications were live, Quality Bikes understood that it was time to reap the benefits from all the data being registered across the new applications. To do so, the data had to be brought into one data storage. This was the perfect moment to turn on the Azure Data Lake integration in F&O and CE. Therefore, the most essential records from D365FO, D365CE and the proprietary service application were synchronized to the data lake in a near real-time fashion.

On top of the Azure Data Lake, Quality Bikes decided to make use of Azure Synapse Analytics. Their Data Engineers are cleaning the data using the Azure Data Bricks integration on the Synapse platform and creating a harmonized cross-system data model which now contains data that is ready for analysis. This is the point where the quantitative data analysis skills of the Data Scientists of Quality Bikes come into play. Using fundamental techniques in algorithmic data analysis, a set of intelligent solutions has been built into Synapse with integrated Machine Learning tools that Microsoft is providing on the platform.

The COO of the company claims that his company has truly managed to turn data into assets which help the business to thrive even more, and their journey in turning data into value has just started. The resulting better management is due to the intelligent solutions built in Synapse, which were able to execute improved control over manufacturing machinery outages through a set of predictive maintenance models. Moreover, by connecting their CE data with external data sources like Twitter and Facebook and utilizing the power of Multiple Regression Analysis in Azure Synapse, they are now able to forecast sales with extremely high precision. The commercial director stated: I know with quite a level of certainty how our sales funnel will evolve in the coming months. Finally, Quality Bikes Data Scientists have spent a tremendous amount of time in the analysis of service data. Using multiple statistical techniques using Python in Synapse, they were able to uncover the key drivers of customer satisfaction. These key drivers are now an integral part of upper management dashboards and incorporated in their performance management system.

Conclusion

Recent developments within the Microsoft Technology Stack allowed the transformation of D365 F&O from a system of registration to a system of analytics. The integration of D365 F&O, Azure Data Lake, and Azure Synapse Analytics creates a synergy that transcends the traditional benefits of an ERP system. It opens the possibilities for customers that are currently using D365 F&O to take advantage of the data analytics tools that the Microsoft Technology Stack has to offer. Moreover, this integration is not only limited to D365F&O, rather, it can be expanded to other data sources such as Microsoft Dynamics CE and even sources of unstructured data. This allows companies to make holistic strategic decisions, which is illustrated by the business case presented.

References

[Colu19] Columbus, L. (2019, October 11). 10 Ways Machine Learning Can Close Legacy ERP Gaps. IQMS Manufacturing Blog. Retrieved from: https://erpblog.iqms.com/10-ways-machine-learning-improves-erp.

[Meht20] Mehta, R. (2020, October 16). Understanding Azure Synapse Analytics (formerly SQL DW). SQLShack – articles about database auditing, server performance, data recovery, and more. Retrieved from: https://www.sqlshack.com/understanding-azure-synapse-analytics-formerly-sql-dw/.

[Micr21a] Microsoft (2021, May 18). Azure Synapse Analytics output from Azure Stream Analytics. Microsoft Docs. Retrieved from: https://docs.microsoft.com/en-us/azure/stream-analytics/azure-synapse-analytics-output

[Micr21b] Microsoft (2021, September 16). Finance and Operations entities in a customer’s data lake. Dynamics 365 Release Plan. Microsoft Docs. Retrieved from: https://docs.microsoft.com/en-us/dynamics365-release-plan/2020wave1/finance-operations-crossapp-capabilities/fo-entities-customers-data-lake

[Micr21c] Microsoft (2021, September 28). What is Azure Purview? Microsoft Docs. Retrieved from: https://docs.microsoft.com/en-us/azure/purview/overview

[Micr21d] Microsoft (2021, August 25). What is Azure Synapse Analytics? Microsoft Docs. Retrieved from: https://docs.microsoft.com/en-us/azure/synapse-analytics/overview-what-is

[Rozn21] Roznovsky, A. (2021, April 6). Benefits of ERP: 10 Advantages and 5 Disadvantages of Enterprise Resource Planning. Retrieved from: https://light-it.net/blog/what-are-the-primary-business-benefits-of-an-erp-system/.

[Sinh21] Sinha, T. (2021, March 16). OLAP vs. OLTP: What’s the Difference? IBM. Retrieved from: https://www.ibm.com/cloud/blog/olap-vs-oltp.

[Wood11] Woods, D. (2011, July 21). Big Data Requires a Big, New Architecture. Forbes. Retrieved from: https://www.forbes.com/sites/ciocentral/2011/07/21/big-data-requires-a-big-new-architecture/?sh=5600269a1157.

How to use your data in your decisions

Taking the right decisions has always been key for the success of organizations. If we look back, intuition and experience were the most important factors in decision-making. However, nowadays an enormous amount of data is being produced. Organizations can easily obtain that data but still struggle to implement data-driven decision-making in their daily operations. Organizations that are able to use data in their decisions, are significantly outperforming those that are not. In this article we try to answer the question why some organizations find it difficult to adopt data in their decision-making process, and we take away the typical concerns of organizations.

Introduction

We live in a time where data is becoming increasingly important as we are getting better in capturing and utilizing the enormous amount of data that is generated by everything we do. This leads to more accurate decision-making as we are able to better predict what will happen than ever before using the abundance of available data. Examples are numerous: the health care industry is able to predict sickness and success rates of treatments, the retail industry can better market their products, banks can more accurately predict fraud, and supply chain departments are able to constantly monitor how many products are needed when and where.

However, despite the fact that the benefits of data-driven decision making are evident and easy to understand, a multitude of organizations still struggle to embed simple data-driven decision making in their day-to-day practice as the capabilities needed to enable this are seen as unobtainable. In this article we explain the importance of data-driven decision making and we elaborate on how a typical organization can easily adopt simple data-driven decision making by utilizing technology that is readily available.

Before we turn to how an organization can implement this type of decision making we will elaborate on the idea of data-driven decision making itself and we will describe what has caused the emergence of this managerial style. Next, we will explain how an organization can benefit from it and lastly, we will give practical advice on how KPMG, with the help of Microsoft technology, can assist in the transition from intuition to logic.

What is data-driven decision making?

So what is data-driven decision making? As the name suggests, this type of decision making is based on actual data rather than on intuition or observation. It uses facts, metrics and other data to steer strategic choices that align with an organization’s goals, objectives and initiatives. This of course contrasts with basing decisions on gut feeling, simple observation or personal experience. Data-driven decision making quantifies and objectifies the rationale behind a decision. This does not only enable an organization to make a better choice; it also helps with analyzing the results of that decision afterwards.

The interest for this type of decision making has dramatically increased. According to a global survey held by the Business Application Research Center ([BARC]), answered by over 700 organizations, 50% of organizations agree that data is critical for decision-making and should be created as an asset in their organization, and two-thirds believe it will be in the future. However, only one-third of enterprises currently use data in their decision-making even though almost all organizations expect to do so in the nearby future. Interestingly, there is also a difference between high-performing organizations and laggards, as the best-in class organizations base their decisions up to 30% less on intuition and gut feeling. The results of this global survey perfectly describe the paradox between organizations understanding the need for data-driven decision making and the inability to actually implement this in their organization.

Before we dive further into the concept of data-driven decision making it is important to stress the fact that data does not replace the intuition or experience of a manager. They co-exist and can be seen as two sides of the same coin, as the quality of the manager is still of critical importance to form a decision. What data-driven decision making does, is providing managers with a foundation to base their decision on. Sometimes this strengthens the beliefs of the manager, and sometimes it goes straight against it. Either way, the manager plays a crucial role in making the final decision. Moreover, for those decisions for which little quantitative data exist, the decisions based on intuition and experience still outperform purely data-driven choices.

Data-driven decision making follows the five phases that are shown in Figure 1. It all starts with defining a data-driven strategy that is carried across the organization. Next, the key areas in which data-driven decision making can bring the most benefit should be identified to have a clear focus. An organization can then pinpoint the target data that is needed to form a data-based choice. The next step is to actually collect and analyze the data that was identified and finally, an organization should form a decision based on the analysis.

C-2021-3-Erikci-01-klein

Figure 1. Process of data-driven decision making. [Click on the image for a larger image]

As can be seen, data-driven decision making starts with a strategic choice and should be an integral part of the business process to make it a success. It starts top-down but to fully embed this type of decision making in an organization, the benefits need to be clear in the entire organization, as all layers play a role in the process.

Why should an organization define a strategy where data-driven decision making is at the heart of the business? That is the question we will answer in the next section.

Why organizations will benefit from data-driven decision making

Earlier, we already gave a few examples on how data-driven decision making enables organizations to better predict the future such as the more precise prognosis of success rates of treatments or the increased accuracy of the prediction of fraud. Using data insights, it becomes possible to make more informed decisions that will in turn lead to a better performance. Moreover, basing your decisions on data also ensures that management reports and day-to-day operations rely on a stable and non-subjective basis. More generally speaking, data-driven decision making has a positive impact on the five pillars that are depicted in Figure 2.

C-2021-3-Erikci-02-klein

Figure 2. Impact pillars of data-driven decision making. [Click on the image for a larger image]

1. Greater transparency

The first benefit of data-driven decision making is the increase in transparency and accountability. Because data is objectifiable, internal and external stakeholders can understand why decisions are made and the organization as a whole becomes more transparent. For an organization, this means that their strategy becomes easier to explain making sure alle stakeholders are on board. Another benefit of the use of data that can be objectified is that it helps with communication between departments as there is one source of truth which fosters collaboration. Moreover, threats and risks can be identified earlier, and the morale of employees is promoted as they can easily see the outcome of their work.

Data-driven decision making also increases the accountability as the data can be accessed during and after the decision is formed. This helps with internal and external audits and personal liability concerns are largely mitigated.

2. Continuous improvement

Another advantage of data-based decision management is that it can lead to continuous improvement. As the amount of data increases and the technology to analyze that data becomes more and more available, the accuracy of the decision gets better over time. Also, because this type of decision making is not reliant on the knowledge or skill level of managers, it is easier to scale up and rapidly implement decisions as more data becomes available.

3. Analytic insights

Data-based decision making helps with solving complex problems as it enables management to test different scenarios and compare outcomes. It also speeds up the decision-making process as the analysis is done automatically. An organization can use real-time data and past data patterns to get valuable analytical insights that significantly increases the performance of the organization.

4. Clear feedback

Another advantage of data-driven decision making is that it ensures a feedback loop. It helps to do research into what is supposed to happen and what is not, making sure the organization is able to formulate new products and market them, as well as assist in setting up a collections strategy for example. This also means that trends can be identified even before they occur. Using historical data, an organization can predict what will happen in the future or what they need to adjust for better performance. This can help to maintain a good relationship with customers as an organization can introduce new products that constantly meet their changing preference.

5. Enhanced consistency

Lastly, embedding data-based decision making in your organization will help consistency over time. As people within the organization know how decisions are formed, they can reproduce and take actions accordingly to simulate and improve the outcome. If the entire workforce is involved in the process around the data-based organization, it will drive consistency even further as their skills are trained as well as their ability to work with data increases.

The five pillars that are positively impacted by data-driven decision making enable a typical organization to form better decisions that are more robust and can be replicated or adjusted as time progresses. It is important to note that a data-based strategy is not only for tech-savvy organizations, but can be used in all organizations. It can simplify and speed up the processes concerning all types of decisions. There are plenty of examples of where a typical organization can benefit from data-driven decision. Think of forecasting your cashflow using historical data on when customers pay their invoice. Customer payment data can also be used to adjust your collections strategy or payment terms. A typical organization can also use data to set the correct price of products based on marginal revenue figures, or they can analyze what their marketing budget should be based on brand awareness. The examples are countless and with the development and increased availability of business intelligence software, organizations without deep-rooted technical expertise are able to analyze and extract insights from their own data. This means that every organization can produce reports, trends, visualizations and insights that facilitate their decision-making process.

How you can enable data-driven decision making

In the previous sections we explained why the implementation of data-driven decision making became a top priority for many managers in all kinds of sectors and industries. The benefits are evident and seem easily obtainable. However, numerous organizations still struggle to embed simple data-driven decision making in their organization. In this section we will explain how you can enable this type of decision making with the use of existing technology and the right mindset.

Earlier we identified five steps in the process to reach data-driven decision making. The first three blocks relate to the organization’s strategic choice to start the process and to think of areas and data that are necessary to form the decisions that are backed by data. Usually, organizations do not find it difficult to complete those first steps. The challenges arise in the last two steps that are highlighted in Figure 3, where the actual analysis and decision-making takes place, which is what we fill focus on in this section.

C-2021-3-Erikci-03-klein

Figure 3. Enabling the process of data-driven decision making. [Click on the image for a larger image]

The collect & analyze step refers to, as the name already suggests, not only the collection of data but also the visualization of that data to make it understandable and relatable. Building this kind of capability on your own, especially for a mid-size organization with a focus on other core activities, can be very complex, which is the exact reason why those organizations choose to not go down that road. However, as we already implied before, existing technology can be leveraged to effectively and quickly implement and scale up data-driven decision making. KPMG, in combination with the capabilities of Microsoft Dynamics 365, can help with that transition.

Dynamics 365 is a combination of interconnected systems that combine CRM and ERP capabilities using modular applications. It offers an integrated solution in which all your data, business logic and processes are stored. This means that, instead of having siloed functions with separate databases, all capabilities are integrated and can leverage on the underlying common data model. Dynamics 365 offers, on top of this, out of the box reports using PowerBI that can be used as a basis for data-driven decision making. It for example enables you to identify people that are most likely to buy based on customer profiles; it can be used for connected field service utilizing Internet of Things; or allows you to adjust your collections strategy based on customer payment data. As mentioned earlier, this is all standard functionality and is readily available to everyone.

Although the possibilities are endless, KPMG suggests starting small with quick wins that prove the benefits of data-driven decision making within your organization. This also allows for a simple introduction without immediately diving into unexplored functionality.

One of the key areas that can immediately profit from data-driven decision making is an organization’s finance process. An organization typically already collects all customer, vendor, bank and other data in their finance system. This data, when used right, can immediately be leveraged to improve your decision-making when it comes to questions like: what is my cashflow forecast? Or how should I set my prices to generate the most revenue? These kinds of questions can be easily answered by Microsoft Dynamics 365 for Finance using out of the box reports and even a machine-learning functionality to for example accurately predict your cashflow. It is also possible to run various forecasts on your budget or project to determine the perfect rate for your employees. For an organization whose focus is not primarily on business intelligence, this means that they can still leverage on sophisticated tools that aid in decision-making therefore increasing their accuracy and in turn their performance. As we saw earlier, organizations that are able to implement data-driven decision making, perform significantly better and Microsoft D365 is one of the tools that can be used to get started with this way of working.

Until now, we primarily focused on the most important drivers of the implementation of data-driven decision making, such as the tooling and the strategy. However, there are other factors that we cannot neglect. One of those is the trust that an organization needs to have in their data. In 2016, KPMG International commissioned Forrester Consulting to examine the status of trust in Data and Analytics by exploring organizations’ capabilities across four Anchors of Trust: Quality, Effectiveness, Integrity, and Resilience. A total of 2,165 decision makers representing organizations from around the world participated in the survey. The study showed that, on average, only 40 percent of executives have confidence in the insights they receive from their data. This means that even though the capabilities are within reach, organizations still find it difficult to trust the results of a data-driven approach. This is usually caused by data that is cluttered and of poor quality. KPMG assists organizations with getting their data clean and clear by analyzing the four Anchors of Trust. As we like to say, there are no decisions without Trusted Analytics. After analyzing an organization, KPMG is able to detect the data flaws and how to solve them. By building an organization data model from the ground up, data-driven decision making becomes trustworthy, effective, and easy to use.

In addition, embedding data-driven decision making can also be challenging as people and processes within the organization might need to change. As mentioned earlier, an organization should start the implementation top-down as it shows the involvement and support of management. To make sure that this support is carried across the entire organization, it is important to then focus on quick wins and the easier part of the implementation. If needed, KPMG can assist with this transition. Combining the experience gained from working across thousands of functional transformations, KPMG created an implementation methodology called Powered Enterprise that follows the leading practices of all those transformations, using the latest technologies. It offers fully re-designed business functions, operating models and processes that can be accessed straight away. This shortens the implementation time and offers out of the box solutions, making sure that your organization can implement data-driven decision making as efficient as possible.

Conclusion

Data-driven decision making can help organizations make better choices as we are able to better predict the future. However, many organizations still struggle to embed this type of decision making in their day-to-day practice because of perceived complexity and the absence of the right capabilities. We argue that, with the rise of new technologies, complexity diminishes, and the necessary capabilities can be easily obtained. Tools like Microsoft Dynamics 365 offer out of the box functionality that can help transform your business processes. Using the standard advanced analytics and business intelligence capabilities that are included in such a tool, you can start small with data-driven decision making. Moreover, real-time dashboards can be leveraged to get instant insights in your organization. To make sure the implementation of data-driven decision making is a success, KPMG can help overcome data trust issues and, using the experience of countless transformations, leading practices become available that prevent common pitfalls from happening. This means that data-driven decision making is finally knocking on all doors, big or small, and we suggest letting this in.

References

[BARC] Business Application Research Center (n.d.). Global Survey on Data-Driven Decision-Making in Businesses. BI Survey. Retrieved August 5, 2021, from: https://bi-survey.com/data-driven-decision-making-business

[Durc21] Durcevic, S. (2021, April 30). Why Data Driven Decision Making is Your Path To Business Success. Datapine. Retrieved from: https://www.datapine.com/blog/data-driven-decision-making-in-businesses/

[Jaco21] Jaco, M. (2020, July 27). Being a Data Driven Business: The Advantages and How to Apply It. ZIP Reporting. Retrieved from: https://zipreporting.com/en/data-driven.html

[KPMG20] KPMG (2020). Guardians of trust. Retrieved from: https://assets.kpmg/content/dam/kpmg/xx/pdf/2018/02/guardians-of-trust.pdf

[McEl16] McElheran, K. & Brynjolfsson, E. (2016, February 3). The Rise of Data-Driven Decision Making Is Real but Uneven. Harvard Business Review. Retrieved from: https://hbr.org/2016/02/the-rise-of-data-driven-decision-making-is-real-but-uneven

[Mill21] Miller, K. (2021, April 23). Data-Driven Decision Making: A Primer for Beginners. Northeastern University Graduate Programs. Retrieved from: https://www.northeastern.edu/graduate/blog/data-driven-decision-making/

[Ohio21] Ohio University (2021, March 8). 5 Essentials for Implementing Data-Driven Decision-Making. Retrieved from: https://onlinemasters.ohio.edu/blog/data-driven-decision-making/

[Pehr20] Pehrson, S. (2020, June 19). What is Microsoft Dynamics 365? Pipol. Retrieved from: https://pipol.com/what-is-microsoft-dynamics-365/

[Rex] Rex, T. (n.d.). The Benefits Of Data-Driven Decision Making: How To Achieve It In 2021. Personiv. Retrieved June 22, 2021, from: https://insights.personiv.com/blog-personiv/the-benefits-of-data-driven-decision-making

[Roth18] Roth, E. (2018, October 2). 5 Steps to Data-Driven Business Decisions. Sisense. Retrieved from: https://www.sisense.com/blog/5-steps-to-data-driven-business-decisions/

[Soft21] Softjourn (2021, June 18). Data-Driven Decision Making. Retrieved from: https://softjourn.com/blog/article/data-driven-decision-making

[Stob19] Stobierski, T. (2019, August 26). The Advantages of Data-Driven Decision-Making. Harvard Business School Online. Retrieved from: https://online.hbs.edu/blog/post/data-driven-decision-making

[Tayl19] Taylor, A. (2019, December 6). 3 powerful benefits of data-driven decisions. Ruby. Retrieved from: https://www.ruby.com/3-powerful-benefits-data-driven-decisions/

The growing relevance of data ethics in insurance

Insurers can greatly benefit from modernizing their data organizations. However, the adoption of new technology by Dutch insurers is a balancing act. Technological advancement can impact the individual, and the Dutch insurer will have to assess whether these impacts align with the expectations from itself, its industry, its regulators, and society. This article examines a methodology by which insurers can pioneer the concept of data ethics in insurance. At the core of this journey lies the ultimate question: “How can we do what’s right?”

Introduction

Emerging technologies are rapidly entering the world of insurance and provide insurers with an opportunity to unlock new value. It comes as no surprise that insurers are actively experimenting with data-driven methods to optimally develop new products, target (potential) customers and predict customer behavior. Because of the substantial value that can be unlocked, the successful application of data analytics may become a differentiator for success in the insurance sector ([DNB16]). But to seize these opportunities, insurance companies need to reshape their organizations and transform into data-driven enterprises. However, an insurer cannot merely focus on value and opportunity. A data transformation should be performed in a controlled manner, taking societal views and expectations into account.

In this article we specifically focus on the ethical impacts and considerations of data analytics in insurance. We consider a well-grounded data ethics framework to be a prerequisite for a controlled transformation towards a data-driven enterprise. As such, we examine a few concrete steps by which the insurer can develop its data ethics framework, which should contribute to the embeddedness of data ethics throughout the organization.

The relevance of data ethics in insurance

The rise of data analytics in the insurance sector has come with its own set of moral challenges and responsibilities. In some cases, a moral implication from the use of algorithms may hit the news; a well-known example is the tendency of algorithms to develop biases that discriminate. Such biases may impact an insurer who adopts these technologies. For example, insurers wishing to prevent fraud aim to identify the most relevant fraud indicators. When the insurer adopts an algorithm in support of this objective, they face a risk that they engage in illegitimate profiling.

Besides bias, other ethical risks could also impact the insurer. With the vast amounts of information published online, it is possible for a complex analytics solution to construct detailed user (group) profiles. An insurer could adopt such a model with the aim to increase the accuracy of its risk profiles of micro segments of (potential) customers and their expected behavior. Even the simplest of algorithms could make a decision that impacts a (potential) customer based on this expected risk profile. It is up for debate whether such use of (public) information is morally justifiable. What is more, ethical dilemmas arise over the level of transparency and control that is necessary. The decisions mentioned above could be made autonomously, without an employee understanding or being able to explain exactly why. Some could even be made without human involvement altogether. Whether such autonomous decision making is acceptable should be carefully weighed by the insurer.

The ethical aspects of data in insurance are more structurally visible when looking at the industry’s business model. This model revolves around the constant (re-)assessment of the aggregate risk and value of claims versus the overall income of insurance premiums. In that context, data analytics allows for a faster and more comprehensive assessment of the risk of claims and opens the door to optimizing the risk-return ratio. Fundamentally, the ethical considerations arise when such analytics are applied to individual persons or customer segments, which may impact the principle of solidarity. For example, an insurer may use data applications to determine whether it wants to accept a person’s application, to set a price, or to nudge behavior to reduce the chance of a claim. The more optimal these applications become in targeting (micro) segments of customers, the more it puts the solidarity principle of the Dutch health insurance sector at risk.

Regulatory pressure is intensifying

As regulated financial institutions in the Netherlands, Dutch insurance companies have the obligation to pursue ethical business operations. Recently, data ethics became an explicit focus area of the regulators across Europe. The European Commission published Ethical Guidelines for Trustworthy AI with the aim of identifying the ethical requirements of the use of data analytics, which have culminated in a 2021 proposal for a regulation on a European approach for Artificial Intelligence. Moreover, the Dutch Central Bank (DNB) and Netherlands Authority for the Financial Markets (AFM) have presented an exploratory study into artificial intelligence (AI) in the insurance sector, focusing specifically on responsible deployment of AI. In their study, the regulatory bodies request insurers to take a risk-based approach for responsibly implementing AI based on ten key considerations ([DNBA19]). More recently, the AFM published yet another exploratory study into the application of data analytics by insurers, examining the opportunities and, especially, risks associated with personalized pricing models, calling for a responsible approach to the adoption of these models by the Dutch insurance sector ([AFM21]).

Increased relevance of data ethics has also led the Dutch insurance sector to internally evaluate its position on the subject. This evaluation led to the introduction of an ethical framework for the application of AI in the Insurance Sector by the Dutch Association of Insurers ([DAI20]). The framework, which is binding for all members of the association and is now a requirement within the association’s self-regulation, requires the insurers to respect seven requirements for responsible AI. A consumer could ultimately file a claim with the Financial Services Complaints Tribunal if the insurer does not act according to the framework.

It is not only regulators and governments that have an interest in the application of data and analytics by insurers. Societal pressures in the domain are equally rising. Research by KPMG ([KPMG19]) indicates that insurers have to battle particularly negative societal views on their trustworthiness when it comes to the application of AI.

Mid 2020, the Dutch insurance sector took a significant step forward in ethical data-driven decision-making by introducing its “Ethical Framework for the application of AI in the Insurance Sector”. The framework, built and driven by the Dutch Association of Insurers (DAI), reflects the recognition by Dutch insurers to be proactive in the use of AI and other data-driven products and processes and its impact on their customers. The Ethical Framework provides Dutch insurers an actionable set of policies on data ethics and privacy.

In parallel with the Framework taking effect, the DAI works with KPMG to inform insurers of what they need to do to meet these new requirements through a series of webinars. KPMG also developed a toolkit with the steps that Dutch insurers need to take to meet the controls, standards and risk requirements in relation to the Framework.

It is expected that there will be further debate and additional regulation – such as recently introduced by the European Commission – on AI, data-driven technologies, and data itself. With the launch of the Framework, insurance companies in the Netherlands are in a leading position for whatever they may face in the future.

How can the Dutch insurer build an ethical data organization?

Data ethics is becoming increasingly relevant in insurance and the sector will experience pressures to proactively engage the subject. Insurers will have to realize that their data initiatives may sometimes clash with the norms and values of internal and external stakeholders and that there can be boundaries to collecting, analyzing and utilizing data. To truly understand these misalignments and boundaries, the insurer must identify and address ethical dilemmas that arise from their data initiatives across the business in a harmonized manner.

An insurer could initiate its transformation towards building an ethical data organization by creating a data ethics framework. This framework revolves around the identification and mitigation of ethical risks that arise from data initiatives. First, the insurer has to generate awareness and educate its personnel. What is ethics? Why is it relevant in the field of data analytics? How does it impact the insurance sector? The insurer then has to understand the prevailing data ethics dilemmas that may already impact the firm. What dilemmas do employees face on a recurring basis? How would they deal with these today? Can a consensus be identified for certain moral domains? On this basis, the organization can draft its data ethics guidelines, which are used to design and implement formal procedures to address and monitor data ethics. Finally, the insurer must find ways to embed ethical decision-making throughout its organization to secure desired behaviors.

C-2021-2-Timmermans-01-klein

Figure 1. KPMG’s data ethics approach. [Click on the image for a larger image]

Generating awareness

The first step to embed ethical decision-making throughout the organization is to generate awareness. This can be initiated by engaging a broad stakeholder group to discuss, stress the importance and learn about the importance of data ethics in the organization. Awareness can be achieved by organizing internal discussion panels and workshops in which participants are challenged to think about the impacts of certain data solutions. The insurer should not view these sessions as a one-off, tick-in-the-box exercise though, but should rather seek to proactively sustain the awareness that it generates through them.

Identifying and assessing data ethics dilemmas

After generating awareness, the insurer can start to examine whether the business already faces specific ethical dilemmas. By targeting key individuals within the business they can pinpoint, discuss, and assess the moral dilemmas and challenges within their jobs and across the business. Examples of the ethical dilemmas that are often encountered in insurance include:

  1. Individual pricing versus group pricing

    Should segmentation capabilities be adopted, or will this interfere with the principle of solidarity? Individual pricing by insurers could create a group of “uninsurable” customers in our society, because they cannot afford the higher premiums.
  2. Data maximization versus data minimization

    Data minimization limits the chance of biases in the algorithm. On the other hand, AI algorithms work best when more data points are available, as new correlations and valuable combinations of variables are discovered.
  3. Uniform ethical boundaries versus situational ethical boundaries

    Should the same ethical considerations and boundaries apply under all circumstances, or do some situations require a different ethical approach, for example when combating fraud or when optimizing prices?
  4. Leveraging data to influence customer behavior

    Should data be used to monitor and reward healthy behavior of a policy holder? This can benefit the customer in maintaining a healthy lifestyle resulting in a longer life expectancy but can also cause unwanted side effects such as failing to visit the doctor in time.

The identification, discussion and assessment of these, and other, ethical dilemmas ultimately provides the basis to establish a data ethics framework that is tailored to the organization.

Drafting a set of data ethics guidelines

Dilemmas and outcomes can be abstracted into guidelines which are applied across the business, especially during the decision-making process for data initiatives. These guidelines provide guidance for data ethics domains as they reflect the norms and values of the organization and its employees. Ethical guidelines in the field of data analytics will often revolve around the principles as illustrated in the framework in Figure 2. The organization defines its data ethics guidelines by asking itself a number of key questions. For example, does the organization feel that it should explain any decision made on the basis of technology? And who is responsible for decisions made through certain application of data analytics?

C-2021-2-Timmermans-02-klein

Figure 2. KPMG’s data ethics framework. [Click on the image for a larger image]

Data ethics principles can be used by anyone within the organization, from developers to senior management, to guide considerations on the implementation and use of technology. Moreover, the guidelines serve as a basis for a continued discussions within the company on data ethics, particularly as the use of data increases and new analytic solutions are further developed. The guidelines can also be of importance when defining the limits within which it can continue to explore new data opportunities.

Formalizing a data ethics approach

After this first exploration, the insurer has to shift towards a solution to embed data ethics within the organization and culture. Ethical guidelines, however well drafted, ultimately fail to impact culture if they are not properly implemented. How can (senior) management, data scientists and other stakeholders make use of them? On the one hand they should follow the guidelines diligently, on the other, they should avoid literal interpretations. Professionals and decision makers should continue to ask themselves whether the data solution they are seeking to deploy is also ethically sound.

A key objective should therefore be to formalize, test and fine-tune the data ethics framework so that it can be implemented across the company. There are several means by which this can be achieved. First, the insurer should have a comprehensive view on any initiative that could or would fall into the scope of the framework. The insurer could implement a registry for all advanced data solutions that are in use or will be adopted soon. Second, the insurer could formally embed the data ethics framework in the Data Policy and make it part of its data governance framework. This will help the insurer to create a formal ethical decision-making framework. Third, the insurer may implement specific impact assessment procedures that examine the trustworthiness of a (proposed) data application. Arising dilemmas can then be addressed following a standardized approach through data governance procedures.

Securing behavior – truly embedding ethical decision-making in the organization

Data ethics is a constantly evolving. The introduction of new technology introduces new responsibilities and boundaries for the organizations that use them. As a final step, we therefore believe that assigning specific roles and responsibilities to the ethics domain will ignite the journey towards establishing a truly ethical data organization and will help secure ethical behavior in the future. In support of this, the insurer could set up a governance body that is specifically assigned to oversee the data ethics program of the organization. This data ethics committee can provide guidance upon AI and data ethics dilemmas and can oversee the effective implementation of the data ethics framework in the organization.

Conclusion – what lies ahead?

By proactively addressing the emerging field of data ethics, the insurer will start to embed ethical decision-making throughout the organization. By means of this article we hope to provide a few pragmatic tools to initiate this journey. It should be noted that an organization does not become ethical overnight. It will take practice, learning and continuous improvement to get there. There is no doubt, however, that insurers should start thinking about how they want to address this in their organizations.

References

[AFM21] Autoriteit Financiële Markten (2021). Personaliseren van prijs en voorwaarden in de Verzekeringssector. Retrieved from: https://www.afm.nl/nl-nl/nieuws/2021/juni/aandachtspunten-gepersonaliseerde-beprijzing

[DAI20] Dutch Association of Insurers (2020). Ethical Framework for the application of AI in the Insurance Sector. Retrieved from: https://www.verzekeraars.nl/media/8220/dutch-association-of-insurers-ethical-framework-on-ai-in-the-insurance-sector.pdf

[DNB16] De Nederlandsche Bank (2016). Vision for the future of the Dutch insurance sector: Sustainability through transformation. Retrieved from: https://www.the-digital-insurer.com/wp-content/uploads/2019/08/1523-Vision-for-the-future-of-the-Dutch-insurance-sector_tcm47-350191.pdf

[DNBA19] De Nederlandsche Bank & Autoriteit Financiële Markten (2019). Artificial intelligence in the insurance sector: an exploratory study. Retrieved from: https://www.afm.nl/en/nieuws/2019/jul/verkenning-ai-verzekeringssector

[KPMG19] KPMG (2019). Onderzoek: Vertrouwen van de Nederlandse burger in Algoritmes. Retrieved from: https://assets.kpmg/content/dam/kpmg/nl/pdf/2019/persberichten/vertrouwen-van-de-nederlandse-burger-in-algoritmes.pdf

Deep Learning: finding that perfect fit

We follow our data scientists in a pro bono engagement, where they applied Deep Learning to photos during a feasibility study. In this article we combine high level theory on Deep Learning with our experience gained during the feasibility study. We purposefully won’t dive into technical details and nuances, instead we will guide you through a pragmatic approach of your first Deep Learning experience.

Introduction

At KPMG, one of our core values reads: Together for Better. For this reason, the Advanced Analytics & Big Data team is in regular contact with the KPMG 12k program: 12.000 pro bono hours for a fair and sustainable world, demonstrating KPMG’s commitment to making a positive impact on society. This brought us into contact with Stichting Natuur & Milieu: an independent environmental organization that believes in a sustainable future for all. One of their initiatives is the yearly “water samples” program (“Vang de watermonsters” programma) ([SN&M20]). This is a science program involving citizens to map the water quality of the small inland waters in the Netherlands, such as ditches, ponds, canals and small lakes. This contributes to a good understanding of the current local water conditions, as input for the ambition to strive for clean and healthy waters in 2027. The results of the investigation are alarming. Only one in five of the waters surveyed turns out to be of good quality, the other eighty percent is of moderate to poor quality. This is an urgent call for improvements, as the pollution is causing danger to the biodiversity and our drinking water purification is becoming more and more expensive as more and diverse pollutants need to be dealt with.

We used the 12k program to conduct a feasibility study for Stichting Natuur & Milieu, which explores ways to automatically process photos from the citizen science program, and how these photos could be used to predict water quality using a Deep Learning approach. This could help use the results of the “water samples” program in a more effective and efficient manner.

During this feasibility study we faced issues that are very common when applying Deep Learning to real world image recognition use cases. It is a perfect case study to reflect upon the key questions that you are likely to face in any instance of developing Deep Learning models to solve a business problem: how do you know that Deep Learning could be the path towards your solution? And how to tackle a very common problem named overfitting that you will undoubtedly face?

In this article we will combine high-level theory with our lessons learned during the feasibility study. We purposefully won’t dive into technical details and nuances, instead we will guide you through a pragmatic approach of your first Deep Learning experience. We will introduce Deep Learning for image recognition and introduce the use case for the feasibility study, presenting three basic considerations to determine whether Deep Learning is suitable for your use case. We will introduce the problem of overfitting and discuss how overfitting can be recognized and prevented. Finally, we will offer a sensible step-based approach to Deep Learning, our conclusion and the next steps for the feasibility study.

Glossary

Machine Learning is a way to teach a computer model what to do by giving it lots of labeled examples (input data) and let the computer learn from experience, instead of programming the human way of thinking into an explicit step by step recipe (Figure 2).

Deep Learning is a subfield of Machine Learning, where the algorithms are inspired by the human brain (a biological neural network). We therefore call these algorithms artificial neural networks (Figure 3).

A Convolutional Neural Network (CNN) is a specific type of neural network that is known to perform well on visual input such as photos.

Features are numerical representations of the input data. A feature represents any pattern/object in the data that holds information that is used to making the prediction. Examples: height / weight / water color / plants / etc.

Data augmentation is the process where additional artificial images are created by applying small transformations (rotations, shifts, brightness changes) to an original image, as can be seen in Figure 4. Data augmentation is an effective way to create more (relevant) input data to train a model.

Deep Learning for image recognition

Deep Learning in the field of computer vision is about training a computer model to automatically recognize objects (for example, dogs) in images. Deep Learning promises better-than-human performance: the first contender in the ImageNet ([Russ15]) large scale visual recognition challenge that showed better performance in classifying images than an untrained human was presented in 2012 ([Kriz17]). Since then, Deep Learning applications end up in the news more than ever: from deep fakes to self-driving cars, from identifying tumors on medical images to virtual assistants like Siri.

These Deep Learning models can learn by example, similar to how the human brain learns. There are many open-source packages available nowadays that have implemented such Deep Learning models and the algorithms to train these. This makes applying Deep Learning to any problem quite easy for most people that have basic programming knowledge.

You may you wonder, what can Deep Learning do for my business?

C-2021-2-Smits-01-klein

Figure 1. The Machine Learning algorithms as described in the glossary are subsets of each other. [Click on the image for a larger image]

C-2021-2-Smits-02-klein

Figure 2. A simplified schematic view of Machine Learning: after a Machine Learning model is trained based on dog and cat images and respective labels, it can take an input image it has not seen before and classify this as either a dog or a cat. [Click on the image for a larger image]

C-2021-2-Smits-03-klein

Figure 3. [Top] Simplified visualization of a biological neuron. The brain consists of a very large number of neurons, that give a living creature the ability to learn. [Bottom] Simplified visualization of an artificial neuron. Basically, it is a mathematical function based on a model of biological neurons. Both the biological neuron and the artificial neuron receive input signals, process these signals and generate an output signal that can be transmitted to other cells (image taken from: https://www.quora.com/What-is-the-differences-between-artificial-neural-network-computer-science-and-biological-neural-network). Based on this concept, an artificial neural network can be trained in a similar way the human brain learns, for instance to distinguish cats and dogs.

C-2021-2-Smits-04-klein

Figure 4. Examples of data augmentation from the Natuur & Milieu feasibility study. [Click on the image for a larger image]

Introducing the feasibility study use case and data set

During the second edition of the “water samples” program in 2020, more than 2600 people participated in the investigation. To validate the results and the conclusions of the program, scientists of the NIOO-KNAW (Netherlands Institute for Ecology) examined part of the sampled locations with professional measuring equipment. They confirmed the high-level conclusions from the citizens science project, but also saw a large difference between the water quality scores from citizens and experts (see Figures 5a & b for details). This is because they were able to measure the amount of nutrients in the water more accurately, which is an important stressor for water quality. The final water quality score was more finegrained for the 106 sites that were re-examined by the experts. The 2496 other sites were lacking this additional information on nutrients, leaving room for improvement on the resulting water quality labels. As the participants had taken photos of the local waters as part of the program and shared them, Stichting Natuur & Milieu was wondering whether these photos could be used to finetune the scores based upon citizen science data alone, by applying Machine Learning concepts.

During our feasibility study we received the data set from the 2020 program, containing 7800 photos of local waters (3 per site). The main objective of the study was to see if we can finetune the overall water quality score (“poor”, “moderate” or “good”). Currently, Stichting Natuur & Milieu calculates the overall water quality score by combining the measurements performed and other characteristics of the local water that were registered by the participants. An example of such characteristics is the “duckweed category”: “none or minimal”, “a little”, “a lot”, “completely full”. Lots of duckweed in the water is an indicator of bad water quality (see Figure 6).

C-2021-2-Smits-05a-klein

Figure 5a. Water quality results from citizens science project 2020 show that 57% of the waters investigated were labelled “poor quality”, and only 20% received the label “good quality” ([SN&M20]). [Click on the image for a larger image]

C-2021-2-Smits-05b-klein

Figure 5b. The control measurement executed by experts from the NIOO-KNAW included nitrogen and phosphate levels. The results of this validation shows that experts label even 87% of the waters as “poor” ([SN&M20]). [Click on the image for a larger image]

C-2021-2-Smits-06-klein

Figure 6. Duckweed in a local ditch. Duckweed covers the surface and prevents sunlight from coming through to the deeper layers. Sunlight is a prerequisite for plant growth and therefore necessary for a healthy biodiversity. [Click on the image for a larger image]

We used this supporting label as our target label; our model should take a photo from the program as input and conclude whether an expert would classify this as “none or minimal duckweed”, “a little duckweed”, “a lot of duckweed”, “completely full with duckweed” during the feasibility study. In the received data set, the number of samples per category wasn’t evenly distributed but biased towards one of the categories (“none or minimal”).

Is Deep Learning worth exploring for my use case?

In order to apply Deep Learning to images successfully, you will need the following basics:

  1. A use case, or a business question that can be converted into an image classification problem1. For example, assigning a category label to an image, such as “dog” / “cat”, or a bit more challenging: multiple categories like human facial expressions “surprise” / “happiness” / “anger” / “disgust” / “sadness” / “fear”, or even more challenging, facial recognition: tagging photos with names of people. When defining your use case, think about the why: make sure you are solving the right problem with your use case.
  2. A data set containing a reasonable number of images of the type you want to understand, and the corresponding classification labels (categories).
  3. The right expertise to configure, implement, train and evaluate the Deep Learning model. A combination of statistics, programming and experience with Machine Learning is needed to be able to apply Deep Learning properly.

These are critical foundations that need to be considered when exploring if Deep Learning will actually have a reasonable chance of solving your problem and worth your time. If the above circumstances apply to your situation, the answer is YES, it is worth exploring Deep Learning.

Further requirements, feasibility, and the quality of the results, all depend on the complexity of the use case and the data set. Is the data set representative and sufficiently large? How many images does the model need to be trained on? What type of algorithm is the best fit? Do we have enough processing power on our laptop or pc? What efforts and investments are needed and what do you get when you are done? To answer these questions, it is necessary to first explore the use case and data set in a feasibility study. Such a feasibility study is necessary to be able to understand the conditions for success and whether the potential value is worth the investment. The outcomes can guide you towards a potential next step.

The above-mentioned top three basic requirements were in place for the use case presented by of Stichting Natuur & Milieu:

  1. The use case is a textbook Machine Learning problem. We labeled image data that needs to be categorized, improving the measurements performed by the citizens. The problem that the use case is trying to solve is to achieve a more reliable water quality score, which has clear room for improvement as can be concluded from the difference in the expert and citizen scores.
  2. The data set contains three high-quality photos of local waters per site, a subset of these is properly labeled by an expert – these reliable labels can be used as the ground truth. The data contains lots of measured characteristics that contribute the target label of water quality. The data set is remarkably good in terms of size, number of labels, completeness and structure: perfect to run through a model and predict the measurements on without lots of preprocessing.
  3. Expertise from the KPMG data scientists is combined with the domain expertise from Stichting Natuur & Milieu.

KPMG decided to explore the next questions on applying Deep Learning to the images of Stichting Natuur & Milieu in a three-week feasibility study conducted by two data scientists. The specific Deep Learning algorithm type that was chosen was a Convolutional Neural Network, most commonly applied to analyze visual input. We implemented multiple data augmentation techniques to especially overcome the large bias in the data set. Despite this effort, we still encountered the common problem of overfitting.

Facing the overfitting problem

Overfitting refers to the problem of training a model to such an extent that it stops generalizing knowledge and starts “memorizing” exact training examples instead of learning from the patterns in the images. The models fit the training data too well, including inherent variations, irrelevant features and noise. The result is a too complex model that performs extremely well on the training data, but when it needs to classify data that it hasn’t seen before, performance is poor. The opposite of overfitting is underfitting: when a model is too simple to catch the complexity of data. Models that are overfit or underfit are often not useful for real-life situations. See Figures 7 and 8 for graphical representations of these concepts.

C-2021-2-Smits-07a-klein

Figure 7a. This figure shows a trained model of the cats and dogs example data set. The dots are the photos of cats (red) and dogs (blue), the green line resembles the model, and the colored areas indicate the model predictions: if a dot is located above the green line, in the blue area, the model predicts that the photo contains a dog. [Click on the image for a larger image]

C-2021-2-Smits-07b-klein

Figure 7b. On the left an example of underfitting: the model is too simple to grasp the complexity, it just classifies all animals lower than a specific height as cats. In the center we see a model that is optimized: not too simple, not too complex. Although the training still has some errors, the test error is minimized and the general pattern is grasped. On the right we see a model that is overfitting: the model is too complex to generalize the pattern. Although there are zero training errors, the model won’t be able to perform well on examples it hasn’t seen before. [Click on the image for a larger image]

C-2021-2-Smits-08-klein

Figure 8. Balancing out training rounds (“epochs”) and model complexity to find the best fit and prevent under- or overfitting. During training it is important to keep searching for this optimum, for instance by measuring your training error and comparing it to the error on your independent test set. [Click on the image for a larger image]

Some examples to help understand the concept:

  • Huskies being classified as wolves because the model concluded that the best indication of a picture containing a wolf is snow in the background. Perfect example of not representative training data where all wolves had a snowy background (see Figure 9).
  • Predictive maintenance use cases, where high model accuracy can be achieved because the data set is so biased towards the “normal” (no indication of failure) scenario. The model is almost always correct, except in the extraordinary situation that a failure is about to happen, which obviously is the exact situation that needs to be recalled.
  • Overfitting happens a lot without Machine Learning too. You might have heard clauses like “This soccer player never missed two penalty kicks in a row” or “My grandmother has been smoking her whole life and became 100”.
  • And metaphorically:
    • Underfitting: Try to kill Godzilla with a fly swatter.
    • Overfitting: Try to kill a mosquito with a bazooka.

C-2021-2-Smits-09-klein

Figure 9. Another way to understand whether your Deep Learning model is overfitting or not performing the way it should although the errors show positive results, is visualizing the features that are used by your model. The above well-known example shows the features (pixels in this case) used to classify photos into huskies or wolves. Although the prediction is correct in 5 out of 6 test images, the problem becomes apparent what we look at what the model is basing its classification on: whether there is snow in the background or not ([Ribe16]). [Click on the image for a larger image]

Anyone who ever tried Machine Learning or Deep Learning has encountered overfitting: you either actively try to prevent overfitting, you find out that your model has overfitted when you evaluate its performance or you unaware of the overfitting problem and have never tried how it performs on examples it hasn’t seen before. Following the analogy with the human learning, we would call this respectively “conscious competence”, “unconscious competence” or even “unconscious incompetence”.

To decrease the chance of, or amount of, overfitting, several options are available. These can be categorized in two types:

  • Enlarge or/and improve the input data set (label more data / augment data / balance the data / …)
  • Apply techniques to prevent overfitting (regularization / dropout / less complexity in the model architecture / …)

Key to those methods is awareness of overfitting and implementing a way to detect overfitting. This starts with separating your data set into a separate training, validation and test set, allowing for an independent measure of the performance of the trained model. When your model performs significantly better on your training set than on your test set, you know some form of overfitting has taken place. We also saw in the husky versus wolf example that a very informative way to understand how a Deep Learning model classifies images is visualizing the features that the model found to base its conclusions on [Ribe16].

During the feasibility study, the above approach was followed and the data (106 sites, 318 photos in total) was separated in three independent data sets. With these three data sets we performed the actual model training (training data set) and evaluated the general model performance, like overfitting (validation and test data sets). Although 318 photos for these very visible features was a reasonable number for starting to train a first model, the small scope of the data left no room for errors and a significant imbalance in the data set caused a large bias. 80% of the 318 images had “none or minimal” as the answer for the duckweed categories. The remaining 20% was split into the other three options, leaving only a few dozen examples in these categories. When training a CNN on this data, it became really good in predicting the majority category (“none or minimal”) and very bad in the other categories. Hence the model was severely overfit.

Therefore, we applied data augmentation to enlarge the training set and reduce the bias, using a non-complex model with fewer “free parameters” – we even asked for more expert labeled examples – the model kept overfitting before a reasonable test error was achieved. This is shown in Figure 10, where we see a strong indicator of overfitting: training accuracy getting much higher than the validation and test accuracy. One of the visualizations that most clearly indicates how the model is overfitting in our case, is called a confusion matrix. In this visual, all predictions of all categories are mapped in the data set categories. In the confusion matrix in Figure 11, it is clearly visible that all predictions point to the largest category: the best solution that the model could find was predicting all images as being part of this category, reaching an accuracy of 60%. The model simply hasn’t encountered the other categories enough to understand that these are different categories.

C-2021-2-Smits-10-klein

Figure 10. Accuracy plot from the feasibility study on the duckweed categories, where all training rounds (“epochs”) are validated against the training, validation and test set. It is clear that the results for the training set keep increasing, while on the separate validation and test set, the accuracy has reached its maximum very early at 60%. This is a clear sign of overfitting. [Click on the image for a larger image]

C-2021-2-Smits-11-klein

Figure 11. Confusion matrix from the feasibility study: all model predictions for the test set of 88 photos point to the “None or minimal” category, giving the highest achievable model accuracy of 60% for the independent test set. The model clearly is not able to generalize knowledge about the four categories, but it is overfitting. [Click on the image for a larger image]

Conclusion

As we have seen, exploring Deep Learning for a defined use case is in many ways dependent on the data set. Most measures that improve performance of applied Deep Learning models are aimed at making sure that the model learns to draw the right conclusions during training – which all come down to preventing overfitting. As you may have noticed, we have not discussed the comparison of different types of Machine Learning models and how to choose the best one. We would definitely advice getting guidance on what type of model is suitable for your use case . But for most use cases, it will not be worth it to go to great lengths to find the strongest model, as the role that data plays is so much larger. Andrew Ng mentioned this during one of his Stanford lectures: “It’s not who has the best algorithm that wins. It’s who has the most data.” ([Ng13]).

One of the major fallacies seen today in the data science field is the blind focus on Machine Learning. The means become more important than the ends and people end up solving the wrong problem. The basics we propose start with the right use case: what problem do I need to solve and can I apply Machine Learning to my use case? These are just the very first questions one needs to answer before even attempting to train the first model. The uncertainty whether the use of Machine Learning works for a given a use case is inherent in data science projects, and it is the reason why we always suggest a phased approach to data science: start exploring in a feasibility study, then move towards a proof of concept, then implement the model in a Minimal Viable Product, pilot this Minimal Viable Product with key business users and only when all phases are successful, move towards “productionalizing” the model. Between every phase, consider the next steps, lessons learnt, the effort required and the business value it may bring before you decide to continue with the next step.

In our feasibility study for Stichting Natuur & Milieu, the basics were in place, and we explored the case. We took several measures to prevent and overcome overfitting. These did not solve the imbalance and hence the overfitting remained. Therefore, the results of the image classification model that was trained were not yet good enough to replace expert judgement. Although the data set was remarkably good, for the use case at hand it turned out to be insufficiently large and too biased to properly train a model. Future steps to improve this are aimed at balancing and enlarging the data set on one hand, and improving the data quality on the other, for instance by making the answer options more distinct and giving more guidance on how to take the photos.

Our feasibility study showed that it is possible to apply Deep Learning to the images from the water samples program. However, in order to get results that are better than the citizens’ input, the data set needs to be improved first. This is taken into account for the 2021 program as a first step, before re-assessing the next steps.

Notes

  1. In this article we will not go into image recognition use cases such as object localization (drawing a bounding box around one or more objects in an image), object detection (combines localization and classification), image segmentation (selecting the pixels in the image that belong to a specific object) or other more advanced types.

References

[Kriz17] Krizhevsky, A., Sutskever, I., Hinton, & G.E. (2017, May 24). ImageNet Classification with Deep Convolutional Neural Networks. Communications of the ACM, 60(6), 84-90. Retrieved from: https://papers.nips.cc/paper/2012/file/c399862d3b9d6b76c8436e924a68c45b-Paper.pdf

[Ng13] Ng, A. (2013, March). Machine Learning and AI via Brain simulations [PowerPoint slides]. Stanford University. Retrieved from: https://ai.stanford.edu/~ang/slides/DeepLearning-Mar2013.pptx

[Ribe16] Ribeiro, M.T., Singh, S. & Guestrin, C. (2016). “Why Should I Trust You?”: Explaining the Predictions of Any Classifier. Proceedings of the 22nd ACM SIGKDD International Conference on Knowledge Discovery and Data Mining (pp. 1135-1144).

[Russ15] Russakovsky, O., Deng, J., Su, H., Krause, J., Satheesh, S., Ma, S., . . . Fei-Fei, L. (2015). ImageNet Large Scale Visual Recognition Challenge. International Journal of Computer Vision, 115, 211-252.

[SN&M20] Stichting Natuur & Milieu (2020). Waterkwaliteit van de kleine wateren in Nederland nog steeds onvoldoende [Summary of 2020 “water samples” program]. Retrieved from: https://www.natuurenmilieu.nl/wp-content/uploads/2020/10/NatuurMilieu_Watermonsters2020_samenvatting.pdf

The secrets of successful data-driven organizations

This article describes the current Data & Analytics maturity level of organizations in The Netherlands and more specifically the unique selling points of “leading” organizations from a Data & Analytics perspective. This brief article comprises a summary of the report “The importance of a data mature organization in the new reality” ([KPMG21]) that was released in June 2021, and was the result of a Data Maturity survey conducted among approximately 100 organizations.

The three key elements of the success of Data & Analytics Leaders are:

  1. having and following a solid Data & Analytics strategy
  2. being able to measure and to track the value that Data & Analytics brings
  3. having a fully committed senior leadership that is helping to drive the data analytics transformation.

We will address and analyze these key elements that support the acceleration of data-driven transformation in more detail in this article.

Introduction

Over more than a year, Covid-19 has created and shaped new challenges for all organizations. Most people and organizations overcame the initial stress situation and proved how flexible we as human beings can be to adapt to new situations. Living in the pandemic for over a year, many got “used” to “a” or “the” new reality, but at the same time the real “new normal” is still awaiting us. One thing is for certain, things will never go back to the way they were. We should expect substantial developments in leveraging data and new technologies in the years ahead. Several of these developments within and between organizations as well as in entire sectors will therefore be strongly data- and technology-driven.

KPMG has conducted a survey to obtain an understanding of the Data & Analytics maturity and associated outlook of organizations in the Netherlands. We were eager to see where Dutch organizations stand today and what key steps are being taken to further accelerate their data-driven transformation. KPMG experience was combined with results of the “Data & Analytics Maturity Survey” conducted between October – December 2020. The online survey garnered responses from around 100 selected participants representing the full range of industry sectors, organization sizes, functional specialties, and tenures to be able to provide a holistic view of the data analytics maturity in the Netherlands.

For this survey, KPMG’s strategic pillar framework for data-driven organizations was used to structure the questionnaire. We have been using and improving this framework in our expanding Data & Analytics practice.

Becoming more data-driven is one of the key priorities for most organizations nowadays. We see that truly data-driven organizations are growing faster than the traditional ones ([Gott17]). This leads to serious investments of almost every organization improving its Data & Analytics capability and looking for a way to drive value based on Data & Analytics.

However, as a result of the survey we conducted in the Dutch market, we still see that most organizations in the Netherlands still have a relatively low Data & Analytics (D&A) maturity. Figure 1 shows that only 21% can be perceived as data-mature organizations and 79% of respondents are relatively immature in their data-driveness. This is mainly because scaling up successfully with Data & Analytics does not only implicate investing in technology, infrastructure and hiring a few data scientists. Becoming a data-driven organization also requires changes in (data) culture, operating model and realizing “real” business value through use cases. Getting these three conditions right appears to be very challenging for many organizations.

C-2021-2-Plato-01-klein

Figure 1. Overall Data & Analytics Maturity in the Netherlands. [Click on the image for a larger image]

Connecting business demand with Data & Analytics supply

The last 5 to 10 years, organizations have focused mainly on investing in the fundamental conditions for becoming a data-driven organization, with particular attention to the technical data foundations, building up an ecosystem of technology/knowledge partners, creating awareness on the importance of Data & Analytics internally and embarking on a few initial Data & Analytics experiments. It became clear that the Data & Analytics transformation is a long and complex journey that requires attention to multiple or all required preconditions. To be able to bring things together and construct a view on what you need to do when, we currently see that many organizations have or are working on a specific data strategy.

In the survey, 65% of the respondents mentioned they have developed such a data strategy outlining the role and importance of Data & Analytics within the organization, establishing the roadmap for what’s ahead. However, value is only created when the strategy is effective and executed in the right way. This is easier said than done. Given the lower overall Data & Analytics maturity levels, we can assume that for some respondents this still mean that they have just started with their strategy and vision document.

To be able to structurally drive value from Data & Analytics, multiple pieces of a complex puzzle need to come together. The question is how to define and select the right use cases that can both deliver value and help further structure and improve the elements of the “supply side” to accelerate the realization of future use cases. To support organizations in grasping this, we work with the strategic pillar model for a data-driven organization (see Figure 2).

C-2021-2-Plato-02-klein

Figure 2. The key strategic topics of KPMG’s Seven Pillar Model. [Click on the image for a larger image]

These are the key strategic topics to becoming a data-driven organization:

Vision & Ambition: How should data contribute to our long-term strategic business goals (e.g. operational excellence, customer interaction, new products/services, etc.)? The data strategy should also indicate which initiatives should be launched to help realize strategic business goals via Data & Analytics use cases. Based on this Vision & Data Strategy the following seven pillars can be defined and implemented:

  1. Organization & Governance: What target operating model and which assignment of responsibilities are required to successfully execute and support our data initiatives?
  2. Ecosystems: What are our key partners with whom we need to work together to be able to drive value through Data & Analytics, and how to collaborate on this topic? This can be both technology partners, but also for example suppliers/buyers in your value chain.
  3. Risk & Compliance: Can we identify the relevant external and internal regulatory and compliance requirements and data-related risks (e.g. data privacy, data retention, data residency, etc.), and reduce or eliminate these risks by applying (ethical) controls? Addressing this pillar in the right way and ensuring the quality of and transparency in the data and algorithms used can increase the trust in our data analytics.
  4. Operational Excellence: Which principles should we apply to organize our data analytics efforts in a stand­ardized, simplified and efficient manner?
  5. Customer & Growth: Which Data & Analytics customers should we involve to tailor our use cases for the right target audience? And how can we ensure that the value can be reaped of the data analytics initiatives for their growth?
  6. Architecture & Technology: Which technologies do we need to leverage for a flexible and scalable data platform to support the development and deployment of our Data & Analytics use cases?
  7. Data-driven People & Culture: How to create a data-driven culture and data literacy across the workforce (with both internal and external resources)?

Using this model helps organizations to better understand their strong and improvement areas with respect to the crucial aspects of Data & Analytics. Providing the right focus on the aspects that are currently your weakest link is vital to be able to make progress.

C-2021-2-Plato-03-klein

Figure 3. Maturity of respondents’ organization for each of the strategic pillars. [Click on the image for a larger image]

Figure 3 shows the maturity of the respondents for each of the strategic pillars. The first observation is that the maturity on the Architecture & technology pillar is much higher than all others. For instance, 70% of respondents indicated that appropriate data tooling is in place across the data value chain. This outcome is in line with our own observations, as our clients have typically made significant investments in Data & Analytics technology and are now trying to reap the benefits. In addition, the Data-driven people & culture and Ecosystem pillars score relatively high. We have been advising several organizations on making the organization more data-driven and are struggling to interpret this response. Undoubtedly, steps are taken to hire specific expertise on data science (People & culture pillar) and on setting up relations with parties active on the supply side, like cloud and AI solution providers (Ecosystem pillar).

However, based on experience we can say that many organizations still need to strengthen their competencies when it comes to adapting a truly wide-spread data-driven culture. The term “data literacy ” is relevant in this context. In a data-literate organization, all employees, not just data scientists, need to be able to assess the data, find meaning in the numbers and derive actionable business insights from it. Furthermore, many organizations are still in the early stages of integrating data analytics into their operational processes, and ecosystems are rarely extended on the business side. This is confirmed by our survey, which shows that use cases are still in an emerging stage. In our opinion, the inconsistency in the maturity between the “demand” and “supply side” is one of the main challenges that organizations have to address, as it is illustrative for the gap between investments and returns.

Key challenge of generating business value with Data & Analytics

There is another challenge for bridging the gap between investments and returns. This is the ability to measure the value of Data & Analytics initiatives. This brings both opportunities as well as challenges for organizations on their journey to become digital leaders. Overall, only 45% of organizations can measure the value of Data & Analytics. Given the huge investments being made within Data & Analytics, this is quite a surprising outcome. However, if we look at the “Mature” and “Leading” organizations among the respondents, the situation is very different: 95% of them measure their data-driven value. Being able to prove value helps to unlock new investments more easily, which might increase the gap between leading and emerging organizations even further. The ability to measure value is an important success factor and can metaphorically be seen as the required “compass” for organizations to keep going in the right direction for their transformation. Among the organizations that do measure value, we see that 64% managed to increase their revenues by more than 10% in the last 12 months. Most of these organizations are the digital leaders in developing and applying Data & Analytics solutions.

Three key pillars to help ensure Data & Analytics initiatives deliver business value

We see three key pillars that help ensure that Data & Analytics initiatives deliver true business value, which can be tracked in an efficient way:

  1. “Business value first” principle
  2. Clear governance and supportive tooling
  3. Specific methods for D&A value tracking

Ad A. Any initiative must result in tangible business value – and this principle needs to be followed throughout the lifecycle of each initiative. From the first moment of business case development, all initiatives must be linked to one or more of the agreed business KPIs. This includes specifying concrete drivers through which business benefits will be reached, agreeing on the general cause-effect relationship, and making explicit any assumptions. Inputs from both the business and technology owners are required.

Ad B. Secondly, a clear governance should span the process from business case setup to benefit validation, involving stakeholders across the business. Successful governance setups involve stakeholders from both the technology and the business side of the organization. Here, accountability lies with a single person (typically the business owner) and a process with clear roles and responsibilities is in place for defining and approving initiatives, as well as tracking and validating benefits once launched.

Ad C. Lastly, given the specific nature of Data & Analytics initiatives, linking technical KPIs to true business value typically requires specialized methods tailored to the use case. Depending on the use case, various methods can be used to track the value of data analytics applications in dynamic environments.

The important elements of leading data-driven organizations

The results of our survey show that “Leading” and “Mature” organizations among the respondents are not only the most advanced in setting up their Data & Analytics operations, these organizations have also been able to achieve the highest returns on investment with their Data & Analytics endeavor. They are achieving the best results both in terms of revenue increase and cost reduction through Data & Analytics initiatives.

We analyzed what makes these organizations stand out from the pack and identified that the key differences are in the strategic, organizational and cultural elements that are established within their organization. It may not come as a surprise, but the three concrete elements that came out on top for leading Data & Analytics organizations are:

  1. A solid and clear data strategy as a starting point
  2. Full commitment from senior leadership
  3. Value management and benefits tracking throughout the use case lifecycle

Ad A. Defining, communicating and embedding a solid data strategy is one of the first steps in becoming at a Mature level, since the entire 100% of Leading and Mature organizations have defined theirs compared with only 60% of the less mature organizations. In our experience, when developing a data strategy, a critical success factor is a clear focus on the connection between the business demand and Data & Analytics supply (i.e. technology, capabilities and processes to execute Data & Analytics use cases effectively). The elements that need to be addressed in such a data strategy are mentioned earlier and are visualized in the Seven Pillar Model.

Ad B. One element where we see a significant difference between leaders and laggers is related to the organization’s data culture: a leadership that is fully committed to Data & Analytics initiatives and is stimulating data-driven decision-making throughout the organization, is a key foundation for success. However, stakeholder awareness and commitment are difficult elements to influence, but a critical prerequisite for increasing digital maturity and data literacy. Strong data culture is built on the definition of a data strategy, strong commitment to an investment scenario, embedding the right capabilities and effective communication across the organization.

Ad C. Lastly, the key challenge for organizations to be able to measure the value of their data analytics initiatives. As mentioned, there is strong divide between high and low maturity organizations, since only 32% of low maturity organizations manage to measure value. We believe that successful Value management encompass the end-to-end value chain, from the definition of the (expected value of) use cases to the monitoring of the actual benefits.

Conclusion

“Leading” organizations in Data & Analytics do a few things different and better than lagging organizations. The key three elements are working with a solid data strategy, measuring the business value that Data & Analytics brings, and having fully committed senior leadership that helps drive and trigger the change. Measuring value will help find the right direction in complex transformation processes of organizations.

The complexity of becoming a more data-driven organization, as we see it, is not the complexity of one of the elements or pillars (for example, technology , people, organizational design, etc.); it is mainly related to the need to work holistically and simultaneously on many topics and challenges. As KPMG we have been working in a holistic and integrated manner with our clients over the last years to help drive their Data & Analytics transformation by supporting our client to make the necessary progress on all the strategic pillars of a data-driven organization.

The authors thank Asher Mahmood, Senior Manager Data & Analytics at KPMG, for his assistance in writing this article.

References

[GottT17] Gottlieb, J. & Rifai, K. (2017, December). Fueling growth through data monetization. McKinsey survey. Retrieved from: https://www.mckinsey.com/business-functions/mckinsey-analytics/our-insights/fueling-growth-through-data-monetization

[KPMG21] KPMG (2021, June). The importance of a data mature organization in the new reality. Retrieved from: https://home.kpmg/nl/nl/home/insights/2021/06/a-data-mature-organization-in-the-new-reality.html

From data to decisions

The combination of Prescriptive Analytics methodologies and risk management, stress tests and scenario analysis has the potential to help companies make robust optimal decisions. The starting point of successful Prescriptive Analytics projects are forecasts that leverage a systematic identification and quantification of risks. This is the input for mathematical optimization models that reflect all the trade-offs in place and that are aligned with the goals of an organization. This article describes challenges and best practices in Prescriptive Analytics.

Introduction

Decision making is at the heart of a competitive advantage for any organization. Despite heavy investments in big data, business intelligence and forecasting systems powered by machine learning and econometrics, 41% of companies struggled to turn their data into strong business decisions in 2020 ([Benn21]). While most organizations acknowledge the need to become more data-driven, many organizations are failing to achieve this goal. Only 48% of organizations expect a significant return from investments in data & analytics within the next three years ([Goed18]). How can organizations translate data into optimal decisions and generate value from their investments?

C-2021-2-Ferrini-01-klein

Figure 1. Development of Data Analytics maturity levels. [Click on the image for a larger image]

Over the past 10 years, large organizations as well as SMEs have been on a journey from Descriptive to Predictive Analytics. Descriptive Analytics enables subject matter experts to generate insights by applying data exploration and visualization tools to historical data, using dashboards and business intelligence reports. Predictive Analytics is a set of methodologies and tools that automatically identify patterns in historical data, whether the data is internal to an organization or acquired from an external source to generate forecasts.

Unfortunately, Predictive Analytics is only a (single) step towards optimal decision making for organizations. To take decision making to the next level, organizations need to implement Prescriptive Analytics methodologies into their data strategy. While Prescriptive Analytics is a relatively new term, the idea of Prescriptive Analytics is nevertheless rooted in operations research, a discipline established in the 1930s. Prescriptive Analytics combines forecasts (predictive analytics) with mathematical optimization and decision sciences to identify the best course of action. Prescriptive analytics can provide two kinds of output: decision support, which provides recommendations for actions, or automated decisions, in which case the algorithm executes the prescribed actions autonomously (see article “Becoming data-driven by mastering business analytics” in this edition of Compact). The transition to Prescriptive Analytics constitutes a tremendous opportunity.

What are the challenges in implementing Prescriptive Analytics solutions?

To improve decisions that are based on forecasts, you must overcome three challenges:

  1. understanding the limitations of forecasting techniques;
  2. reaching the right decision is hard even with the right forecasts;
  3. addressing the scarce availability of mathematical optimization skills.

Understanding the limitations of forecasting techniques

Historical accounts on pandemics date back to as early as 430 BC (Typhoid fever in Athens) and 165AD (Antonine plague). Pandemics have been a recurring threat over the course of history. Could a Machine Learning system been expected to accurately predict the exact timing of COVID 19 and its extent? Probably not. However, the risk of pandemics is always lurking. Despite that, many forecasting systems employed across several industries and domains, from SCM and distribution to finance, have not been taking into account the risk of such a rare event. As it was the case for pandemics, forecasting systems might not factor in other risks (geopolitical, adverse weather, …) that have not manifested themselves in the timeframe covered by the historical data analyzed.

COVID19 has once again reminded us of the limitations of the mathematical methodologies (econometrics, machine learning) that mine historical data (time series) and generate forecasts. Time series analysis is unable to cope with the inductivist turkey ([Russ01]). Bertrand Russel’s turkey inferred by induction, collecting several days of observations, that it would be fed every day in the morning. The turkey grew strong confidence in this assumption as more data was accumulated day after day. The animal expected to be fed, like any other day, but on Christmas Eve, the turkey had his throat cut instead. As in Bertrand Russel’s parable, forecasts based on Time Series Analysis can be accurate only as long as we can expect the economic and competitive environment to remain in line with its representation in the data. This is a very strong assumption that very often is proved wrong. Ultimately, predicting the future is impossible. Decision making needs to acknowledge this and deal with uncertainty.

How do we improve decision making?

Reaching the right decision is hard. Even with infallible, 100% accurate forecasts of the future, making the right decision would still be a challenge. It is in fact necessary to correctly formalize the decision-making process as a mathematical optimization problem leveraging skills hardly available in the organization.

Formalize decision-making processes as mathematical optimization problems

In order to translate forecasts into decisions, you need to formulate a decision-making process as a mathematical optimization problem characterized by:

  • an objective function that expresses the goal that the organization wants to achieve (e.g. improve client satisfaction, maximize revenues);
  • a set of constraints (e.g. production capacity).

A common use case for mathematical optimization is route planning, where an algorithm needs to define the best path to travel from city to city, for example from Zürich to Lausanne. Even such as a straight-forward, day-to-day problem can have multiple formulations with a different set of goals and a growing set of constraints (see box “Route optimization”).

C-2021-2-Ferrini-02-klein

In fact, while compiling a mathematical optimization problem might seem trivial at a first glance, the task is instead of daunting complexity: the definition of an objective function and a set of constraints that are able to capture all the existing trade-offs in an organization requires deep domain expertise. This is true, for example, in production planning: you might very likely not simply ensure that all your resources are fully utilized in a production plan, but also ensure that there is enough time to perform preventive maintenance while guaranteeing fair employee schedules and taking account individual holiday plans.

What is a probability distribution?

A probability distribution defines the probability that a variable could take a specific value. The probability distribution of an unbiased coin flip says that there is a 50% probability of getting heads and 50% probability of getting tails. Likewise, a distribution could describe product net sales or costs of raw materials, quantifying the likelihood of forecasts and scenarios.

C-2021-2-Ferrini-03-klein

Increase availability of mathematical optimization skills

Once the mathematical optimization problem has been formalized, it is time to tackle it by selecting and applying the right mathematical approach. The success of Prescriptive Analytics projects depends on the availability of a broad set of methodological expertise, including mathematical optimization techniques such as classical mathematical programming ([Boyd04]), meta-heuristics ([Luke13]), evolutionary algorithms ([Eibe03]) and reinforcement learning ([Sutt98]). There is no silver bullet. The choice of the right mathematical optimization technique can depend on many factors, such as:

  • whether some decision variables may or may be not restricted to take discrete values. A discrete decision variable is, for example, the number of boxes that should be shipped in the upcoming week to a store. On the other hand, working with bulk shipments generally translates into non-discrete decision variables as quantities can assume any fractional value;
  • whether all the decision variables can be considered deterministic or whether they should be modeled as a probability distribution (see box “What is a probability distribution?”);
  • the mathematical formulation of the objective function and constraints.

Successfully tackling mathematical optimization problems does not only require strong mathematical foundations, it also requires extensive practical experience. Understanding the impact of business assumptions on the computational complexity of a mathematical optimization problem is extremely demanding. It is often the case that a slight change in a set of constraints could increase the computational time required to solve the mathematical problem from a few seconds to days if not weeks.

At the same time, it is often the case that mathematical optimization problems incurred in many business domains are not well-behaved: slight changes in the business assumptions might lead to drastic changes in the recommended action: including considerations on the sensitivity of optimal solution adds an additional layer of complexity.

Ensuring the availability of a broad portfolio of methodological expertise requires a focused hiring strategy and the ability to acquire professional profiles with vastly heterogeneous backgrounds, outside of the standard data science curriculum.

How can you make more reliable decisions?

As the future cannot be predicted, how can you cope with the uncertainty in your forecasts? How can you manage risks potentially not reflected in your data and not acknowledged by your forecasting systems? In the aftermath of COVID 19, financial and operational resilience have become key strategic priorities. Resilience is the ability to continue providing products or services when faced with shocks and disruption. How can organizations position themselves to, not only respond to disruption, but also take advantage of disruption to quickly develop a competitive advantage?

In addition to the two fundamental cornerstones, mathematical formalization and related skills availability, as discussed in the previous section, this type of resilience requires rethinking the existing decision-making processes by:

  • creating a comprehensive model of a business;
  • explicitly quantifying the impact of risks;
  • augmenting historical data with subject matter expertise.

Creating a comprehensive model of a business

Value drivers trees are an essential framework to develop a rigorous and comprehensive representation of a business. Modelers can structure the objectives and KPIs of an organization, and visually understand all the trade-offs in place. Value drivers trees support mathematical modelers in the definition of optimization problems and in the formalization of target functions and constraints. They facilitate reasoning regarding which external variables have an impact on a business and assist in the selection of all the data sources that should be leveraged by mathematical models. Furthermore, Value drivers trees helps stakeholders identify risks and design risk mitigation strategies.

Value drivers tree

Value drivers trees break down the goal (e.g. maximizing net earnings) into financial and non-financial metrics, and help decision makers and mathematical modelers understand all the factors that affect a decision, the trade-off and the impact of each choice and scenario.

C-2021-2-Ferrini-04-klein

Explicitly quantify risks

Probabilistic models are an approach where uncertainty is explicitly quantified as a probability distribution: in probabilistic models, input variables are expressed as probability distributions. The output of a probabilistic model is also a probability distribution ([Koll09]). The development of probabilistic models requires higher investments than the econometrics and machine learning forecasting techniques traditionally employed in the industry. At the same time, probabilistic models are often more computationally expensive. They do, however, also have several advantages.

Firstly, probabilistic models provide a modelling framework that allows disruptive factors such as pandemics, adverse weather conditions and abrupt changes in the economic environment to be included. Rare events and catastrophe modelling become part of the day-to-day decision-making process, which in turn contribute to more resilient forecasts.

Secondly, probabilistic models can be used to generate scenarios. Scenarios analyses allow the evaluation of the financial impact of risks and disruption. With scenario analysis, stress testing becomes an integral part of financial planning and operations. They are also an indispensable tool to evaluate tactical decisions (e.g. shutting down a manufacturing plant for maintenance) and strategic decisions (e.g. renegotiating supply agreements with business partners).

Furthermore, the structure of probabilistic models can match the value drivers tree of an organization and they are inherently interpretable by decision makers. Forecasts can be broken down along the value drivers tree. This enables decision makers to easily understand on which financial and operational assumptions forecasts are based. Interpretability boosts trust and adoption.

Probabilistic model: example

What is the expected ice-cream demand at a local food stand? One approach to this demand estimation problem is by:

  1. looking at historical data in order to estimate ice-cream demand on sunny days;
  2. analyzing historical sales data in order to estimate demand on rainy days;
  3. accessing a number of weather forecasts services in order to gauge the risk of rain. The risk of rain is in itself a probability distribution as, very likely, the different weather forecasts will give different estimates.

The output of this model will be a probability distribution that characterizes the demand of ice-cream, taking into account the risk of rain.

C-2021-2-Ferrini-05-klein

Probabilistic model: use-case

KPMG has helped an international distributor of industrial goods set the optimal price for different products in their portfolio. In order to achieve this goal, KPMG developed a probabilistic model that matched the value drivers tree of the organization and comprised of three modules:

  1. A module that estimated the demand for a product at a specific price point with a Gradient Boosted Trees, a Machine Learning regression methodology ([Frie01]). The Machine Learning module leveraged internal data (historical sales as well as historical promotional data) and external data, including macroeconomic indicators (leading indicators on trade finance as well as on the availability of capital to finance CAPEX investments).
  2. An econometric module that estimated transportation and storage unit costs given historical data and macroeconomic indicators (e.g. crude oil price).
  3. An optimization module that – given demand volume estimates and other key optimization parameters (e.g. estimated lead times and transportation costs) – identified the optimal shipping route and calculated the total transportation and storage costs. The problem was formulated as a Mixed Integer Linear Problem (MILP) ([Vand15]).

The optimal price was ultimately selected as the price that maximizes total revenues less transportation costs.

C-2021-2-Ferrini-06-klein

Augmenting historical data with subject matter expertise

Key inputs can be estimated from historical data that you already have or external data that you obtain from a third party. However, data might be biased or not paint the full picture. Historical data can, however, be augmented: internal and external subject matter experts (SMEs) in your organization, who are in direct contact with your business, have a great wealth of information that could be beneficial. SMEs may in fact have engaged clients and suppliers in conversations or perhaps had access to market surveys, competitive research or news articles. All such information is extremely valuable:

  • It can augment and complement the information that can be extracted from historical data.
  • It can be used to inform the generation of scenarios.
  • Subject matter experts’ opinions can be integrated with insights from historical data.

The opinions of Subject Matter Experts (SMEs) should be collected from the entire organization with a transparent, auditable workflow. While collecting opinions, it is mission critical to keep track of the sources and the degree of confidence SMEs have on their estimates. SME’s opinions and the business assumption behind any Prescriptive Analytics model should be easily reviewed by the key stakeholders of the model and by senior management. Higher transparency in business assumptions will in turn boost trust and the adoption of the Prescriptive Analytics solution.

SME opinions

Let’s assume that an organization aims at forecasting demand based on internal historical data of sales and promotions, historical competitor prices and a proxy for the propensity of their consumers to spend. Let’s assume that the organization has verified statistically that the OECD Consumer Confidence Index is indeed a proxy that improves the forecasting accuracy of its model. Probabilistic models support the injection of subject matter experts’ opinions expressed as probability distributions: Subject Matter Experts can define their expectations for input variables (drivers) as well as for model parameters such as the coefficient that defines the relationship between the output (quantity) and a driver (CCI).

C-2021-2-Ferrini-07-klein

Conclusion

Prescriptive Analytics has the potential to boost profitability and long-term competitiveness by giving stakeholders the tools to make optimal decisions that are data-driven, but also capture the knowledge of SMEs. Prescriptive Analytics enables decision-makers to rethink their decision-making processes: integrating risk management in the day-to-day decision-making process by explicitly modelling risks with probabilistic models leads to more robust decisions that boost the financial and operational resilience of an organization, and position it to not only respond to disruption, but to take advantage of disruption to develop a competitive advantage.

References

[Baye63] Bayes, T. (1763). LII. An essay towards solving a problem in the doctrine of chances. Philosophical Transactions of the Royal Society of London 53, 370-418.

[Benn21] Bennett, M. (2021). Data Literacy: What Is It, And Why Do Executive Teams Need To Care? Forrester.

[Boyd04] Boyd, S., & Vandenberghe, L. (2004). Convex optimization. Cambridge: Cambridge University Press.

[Eibe03] Eiben, A. E., & Smith, J. E. (2003). Introduction to Evolutionary Computing. Springer.

[Frie01] Friedman, J., Hastie, T., & Tibshirani, R. (2001). The Elements of Statistical Learning. Springer Series in Statistics.

[Goed18] Goedhart, B., Lambers, E.E., & Madlener, J.J. (2018). How to become data literate and support a data-driven culture. Compact 2018/4. Retrieved from: https://www.compact.nl/articles/how-to-become-data-literate-and-support-a-data-driven-culture/

[Koll09] Koller, D., & Friedman, N. (2009). Probabilistic Graphical Models: Principles and Techniques. MIT Press.

[Luke13] Luke, S. (2013). Essentials of Metaheuristics. Lulu, second edition, available for free at http://cs.gmu.edu/~sean/book/metaheuristics/

[Russ01] Russell, B. (2001). The problems of philosophy. Oxford: Oxford University Press.

[Sutt98] Sutton, R. S., & Barto, A. G. (1998). Introduction to Reinforcement Learning. MIT Press.

[Vand15] Vanderbei, R. (2015). Linear Programming. Springer.

How to future proof your corporate tax compliance

Increased global pressure on tax compliance is leading to a higher cost of compliance. The majority of the time and effort is spent on preparing data. Therefore, much is to be gained by applying progressive data management. For a global bank, KPMG has implemented a data management solution, the tax data factory, to automate and standardize this process. As a result, the tax compliance reporting was done quicker, with less effort and resulted in higher quality data.

Introduction

Tax compliance for any organization is critical. You need to show transparency when it comes to how the business operates by filling tax returns timely and accurately. Preparing these tax returns can be a costly and time-consuming process. Tax teams often have a short period of time to collect and assess a substantial amount of information. Especially for annual returns, often applicable for corporate taxes, this creates significant pressures for the finance and tax teams. Every decision and transaction in the past year might have an impact and needs to be reviewed with the latest local, and possibly foreign, tax laws in mind. And while this review is extremely important for the quality of the tax returns, there is a slightly hidden activity that receives more time and attention from the tax teams: collecting and preparing data.

Information required to populate a tax return comes from decisions and transactions from the entire organization. What was the total taxable profit? How much was spent on legal fees? This data is available, but it was never recorded with a tax purpose in mind. As a result, tax teams spend a huge amount of time and effort in 1) obtaining the right data, 2) reconciling and validating the quality of the data, and 3) ensuring that the data are sufficiently detailed and in a usable format.

In the past, organizations often overcame these data challenges through brute force. They assigned more people to address the problem or used an outsourcing model to move the issues outside of the organization. In a global tax benchmark conducted by KPMG, over 55% of the interviewed companies predicted an increase of their total tax head count as a result of this approach ([KPMG18]).

During the past years, we have seen organizations that adopt a different approach and address these data challenges by using automation and digital solutions. Especially in tax areas like indirect taxes, which traditionally use more transactional data, companies are investing in data technologies to support the tax teams ([Down15]).

More recently, we also see the same trend for corporate taxes. This is mainly driven by new taxes and reporting requirements, which arise from the digitization of the economy. Examples are the introduction of Digital Services Taxes (DST; e.g. Austria, United Kingdom, Turkey), BEPS 2.0 Pillar 1 and Foreign-Derived Intangible Income (FDII) in the US ([OECD20]). These new tax requirements require more and more detailed data for tax calculation. It is therefore a logical response that organizations also look at data technologies for corporate tax compliance. Using the right technology not only avoids peak periods for the tax teams, but it also saves costs, increases throughput time and can increase the quality of the returns.

Client study

To show how companies can benefit from data technology in the context of corporate tax compliance, we introduce a client case. Our client, a large international investment bank, has asked KPMG to support with its corporate income tax (CIT) compliance. In the Asia-Pacific region, this bank submits over 150 different CIT returns annually in 19 countries. The required data to prepare these returns is captured in a highly complex systems architecture spanning various accounting systems. This resulted in high costs of tax compliance. KPMG has supported this bank by lifting the burden from client’s tax teams and helping with efficient data collection, review and timely filing of the CIT returns.

The existing process of preparing tax data was highly manual, with divergent processes between different countries, and a lot of back-and-forth of information requests. Furthermore, the tax data was often received in an inconsistent format, in- or over-complete. As a result, the tax teams were often caught up in manual data activities and spent less time on value adding tax activities. We have estimated that the tax professionals were spending 80% of their time on the following activities:

C-2021-2-Duijkers-t01-klein

The underlying root-cause for this time dissipation results from poor tax data management. Tax data management refers to the strategy, technologies and available intelligent data models to extract, ingest, clean, transform, harmonize data from its source (where it’s created) all the way to data outputs which can feed directly into tax applications used by tax teams ([Zege21]).

A key element of the approach taken was to improve the tax data management by investing in modern tax technology solutions. This approach to future proof tax data management, also called KPMGs “Tax Data Factory”, is using a set of capabilities and methodologies designed to automate and standardize all activities to tax data. This ultimately leads to less time spent on non-value adding activities and increasing data quality.

Tax Data Factory approach

For this bank, as for most organizations, working with tax data is nothing new. However, their existing approach to tax data management was mainly using the most used tax technology solution globally: Microsoft Excel. When introducing the Tax Data Factory, we took a more holistic approach and matched it with technologies which are fit for purpose. The approach can be split into four successive parts:

  1. Understanding the data requirements
  2. Data collection and transmission
  3. Data validation and processing
  4. Delivery of country-specific data packages

C-2021-2-Duijkers-01-klein

Figure 1. Data flow in the project. [Click on the image for a larger image]

Understanding the data requirements

Before being able to start building a data factory, it is important to understand the data requirements. Tax data management is all about retrieving data from the source and providing it to the tax team as efficiently as possible. First, it is important to understand the connection between data supply and data demand. This understanding comes from workshops with IT, tax department and KPMG teams. The goal of these workshops was to understand which information is required, which underlying data is needed and in which system this data is stored.

During this exploratory process, it became clear that operating in multiple jurisdictions contribute to the complexity. Different, often non-standard, reports are required in different countries and the underlying data comes from vastly different source systems. Although it is tempting to come up with tax solutions per country, it is important to look for the common denominator in the data. Eventually, the common elements will contribute to standardization and efficiency of the overall approach. Our team was able to define a common data structure that can facilitate the specific requirements for different countries, while being as generic as possible.

Data collection and transmission

Even when having a design for a common data structure, the required data is still spread across several different systems. In close collaboration with the IT team, agreements must be made about the collection and transmission of this data. This agreement contains topics such as the scope of data (which tables, columns, and filter to apply), timing (when to share the data), format (file format and naming convention of the files that are shared). Making solid agreements and documenting the details is crucial for having efficient tax data management processes.

Data validation and processing

The core of this data management approach is the Tax Data Factory. The Tax Data Factory is the technology that performs the data processing and transforms the source data to the final outputs, using the common data structure. For the bank, this was achieved by using the Microsoft Azure cloud and native Microsoft data technologies.

The Tax Data Factory uses a modular and flexible setup. The source data enters the data factory and flows through different levels as depicted in figure 2. These different levels, each with a distinct purpose, are connected with automated pipelines which transfers data from one level to the next. This entire process is coordinated by a central control room that orchestrates and monitors the data processing.

C-2021-2-Duijkers-02-klein

Figure 2. Tax Data Factory. [Click on the image for a larger image]

On the Raw Data level, source data is brought in directly from the bank and stored in the data factory. Initial validations are performed to ensure that the correct data (for example, the sum of general ledger transactions reconciles with the corresponding trial balance amount) is received.

Since not all data is received in a format which is fully ready for processing, some cleaning steps are performed before data ends up on the Cleaned data level. These cleaning steps such as removing empty lines, handling of row counts and formatting, are generically designed such that they can be reused for data from different systems.

As data originates from different systems, the data needs to be transformed before it fits into the common data structure. This happens in the Common Data level where system-specific logic is applied to the data. These data transformations range from the renaming of columns, to combining different data elements into a single new one, to bringing the data in the same level of granularity.

Once the data is put into a common data structure, it can be used to generate the specific tax reports which together form a data package. This logic sits in the Application Data level. A major advantage is that this logic only has to be set up once and not per source system, because it uses the common data structure as a source.

Finally, all transformations are centrally coordinated from a control room. In this control room, it is known which common data elements are required for each required output, how they are generated based on which cleaned data, and which source data is required and how it needs to be cleaned. This all happens in a highly automated environment with appropriate checks and balances to ensure the data quality.

Delivery of country-specific data packages

Using the data from the “application data” level, a specific data package consisting of several standardized reports is generated. The local tax legislation requires the tax team to evaluate a specific set of transactions and details in order to determine the tax position. Therefore, the difference in tax legislation results in a different information demand per country (for example, which transactional details should be included for specific deductible expenses). This highlights a key challenge for corporate income tax automation: how are local requirements incorporated based on country-specific legislation in a standardized approach?

One way of providing all information required by the local tax teams using a standardize approach, is to simply provide all available tax data to all the countries. However, this results in unnecessary work for both the central team preparing the data and the local teams using the data. As a result, the tax team has to manually manipulate the data in order to make it relevant for each specific country, which is something we want to avoid in the first place.

A better solution is the concept of a “Common Chart of Accounts”. The common chart of accounts is a set of generic ledger accounts, combined with a classification of whether the information of an account is required in a certain country. By connecting an organization’s ledgers from the various systems to this generic ledger, the common chart of accounts, it becomes possible to treat these ledger accounts in a standardized way. So regardless of the source system, it is possible to generate country-specific reports in an automated way. These data reports only contain the required information per country which drastically reduces the information shared. Therefore, the focus can be on analyzing the data which adds value to the tax compliance process.

Results of the project

Challenging the traditional and established ways of working is never easy and requires commitment and interest from the stakeholders to make it happen. Given the scale of the task at hand, implementing a data factory requires initial costs and investments by the teams months before the go-live date. It includes financial funding, resources to be assigned to the development team, connections to be established with the local tax leads, and training and on-boarding of the new way of working among local teams.

Nevertheless, the result of implementation of the tax data factory has brought significant improvement to the efficiency of the corporate tax compliance processes. By replacing the manual data activities with automated data transformations, the following benefits have been achieved:

  • Reduced turnaround time
  • Increased standardization
  • Increased data quality
  • Recured time and efforts required in data preparation
  • Increased focus on analyzing only the tax-relevant data

Reduced turnaround time

The turnaround time required from collecting the source data to sharing the correct information with the tax teams has decreased significantly. As a result, the tax team has more time to analyze the data or to file an earlier declaration. To make this concrete: for one of the large countries, the lead time went from 6 to 8 weeks to less than 2!

Increased standardization

The tax team receives a single standard data package with the relevant reports for each country. These reports contain data, which can originate from difference source systems in a standard layout. The standardization of these reports enables the optimalisation of the downstream tax activities such as preparing the tax adjustments.

Increased data quality

To ensure the quality and consistency of the tax data, automated checks and reconciliations are embedded in the data processing. These automated checks reduce the risk of manual mistakes, e.g. manual copy paste errors, and will alert the tax team of any data quality issues.

Recured time and efforts required in data preparation

The time and efforts required to perform the data preparation activities has significantly decreased. For the bank, the new approach resulted in a 20-30% reduction in required hours spent, in the first year alone. This shift from manual tasks to automation has a significant impact on reducing the cost of compliance.

Increased focus on analyzing only the tax-relevant data

The standardized reports only contain data that is relevant for the specific country for which it was generated. By using a combination of the common data structure and the common chart of account, a significant reduction in the volume of data which is being shared is achieved in comparison to the traditional approach. Therefore, the tax team can focus their time and activities on analyzing the data that adds most value. For example, for one of the countries, the data volume has decreased by 80% and still contains all the required data.

Lessons learned

Reflecting on the entire project, we have formulated a few recommendations and best practices to apply along the way for similar implementations of tax data management solutions.

  • Include all the responsible stakeholders in the data discovery and data understanding processes. This will ensure good alignment and understanding of what your data management solution can and will deliver;
  • Closely align the results with the needs of the tax data factory users. Keep these users informed and iterate over the results until you can be confident that the results will be adopted successfully by all users;
  • Design the data model with the right balance between standardization and country-specific requirements;
  • Build the data model in a modular way to allow for the addition of ERP systems or data requirements, without the need for large structural changes of your model. A common data structure is essential to achieve such a modular, expandable solution;
  • Establish a central process that allows you to adjust the results in accordance with country-specific regulatory requirements. In this project, this flexibility was achieved by leveraging the KPMG Common Chart of Accounts.

Conclusion

Like many emerging technologies, data management is just beginning to have a significant impact on the tax function. Although tax data management is not yet adopted by most organizations, there are already significant benefits to be gained for early adopters. The use case in which a global investment bank implemented a tax data factory as part of corporate tax compliance illustrates these benefits. This automated and standardized approach to managing data has shortened lead times, increased data quality and saved costs. Additionally, the tax team can add more value to the organization by spending more time on providing insights and optimizing processes and systems. A Tax Data Factory facilitates a more data-driven and value-added future for Tax departments.

References

[Down15] Downing, C., van Loo, L., Zegers, A., & Haenen, R. (2015). Technology, Data and Innovation – Essentials for Indirect Tax Management. Tax Planning International Indirect Taxes, 13(9).

[KPMG18] KPMG (2018). A look inside tax departments worldwide and how they are evolving: Summary report: Global Tax Department Benchmarking. Retrieved from: https://assets.kpmg/content/dam/kpmg/xx/pdf/2018/03/global-tax-benchmarking-report.pdf

[OECD20] OECD (2020). Tax Administration 3.0: The Digital Transformation of Tax Administration. Retrieved from: https://www.oecd.org/tax/forum-on-tax-administration/publications-and-products/tax-administration-3-0-the-digital-transformation-of-tax-administration.htm

[Zege21] Zegers, A., & Duijkers, R. (2021). Tax Data Management: The hidden engine for future-proofing tax management. Retrieved from: https://meijburg.nl/nieuws/article-hidden-engine-future-proofing-tax-management-0