


Over the last few years, we have seen a trend in the financial statements audit towards data analytics involving a 100% analysis of the population, thus allowing audit teams to focus on the highest areas of risk whilst maintaining an efficient and effective audit. An innovative type of data analytics is predictive modeling, including Regression Analysis, which links historical analysis to future performance using statistical models – an immensely powerful tool.
Introduction
In this article we briefly explain the key concepts of regression analysis and further elaborate on how it works as part of a financial statements audit, covering the key elements of the following phases: Planning, Model Building and Audit Interface. In addition, we illustrate how these key elements have been put in practise in KPMG’s Regression Analysis tool (eAAT – Account Analysis Tool) and related methodology. At the same time we summarize the advantages of using regression analysis as part of a financial statements audit as well as certain constraints when putting it into use.
Regression Analysis: Key Concepts
Regression analysis is a statistical technique used to predict data based on past relationships between two or more variables. The historical relationship between these variables (one dependent variable – the item we are auditing – and one or more independent variables) is mathematically defined and then applied to the current year’s dependent variable. The expected values of the current year’s dependent variable are then compared to the actual values, and the significance of the differences is evaluated.
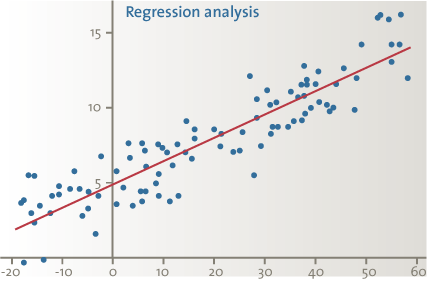
Figure 1. Regression analysis.
Example
A practical example involves a regression analysis to predict the sales of a chain of 52 restaurants.
- The dependent variable (Y axis) is the monthly sales of each restaurant;
- The independent variable (X axis) is the monthly amount of meat in kgs purchased by each restaurant; this information is provided by the sole meat supplier for the chain of restaurants;
- Based on historical data of the last three years, a “straight line” (regression equation) is determined mathematically to be the “best fit” between the dependent (sales in euros) and the independent variable (purchased amount of meat in kgs);
- This regression equation based on historical data is used to predict the current year’s monthly sales of restaurants;
- The predicted monthly sales of each restaurant of the chain is compared to the actual monthly sales;
- The significance of the variances is statistically evaluated and based on the “audit interface” (see below). Then the amount or required remaining audit evidence (if any) is established so as to ascertain that a material misstatement does not exist relating to the completeness, existence and accuracy of the recorded sales.
How Does It Work?
Regression analysis as part of a financial statements audit consists of three phases: Planning – Model Building – Audit Interface.
Planning
The planning phase consists of two types of activities:
- Determining the dependent variable (e.g., sales in euros) and the independent variable(s) (e.g., purchased amount of meat in kgs). Note that there are three types of independent variables (“predictors”): financial internal predictors (e.g., cost of sales), non-financial internal predictors (e.g., number of clients) and external predictors (e.g., consumer price index, purchased amount of meat in kgs).
- Collecting data: both historical data for use in developing a regression model, and the current year’s data.
KPMG’s approach
KPMG’s regression analysis tool (eAAT) involves a centralized approach, both to predefine the accounts for which the use of regression analysis is suitable per industry, and to collect data for the external predictors.
Note that the reliability of the external predictors is tested centrally. For the internal predictors, the auditor needs to perform additional procedures to determine the reliability of the data.
Model Building
This phase includes entering the data and having a tool build the statistical model, produce the predicted values and perform a comparison with actual values.
KPMG’s approach
A regression analysis tool (eAAT) has been built centrally. This tool determines the regression model that gives the “best” predictors considering correlations between an account (e.g., sales) and its pre-defined predictors (e.g., cost of sales).
Audit Interface
This phase consists of two activities:
- Checking the relevance and the quality of the model;
- Determining the remaining audit evidence needed.
KPMG’s approach – checking the relevance and quality of the model
KPMG’s approach includes both a quantitative and a qualitative assessment to determine the relevance and quality of the model.
The quantitative assessment involves determining the confidence level ensuring the account does not contain a material misstatement. The lowest level amongst all months of the current period is taken and scored on a scale from A (highest) to F (lowest). The confidence level provides information about the predictive accuracy of the regression model.
The qualitative assessment involves determining the correlation coefficient of each predictor and rating of the quality of the source of the predictors.
- The correlation coefficient is a statistical calculation that measures the strength of the relationship between the independent and dependent variables (varies between 0 and 1) and provides information about the relevance of the model.
- The quality of the source of the predictors is rated as follows:
- Lower: internal financial indicators from same sources (e.g., revenue and trade receivables, inventories and cost of sales)
- Moderate: internal financial data from different sources (e.g., revenue and cost of sales, trade receivables and trade payables) and internal non-financial data (e.g., number of employees, capacity data)
- Higher: external data (e.g., inflation, interest rate, stock market index)
A qualitative assessment score is determined on a scale from 1 to 5, using predefined tables combining the correlation score and the type of predictor score.
eAAT subsequently combines the Quantitative and the Qualitative scores for each account and provides a final evaluation of the audit evidence obtained through the regression analysis. The scales are as follows: None, Little, Moderate, High, Extensive.
KPMG’s approach – determining the remaining audit evidence needed
The amount of audit evidence needed for substantive testing is generally determined by both the evaluation of the Inherent Risk (Significant, Not Significant) and the degree of reliance on Internal Controls (Control Risk Higher, Control Risk Lower). By means of another module of eAAT (that is evaluating the client’s journal entries for the period under audit by comparing actual account combinations to expected combinations), the Not Significant Inherent Risk is further refined as follows:
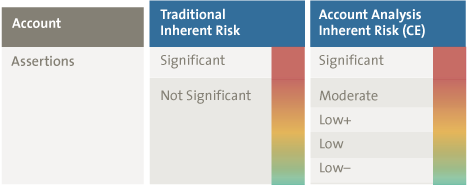
Figure 2. Refining Non Significant Inherent Risk.
Figure 3 shows how the level of audit evidence obtained from Regression Analysis (i.e., None through Extensive) is used to determine the remaining audit evidence needed for each assertion (Completeness, Existence, Accuracy and Valuation, Ownership, Presentation).

Figure 3. Determining the remaining audit evidence needed. [Click on the image for a larger image]
Figure 3 demonstrates that the refining of the Not Significant Inherent Risk combined with strong (High, Extensive) evidence obtained from Regression Analysis results in quite a number of cases where no further testing of internal controls nor performance of additional substantive testing is required. If the evidence from Regression Analysis is less strong (Little, Moderate), testing of internal controls needs to be further considered but the amount of additional substantive testing is reduced.
Also note that if the Inherent Risk is evaluated as Significant, specific substantive testing procedures need to be performed to address the significant inherent risk of error.
In our practical example (prediction of the monthly sales of a chain of restaurants), the regression model proved to be of a high quality: a confidence level of 95% (except for 4 restaurants/months – see below), a strong correlation (87%) and a reliable source of external data for the independent variable (a schedule of delivered amount of meat in kgs per month/restaurant provided by the sole meat supplier). Based on this, it was decided not to test the internal controls relating to the sales process and to limit additional substantive testing to a follow-up involving the 4 restaurants/months with a confidence level of less than 95%, three of which were related to the completeness of sales and one to the existence of sales.
Additional testing was performed, with the following satisfactory results: for the three restaurants with a potential understatement of sales, it was determined that it related to new restaurants that were started up in the month, with one exception: for the one restaurant with a potential overstatement of sales, it was determined that it referred to an establishment located on the marine parade of Ostend for the month of July. For this period the additional sales were accounted for by the increased sales of ice-cream due to the exceptionally warm weather.
As a result, we were able to limit the effort to audit the completeness, existence and accuracy of the sales of the chain of restaurants to the following actions: collecting the historical and current monthly sales data (per restaurant) from the financial system and agreeing the data to the general ledger; obtaining and reviewing the annual delivery statistics (amount of meat per month/restaurant in kgs) provided by the meat supplier for the sake of reasonableness; running the regression analysis and determining the quality of the model; following up on the four exceptions. The key realized efficiency was that we did not need to test the design and operating effectiveness of the sales process and of the general IT controls on the applications supporting the sales process. In addition, the client was keenly interested in our innovative way of performing an audit as well as the possibilities of implementing a regression analysis on sales as a monitoring measure by himself.
Pros and Cons of Regression Analysis
We have demonstrated above that regression analysis can be an immensely powerful tool, enabling the auditor to perform a very effective and efficient financial statements audit. If you have a model that is sufficiently strong (High, Extensive), you just need to test the completeness and accuracy of the internal data (predictors), upload the data, and evaluate the results of the regression analysis; no further testing of internal controls nor performing of substantive testing is required.
Given the above, combined with the fact that regression analysis is not a new statistical technique, the question arises why this technique has not been used from the beginning. The answer to this question resides partially in a number of constraints when putting it into use: client suitability and complexity.
Client Suitability
Not all clients are suitable for regression analysis as part of a financial statements audit. The following conditions need to be in place:
- Existence of a repetitive transaction volume: regression analysis is not likely to be useful in audits of clients who have a very low volume of transactions or when most of their individual transactions are substantial (e.g., real estate developers, investment holding companies);
- Availability of sufficient suitable predictors that can be used to develop regression models: it may be a key challenge to identify predictors that result in a strong (High, Extensive) model!
Typical models based on internal predictors are:
- Cost of sales to predict Revenue
- Number of customers to predict Revenue
- Revenue to predict Trade Receivables
- Head count to predict Salary Expense
- Machine hours to predict Revenue
The above models may be less strong (e.g., because only internal predictors are used) but can still effectively contribute to a reduction of the remaining audit evidence needed.
Stronger models are likely to be available in the case of trading and/or production companies that have a limited number of suppliers of goods/raw materials, and for which the supplier(s) can produce delivery statistics. Some examples of such external predictors are:
- The delivery statistics of nickel (provided by the nickel refinery) to predict the revenue from nickel trading;
- The delivery statistics of malt (provided by an organization representing the malt farmers) to predict the revenue from beer sales;
- The delivery statistics of cacao butter (provided by the main supplier of cacao butter) to predict the revenue from chocolate sales.
Note that for the identification of both internal and external predictors, getting back to the “value chain”, an old auditing technique that Dutch auditors used to be (or are) quite familiar with, may turn out to be an excellent source of inspiration.
- No new clients or clients with significant business or system changes from prior years;
- Excluding PIEs (public interest entities) and high risk engagements.
Complexity
Another major constraint is the fact that many auditors are not or not sufficiently familiar with statistics and therefore reluctant to use regression analysis as part of a financial statements audit. An additional constraint is the fear of relying on inappropriate models (e.g., autocorrelation, non-normality).
Conclusion
Regression analysis represents a very powerful tool to reduce the amount of time spent on evaluating internal controls and/or performing substantive testing procedures for accounts with a negligible inherent risk, thus allowing auditors to focus on the higher risk areas.
The challenge is to identify suitable predictors that result in a strong model combined with efforts to build sufficient regression analysis competence within the audit practise and … to get cracking by running a number of pilots and creating a number of success stories.