


Decisions are increasingly being made on the basis of business cases built on quantitative data rather than qualitative factors and assumptions. In practice, organizations are displaying a growing appreciation of fact-based (bottom up) methods of gaining insight into business processes: facts to value. Data-mining tools, nowadays known as business intelligence tools, provide greater opportunities for using this approach effectively. The key to success lies in analyzing data, combining data and generating added value as a result. Data mining is being used for an increasing number of purposes, such as analysis of debtor payment and customer buying behavior, forensic investigations, resolving duplicate payments, process analysis and financial auditing. This article describes some successful examples of data mining, and its added value.
Introduction
In effect, data mining is nothing new. It has long been used to provide specifics about a variety of information issues: a good example of this is market research. With the emergence of data-mining solutions, often known as Business Intelligence (BI) solutions, how data is being used by government and industry has become a popular topic. A previously published study by KPMG ([KPMG09]) indicates that the business community is beginning to recognize the benefits and perhaps the need for data mining. Leading system vendors like SAP and specialized consultancy firms are offering ever more ready-made solutions, enabling businesses to perform any type of analysis by means of plug and play. The above KPMG research reveals that about thirty percent of companies surveyed use BI solutions. In addition, most companies that do not use business intelligence solutions plan to implement such solutions within three years. Nevertheless, it should be noted that BI use is still in its infancy. BI remains primarily the domain of a few (IT) specialists, and it is not often approached in a structured way.
The use of ERP systems and the growth toward “single instance” ERP gives companies access to massive volumes of data. As a result, an analysis of the aforementioned company data is extremely useful in providing insight into how the performance of business processes can be smoothly and effectively improved. The data can be used for multiple purposes, including:
- improving business cases
- increasing data quality and integrity
- optimization of working capital
- fraud detection
- improving supply chain and inventory management
- standardizing and optimizing use of the ERP system
- more effective risk management by providing insight into the risks that a company runs
The government has also discovered the potential of data analysis. Recently, the Netherlands State Secretary of Education sent a letter to the Netherlands House of Representatives indicating a desire to investigate fraud involving the subsidy for childcare costs. The investigation meant establishing a line of communication between two government offices: the Netherlands Tax Administration and the Netherlands Employee Insurance Administration (UWV). Data mining makes it possible to obtain information required for the purposes of running the investigation in a very efficient and effective manner.
Data mining is also a promising and efficient way for companies and auditors to detect possibly unauthorized transactions that fall outside predefined criteria, effectively performing what the current market also identifies as continuous monitoring / continuous auditing. This may be used to keep track of overdrawn credit limits, percentage reductions in sales orders, timely delivery of orders and the volume of credit notes per day. Auditors are also beginning to see increasingly more opportunities for use. In some instances, they are already running software (plug-ins) in their customers’ transaction systems, or else periodically downloading data to detect irregularities over specific time frames. In this way, auditors can be certain about such financial audit items as the “Order to Cash” and “Purchase to Pay” audit cycles, as well as the corresponding balance sheet entries.
Figure 1 shows an example of a report for an external auditor. The report shows the extent to which purchase orders result in goods received and payment. It also reveals anomalies and unfulfilled purchase orders.
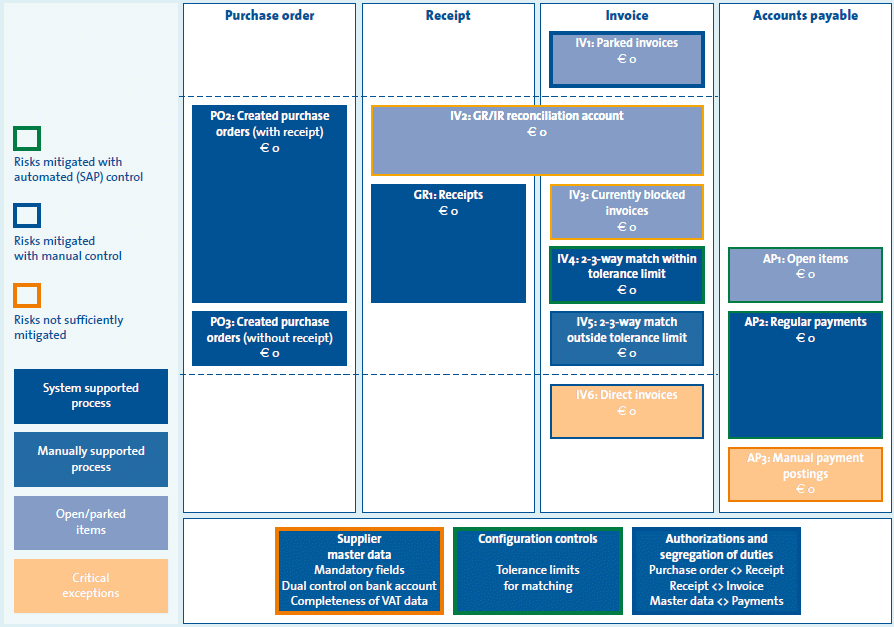
Figure 1: Example of a report for the external auditor
Successful practical examples
Successful practical examples relate generally to the analysis of fraud cases, process optimization, support for the financial audit and analysis of working capital. Cases involving analysis of working capital, the financial audit and investigation of fraud will be described in order below.
Analysis of working capital
In the current economic climate, companies are paying attention to the management of working capital items. Often companies manage their working capital based on figures in management information reports. There are common indicators for working capital:
- Days Payable Outstanding (DPO): The weighted average of the difference between the actual payment date and invoice date
- Days Inventory Outstanding (DIO): The weighted average between the value of the inventory and the turnover (average daily use) of that inventory
- Days Sales Outstanding (DSO): The weighted average of the difference between the actual receipt of payment and the invoice date
The driving factors or the process performance indicators that affect working capital are often unclear, due to insufficient detail in the available management information. Using the available details in ERP systems makes it possible to determine DPO, DIO and DSO based on system design and actual transactions, enabling the relevant elements of all process steps to be included.
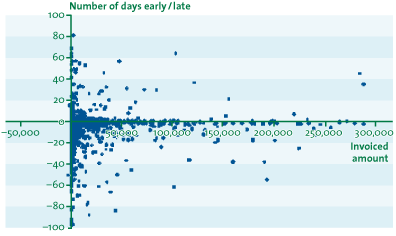
Figure 2: Example of a graphical representation of payment behavior
There are typical findings that result from performing a detailed analysis of working capital:
- The actual payment date for invoices received deviates from the agreed payment period and the company’s policy concerning payment deadlines. For example, invoices are sometimes (or, in a few cases, are often) paid earlier than the payment due date, and discounts for early payment are not (or, are not fully) utilized.
- Orders take place without requiring the use of preferred suppliers or the prices and the payment terms agreed in framework agreements.
- The actual receipt of payment differs from the agreement made with the customer. Although ERP systems often have the capacity to undertake an automatic escalation for invoices long overdue, follow-up of outstanding invoices is often late and sometimes never initiated.
- The frequency of invoicing is often not based on analysis. With a payment period of thirty days from the end of month, it makes no difference for the timing of payment if invoicing occurs at the beginning or end of a month. For a payment period of thirty days after delivery, it is understandably important to immediately send the invoice along with the delivered item.
- In determining the minimum required inventory, no (or, insufficient) consideration is given to the characteristics of customers or suppliers. For example, the knowledge that a supplier tends to deliver orders early, late or incomplete is not used in determining the minimum required inventory, or high minimum product inventories are maintained for product groups with low sales.
Performing these initial technical analyses will provide all the necessary “food for thought,” even if discussing their results with process owners and executives can be confrontational. It is nevertheless important for such discussions to occur, as they enable these stakeholders to identify specific issues and actions for improvement. The ultimate goal is the optimization of working capital (and its “cash-to-cash cycle time”), thereby minimizing interest costs.
Financial audit
Introduction
Due to the impact of the Sarbanes Oxley Act and increasing scrutiny on corporate governance, public companies have come to place a great deal of emphasis on internal controls. The external auditor also uses the internal control procedures in the audit approach, partly because manual substantive procedures often entail high costs. If there are deficiencies in internal controls, a system-oriented approach, focusing on internal control over financial reporting, cannot always be applied. In such a case it is necessary to conduct substantive work, including additional sampling. Data mining may provide an enormous savings potential in this respect. Using data mining with large databases opens a wide range of possibilities for obtaining audit information about the entire population of data. In auditing jargon, this method is also known as Computer Aided Audit Techniques (CAATS). A number of tools already exist to support it, such as ACL and IDEA. These tools have been used in auditing for years by a number of enthusiastic office experts.
However, experience has shown that the use of CAATS is not always successful. Its implementation and its impact on auditing have been described in another Compact article ([Brou07]). Some relevant observations are:
- Analyses often produce extensive anomaly reports (list work).
- Completion of anomaly reports is time intensive.
- The relationship between the analysis and audit evidence is often unclear.
- A cost-benefit analysis for data analysis is often lacking because there is no clear relation to the audit approach.
Despite the above observations, the added value of CAATS for the financial audit is clear. The question now is how more added value can be created. Recently, auditors have acquired the necessary experience to be able to improve the effectiveness of the CAATS approach. Successful audits that use data mining have a number of similarities. They involve the following:
- A clear link between the data analysis to be conducted and the audit approach, with the appropriate analysis for each audit cycle based on the audit approach.
- Providing positive assurance rather than primarily reporting anomalies.
- Optimal use of system centralization, with the data being tested from one central location, making it possible to increase efficiency.
- Reuse of developed queries in subsequent years.
The approach to auditing the financial statements using data analysis or CAATS shall be further elaborated based on these principles. Below is an illustration of how this approach works for an organization that recently implemented a global SAP system.
The method in practice
A Dutch multinational has a global ERP environment, which makes it possible to conduct a central audit for all the processes in “Order to Cash” and “Purchase to Pay.” The auditor identifies key factors at this multinational, including that sales orders are entered completely and accurately, and that all orders result in goods being issued. In consultation with the external auditor, the following analyses are conducted:
- Data entry
- Entry of transaction data into master tables is analyzed by testing the parameter settings (input and probability controls);
- Analysis of any changes to master data from previous periods;
- Granted access rights and function segregation, after which investigations of transactions are conducted by staff with excessive rights;
- Accuracy and completeness of the cash and product flows.
Figure 3 provides a graphic representation of the approach.
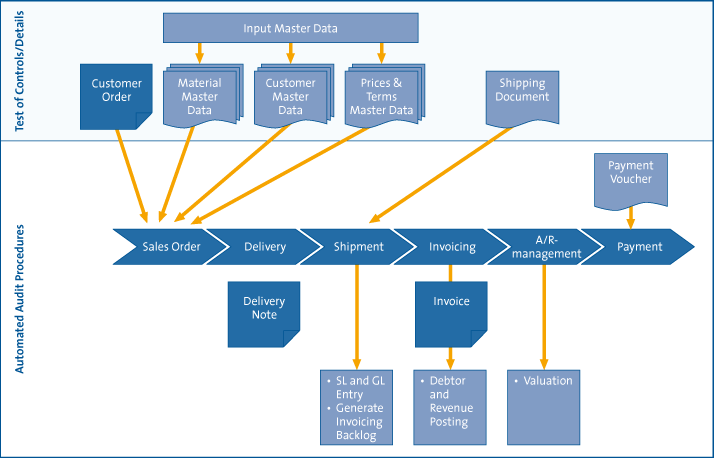
Figure 3: Schematic overview of an audit approach using data-mining tools
Below are two examples of the results of this data analysis.
Segregation of duties
In some cases, access authorizations are designed and implemented too broadly, causing conflicts in Segregation of Duties (SOD). These conflicts expose the organization to potential risks due to a failure to segregate responsibilities for tasks having control functions (e.g. the same person registering an invoice and releasing it for payment). Conducting a factual transaction-level analysis can establish whether any SOD-conflict actually has impact as well as the extent to which it exists. In the case being considered, the degree of SOD-conflict was low. In other words, although a gap in logical access rights did exist, the impact was limited. In addition, transactions could fairly easily be found and followed with little effort.
Payments to suppliers
Data mining can be used in an analysis of the central data warehouse environment to establish what is known as a “three-way match” (a reconciliation of order, receipt of goods and payment). The number of invoices not automatically matched with a purchase order / receipt of goods but ultimately payable is recorded in a standard anomaly list. However, this data analysis also reveals what the number of “good” payments was. In this manner, the anomaly list can be placed in perspective (materiality). Although follow-up was necessary in this case, it is conceivable that there are also cases where the entire list is no longer significant (not important to act on in the scope of the audit). During this analysis, a number of possible duplicate payments were detected, as well as abnormalities in the goods received, possibly due to incorrect record keeping in the warehouse.
These anomalies were then described to the audited organization for follow up. The organization worked with the external auditor to analyze the major anomalies and verify that no unauthorized transactions occurred.
The report has subsequently been completed in accordance with Figure 1.
This approach had a number of benefits for the auditor:
- The audit could largely be performed from one location.
- Data analysis could be performed in the planning phase, enabling risk analysis to be based on factual observations.
- The auditor made further recommendations in the management letter regarding the optimization of business processes. These recommendations were drawn up based on analysis of the same data used for the financial audit.
- The audit approach using data analysis was following the IT developments in the organization.
- The approach led to a higher quality audit (full scope, rather than samples).
- Based on the recommendations in the management letter, the organization has introduced a comprehensive improvement program in order to take a step toward continuous monitoring of exceptions and has tightened logical access control.
- The auditor has received positive assurance for a large part of the transaction flow.
- During this audit, the auditor was able to achieve the efficiency gains targeted in the audit proposal.
Investigation of fraud: printed discounts
A publisher issues a number of magazines. The main revenue streams for this organization are income from subscriptions and income from advertisements in the magazines. The company did not have any guidelines or controls concerning the discounts that sales staff could give advertisers. The sales staff kept a record of discounts in a custom application based on Oracle. The publisher had little documentation or knowledge regarding the programming of this custom application. During the financial audit, the auditor heard a rumor that some sales persons were granting discounts to certain advertisers with which they had developed personal relationships. In order to understand the nature and extent of the discounts given, the auditor decided to deploy a forensic data analyst.
Through interviews with staff and with the auditor, the forensic data analyst delineated the advertising process and identified the significant risks that it entailed. The forensic data analyst used data analysis to determine if significant risks actually existed in practice. The data analysis showed that over a hundred different types of discounts existed in the custom application and were actually being used by the sales staff. Furthermore, data analysis also revealed that the flow of credit notes was substantial and that invoices were often manually adjusted after the publication date of the advertisement. The above-mentioned rumor was, however, not supported by the data analysis; the amount or the percentage of discounts did not significantly vary among different sales employees.
The auditor used the results of the data analysis as audit evidence and as support for the management letter regarding the “Order to Cash” process on the advertising revenue stream. Based on the findings in the management letter regarding the advertising revenue stream, the publisher asked the forensic data analyst to assist in setting up a monitoring tool for the this revenue stream. The forensic data analyst assisted in building a dashboard for this publisher that used real-time data analysis to monitor the main risks involving the advertising revenue stream. Based on the findings in the management letter, the publisher also reduced the number of different types of discounts in the custom application. Moreover, the publisher had “application controls” built into the custom system so that credit notes had to be authorized and invoices could no longer be manually adjusted. All these measures have resulted in revenues from advertising rising by thirty percent.
Extraction and analysis process
The data analysis can be performed by using many different standard end-user solutions, ranging from Microsoft Office to advanced business intelligence solutions and monitoring tools. Regardless of the chosen technology, the user of the data mining solution must first define the analyses to be performed and then adapt them to the target environment.
Definition of the analysis is often done in a meeting or workshop with various stakeholders, such as internal audit, process owners, process managers, external auditors, and so on. The outcome of such a meeting is often a list of specifications and requirements that drives data extraction, analysis and reporting.
In adapting the analyses to the target environment (the core system), any application(s) and database(s) must also be investigated. This includes identifying which tables and fields are used, the currency in which certain fields are displayed, and whether fields include or exclude VAT.
Further, the data mining solution consists of three steps (see Figure 4):
- data extraction (downloads)
- data analysis
- reporting and follow-up
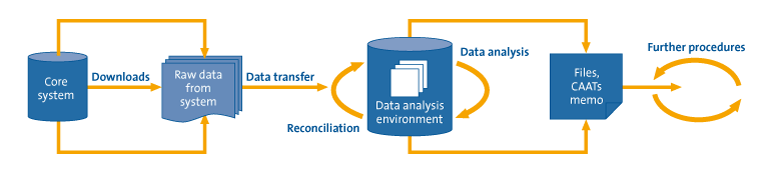
Figure 4: Data extraction process
Based on the defined analysis and its adaptation to the target environment, a data request is defined, or a selection is made of the tables and fields that should be involved in the data extraction process. In addition to the fields directly mentioned in the report, it is important to include other fields that will be needed to perform the analysis, (e.g. invoice numbers or customer numbers, so multiple tables can be linked together).
Data extraction may occur in three different ways:
- Execution of an SQL statement for the database. SQL software or database management software can be used to write an SQL statement to make selections directly from the database.
- Using the application to undertake data extraction. Most applications have a function that allows data extraction to be performed from within the application.
- Installation of special software. Several vendors have specifically written special software for data extraction on ERP systems in order to simplify the extraction process.
Each of these alternatives has its advantages and disadvantages. It is a good practice to pre-determine which extraction method is most appropriate for each analysis. An SQL statement can work very well in a single analysis and often functions very quickly, but it also requires detailed knowledge of SQL language and the database environment. Data extraction via the application also works well with a single analysis and usually requires less knowledge of SQL and the database, but the extraction is frequently launched in the end-user area of the application. This can affect the performance of the system, especially when large analyses are involved. Installing special software and using extraction profiles provides a good solution for cases involving repeated execution of standard queries. The extraction often takes place in the background with low priority, so that the performance of the system is not affected.
After the data has been extracted, import and analysis can begin. Determining the accuracy and completeness of the data extraction and importation is often overlooked, as a result of which potentially incorrect or incomplete data is used. In theory, there are several ways to ensure the accuracy and completeness of the imported data. The most powerful control involves reconciliation with a hash total. In practice, a hash total is often not available, and reconciliation must occur using standard reports, such as a trial balance.
Once these queries have been performed on the data, the actual analysis can start. The challenge then is to analyze the data and make connections so that data becomes information. The degree to which there was appropriate preparation will become apparent once the data analysis has been run and the initial results validated. The analysis often creates links between the various tables, counts and total values. If euros, British pounds and U.S. dollars are added together or no distinction is made between U.S. and European conventions regarding dates, you may experience unexpected results from the analysis. If not all key fields are recognized during the exploration of the system, linking different tables may fail or lead to strange results.
Thorough knowledge of the organization, systems and accounting procedures is a must in order to perform a good analysis. The process is laborious and requires constant attention. One example that illustrates how important it is to know the procedures is the story of a zealous assistant who, suspecting fraud, conducted an analysis of all bookings made on Sunday. This resulted in a huge list of bookings. The assistant brought it to his manager, who then had to process this list (investigating possible evidence of fraud). What was the ultimate result? Many batches were run on the weekend, and they generated bookings. The assistant’s list turned out to only contain these batches. Nothing improper was going on.
There is now extensive experience in presenting data. The management of an organization is often faced with information overload, making it difficult to distinguish main points from fine details. If the auditor provides management with a visual representation of the results of a data analysis (e.g. graphs and clear tables), the main points are, by definition, visible. By presenting management with graphs of, for example, the number of manual entries per location, credit invoices without receipt of goods, or products delivered to customers who have exceeded their credit limit, the auditor immediately gets management’s attention. Money is being thrown away. Such disruptions in the flow of money and goods requires a great deal of the auditor’s audit time, but the time expenditure can be reduced by data analysis. Employing data analysis with regard to these disruptions enables the auditor to kill two birds with one stone.
Stakeholders undoubtedly have different needs, but ultimately they always want to have the actual underlying data at their disposal, preferably by means of a management dashboard with drill-down functionality. Luckily, drill-down functionality is now technically possible, though not always available or achievable. An intermediate solution that the authors have come across in practice involves using three-layer reports: 1) complete dashboard, 2) display for each process and process step, and finally 3) detailed tables.
An auditor for an international organization compared processes at the various subsidiaries. Management was completely unaware of the differences between the various subsidiaries, which, once discovered, led to interesting discussions. Figure 5 contains an example of how to present the results to company management.
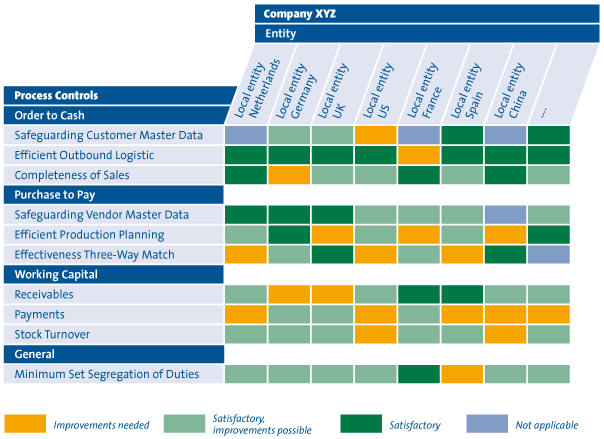
Figure 5: Example of a report for management and the external auditor
Lessons learned
The power of data mining is not only in data extraction but also in improving the interpretation and presentation of the data. The key to successful data analysis is:
- The data analyst has a thorough knowledge of the client’s systems and accounting procedures, and generates a query on the basis of which truly important data is analyzed.
- The results are presented in a clear manner appropriate to the information required by the user.
- There is seamless cooperation between the person who has knowledge of the system, the data analyst, and the user, who has knowledge of the client’s auditing and accounting procedures.
- Verifying imported data. On several occasions, practical experience revealed that work was performed on incomplete data resulting in time-consuming and unnecessary repetition. Since then, extensive verification processes have been part of the successful standard method.
Summary
The concepts of data mining and data analysis are not new. What is new is the realization that presenting the results of data analysis is key to its success.
The current state of the technology and the variety of available tools create a wide range of opportunities for converting data into added value or facts to value. Data analysis should, in our view, be a guiding principle in advising clients. Deployment of these tools (including data extraction) must be guided by customer demand and customer systems. Besides the possibilities for providing support for organizations, there is increasing interest and opportunities for employing data analysis during the financial audit. In certain cases, data analysis and data mining entail huge potential savings for the audit client due to their autonomous ability to determine the value cycle. It is also often possible to use data analysis to promote a system-based approach by determining the impact of common deficiencies in logical access control.
Literatuur
[Brou07] P.P.M.G.G. Brouwers RE RA, Brigitte Beugelaar RE RA and M. Berghuijs, Fact-finding en data-analyse, toepassingen in de praktijk, Compact 2007/3.
[KPMG09] KPMG 2009, Turning Data into Value – A KPMG Survey of Business Intelligence and Data Warehousing, 2009.