


We follow our data scientists in a pro bono engagement, where they applied Deep Learning to photos during a feasibility study. In this article we combine high level theory on Deep Learning with our experience gained during the feasibility study. We purposefully won’t dive into technical details and nuances, instead we will guide you through a pragmatic approach of your first Deep Learning experience.
Introduction
At KPMG, one of our core values reads: Together for Better. For this reason, the Advanced Analytics & Big Data team is in regular contact with the KPMG 12k program: 12.000 pro bono hours for a fair and sustainable world, demonstrating KPMG’s commitment to making a positive impact on society. This brought us into contact with Stichting Natuur & Milieu: an independent environmental organization that believes in a sustainable future for all. One of their initiatives is the yearly “water samples” program (“Vang de watermonsters” programma) ([SN&M20]). This is a science program involving citizens to map the water quality of the small inland waters in the Netherlands, such as ditches, ponds, canals and small lakes. This contributes to a good understanding of the current local water conditions, as input for the ambition to strive for clean and healthy waters in 2027. The results of the investigation are alarming. Only one in five of the waters surveyed turns out to be of good quality, the other eighty percent is of moderate to poor quality. This is an urgent call for improvements, as the pollution is causing danger to the biodiversity and our drinking water purification is becoming more and more expensive as more and diverse pollutants need to be dealt with.
We used the 12k program to conduct a feasibility study for Stichting Natuur & Milieu, which explores ways to automatically process photos from the citizen science program, and how these photos could be used to predict water quality using a Deep Learning approach. This could help use the results of the “water samples” program in a more effective and efficient manner.
During this feasibility study we faced issues that are very common when applying Deep Learning to real world image recognition use cases. It is a perfect case study to reflect upon the key questions that you are likely to face in any instance of developing Deep Learning models to solve a business problem: how do you know that Deep Learning could be the path towards your solution? And how to tackle a very common problem named overfitting that you will undoubtedly face?
In this article we will combine high-level theory with our lessons learned during the feasibility study. We purposefully won’t dive into technical details and nuances, instead we will guide you through a pragmatic approach of your first Deep Learning experience. We will introduce Deep Learning for image recognition and introduce the use case for the feasibility study, presenting three basic considerations to determine whether Deep Learning is suitable for your use case. We will introduce the problem of overfitting and discuss how overfitting can be recognized and prevented. Finally, we will offer a sensible step-based approach to Deep Learning, our conclusion and the next steps for the feasibility study.
Glossary
Machine Learning is a way to teach a computer model what to do by giving it lots of labeled examples (input data) and let the computer learn from experience, instead of programming the human way of thinking into an explicit step by step recipe (Figure 2).
Deep Learning is a subfield of Machine Learning, where the algorithms are inspired by the human brain (a biological neural network). We therefore call these algorithms artificial neural networks (Figure 3).
A Convolutional Neural Network (CNN) is a specific type of neural network that is known to perform well on visual input such as photos.
Features are numerical representations of the input data. A feature represents any pattern/object in the data that holds information that is used to making the prediction. Examples: height / weight / water color / plants / etc.
Data augmentation is the process where additional artificial images are created by applying small transformations (rotations, shifts, brightness changes) to an original image, as can be seen in Figure 4. Data augmentation is an effective way to create more (relevant) input data to train a model.
Deep Learning for image recognition
Deep Learning in the field of computer vision is about training a computer model to automatically recognize objects (for example, dogs) in images. Deep Learning promises better-than-human performance: the first contender in the ImageNet ([Russ15]) large scale visual recognition challenge that showed better performance in classifying images than an untrained human was presented in 2012 ([Kriz17]). Since then, Deep Learning applications end up in the news more than ever: from deep fakes to self-driving cars, from identifying tumors on medical images to virtual assistants like Siri.
These Deep Learning models can learn by example, similar to how the human brain learns. There are many open-source packages available nowadays that have implemented such Deep Learning models and the algorithms to train these. This makes applying Deep Learning to any problem quite easy for most people that have basic programming knowledge.
You may you wonder, what can Deep Learning do for my business?
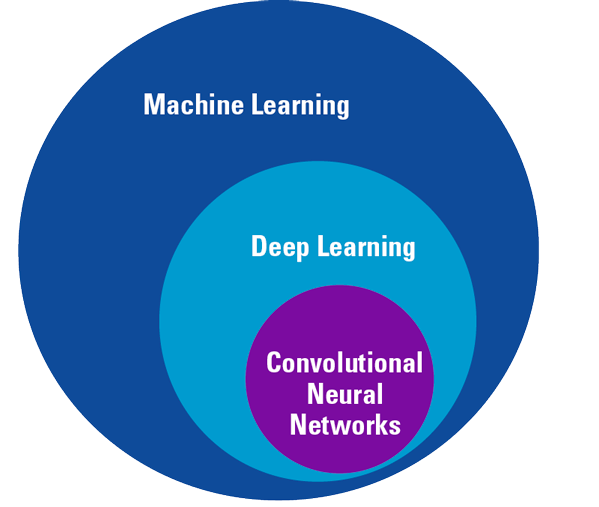
Figure 1. The Machine Learning algorithms as described in the glossary are subsets of each other. [Click on the image for a larger image]

Figure 2. A simplified schematic view of Machine Learning: after a Machine Learning model is trained based on dog and cat images and respective labels, it can take an input image it has not seen before and classify this as either a dog or a cat. [Click on the image for a larger image]
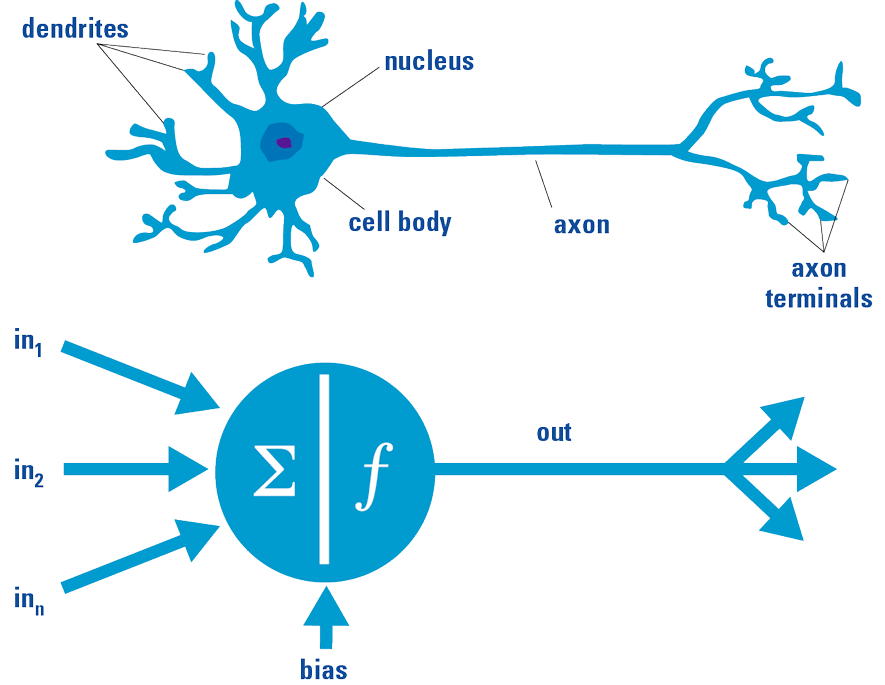
Figure 3. [Top] Simplified visualization of a biological neuron. The brain consists of a very large number of neurons, that give a living creature the ability to learn. [Bottom] Simplified visualization of an artificial neuron. Basically, it is a mathematical function based on a model of biological neurons. Both the biological neuron and the artificial neuron receive input signals, process these signals and generate an output signal that can be transmitted to other cells (image taken from: https://www.quora.com/What-is-the-differences-between-artificial-neural-network-computer-science-and-biological-neural-network). Based on this concept, an artificial neural network can be trained in a similar way the human brain learns, for instance to distinguish cats and dogs.
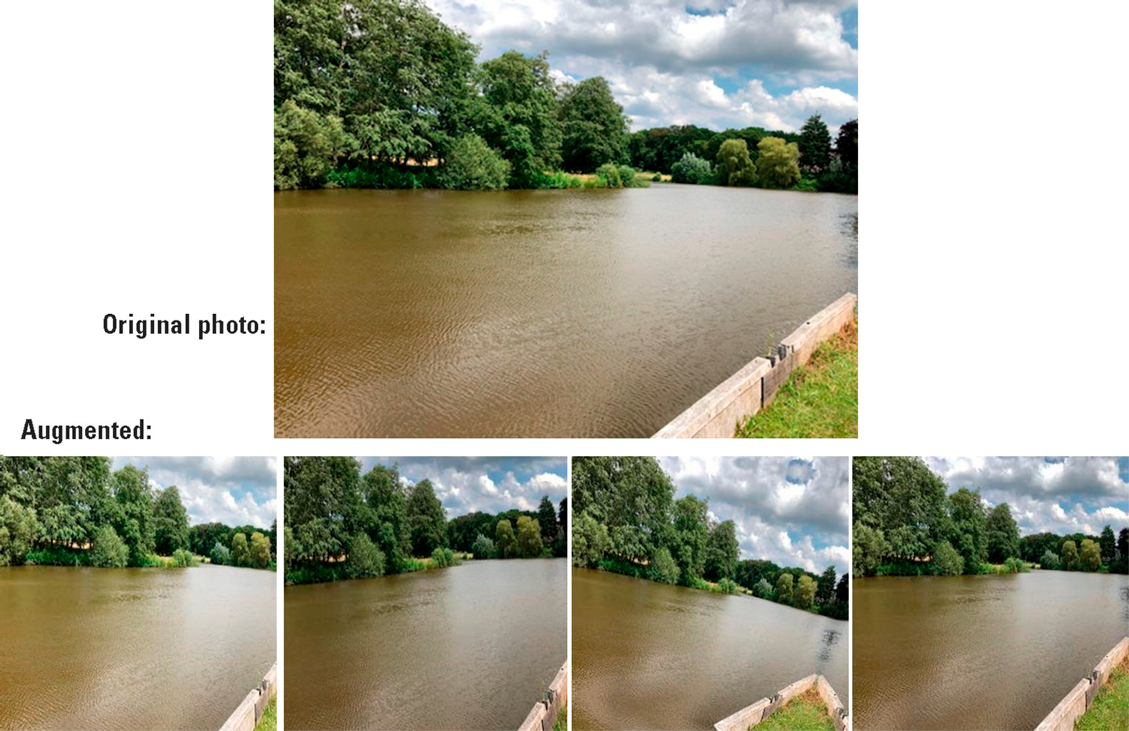
Figure 4. Examples of data augmentation from the Natuur & Milieu feasibility study. [Click on the image for a larger image]
Introducing the feasibility study use case and data set
During the second edition of the “water samples” program in 2020, more than 2600 people participated in the investigation. To validate the results and the conclusions of the program, scientists of the NIOO-KNAW (Netherlands Institute for Ecology) examined part of the sampled locations with professional measuring equipment. They confirmed the high-level conclusions from the citizens science project, but also saw a large difference between the water quality scores from citizens and experts (see Figures 5a & b for details). This is because they were able to measure the amount of nutrients in the water more accurately, which is an important stressor for water quality. The final water quality score was more finegrained for the 106 sites that were re-examined by the experts. The 2496 other sites were lacking this additional information on nutrients, leaving room for improvement on the resulting water quality labels. As the participants had taken photos of the local waters as part of the program and shared them, Stichting Natuur & Milieu was wondering whether these photos could be used to finetune the scores based upon citizen science data alone, by applying Machine Learning concepts.
During our feasibility study we received the data set from the 2020 program, containing 7800 photos of local waters (3 per site). The main objective of the study was to see if we can finetune the overall water quality score (“poor”, “moderate” or “good”). Currently, Stichting Natuur & Milieu calculates the overall water quality score by combining the measurements performed and other characteristics of the local water that were registered by the participants. An example of such characteristics is the “duckweed category”: “none or minimal”, “a little”, “a lot”, “completely full”. Lots of duckweed in the water is an indicator of bad water quality (see Figure 6).
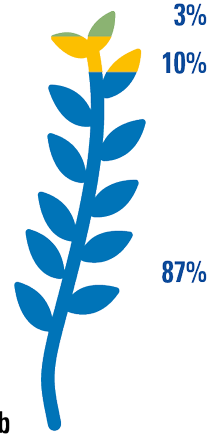
Figure 5a. Water quality results from citizens science project 2020 show that 57% of the waters investigated were labelled “poor quality”, and only 20% received the label “good quality” ([SN&M20]). [Click on the image for a larger image]
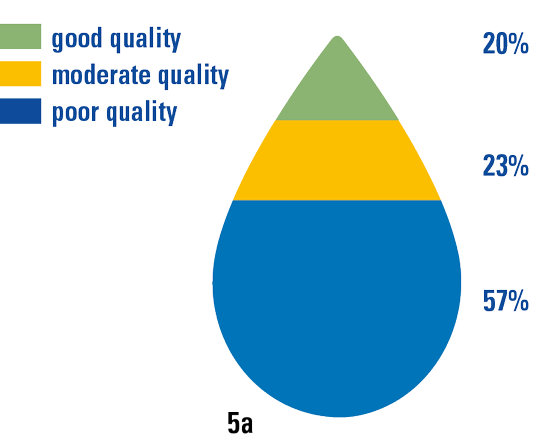
Figure 5b. The control measurement executed by experts from the NIOO-KNAW included nitrogen and phosphate levels. The results of this validation shows that experts label even 87% of the waters as “poor” ([SN&M20]). [Click on the image for a larger image]
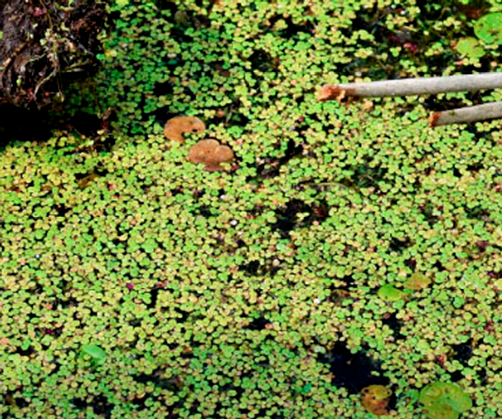
Figure 6. Duckweed in a local ditch. Duckweed covers the surface and prevents sunlight from coming through to the deeper layers. Sunlight is a prerequisite for plant growth and therefore necessary for a healthy biodiversity. [Click on the image for a larger image]
We used this supporting label as our target label; our model should take a photo from the program as input and conclude whether an expert would classify this as “none or minimal duckweed”, “a little duckweed”, “a lot of duckweed”, “completely full with duckweed” during the feasibility study. In the received data set, the number of samples per category wasn’t evenly distributed but biased towards one of the categories (“none or minimal”).
Is Deep Learning worth exploring for my use case?
In order to apply Deep Learning to images successfully, you will need the following basics:
- A use case, or a business question that can be converted into an image classification problem1. For example, assigning a category label to an image, such as “dog” / “cat”, or a bit more challenging: multiple categories like human facial expressions “surprise” / “happiness” / “anger” / “disgust” / “sadness” / “fear”, or even more challenging, facial recognition: tagging photos with names of people. When defining your use case, think about the why: make sure you are solving the right problem with your use case.
- A data set containing a reasonable number of images of the type you want to understand, and the corresponding classification labels (categories).
- The right expertise to configure, implement, train and evaluate the Deep Learning model. A combination of statistics, programming and experience with Machine Learning is needed to be able to apply Deep Learning properly.
These are critical foundations that need to be considered when exploring if Deep Learning will actually have a reasonable chance of solving your problem and worth your time. If the above circumstances apply to your situation, the answer is YES, it is worth exploring Deep Learning.
Further requirements, feasibility, and the quality of the results, all depend on the complexity of the use case and the data set. Is the data set representative and sufficiently large? How many images does the model need to be trained on? What type of algorithm is the best fit? Do we have enough processing power on our laptop or pc? What efforts and investments are needed and what do you get when you are done? To answer these questions, it is necessary to first explore the use case and data set in a feasibility study. Such a feasibility study is necessary to be able to understand the conditions for success and whether the potential value is worth the investment. The outcomes can guide you towards a potential next step.
The above-mentioned top three basic requirements were in place for the use case presented by of Stichting Natuur & Milieu:
- The use case is a textbook Machine Learning problem. We labeled image data that needs to be categorized, improving the measurements performed by the citizens. The problem that the use case is trying to solve is to achieve a more reliable water quality score, which has clear room for improvement as can be concluded from the difference in the expert and citizen scores.
- The data set contains three high-quality photos of local waters per site, a subset of these is properly labeled by an expert – these reliable labels can be used as the ground truth. The data contains lots of measured characteristics that contribute the target label of water quality. The data set is remarkably good in terms of size, number of labels, completeness and structure: perfect to run through a model and predict the measurements on without lots of preprocessing.
- Expertise from the KPMG data scientists is combined with the domain expertise from Stichting Natuur & Milieu.
KPMG decided to explore the next questions on applying Deep Learning to the images of Stichting Natuur & Milieu in a three-week feasibility study conducted by two data scientists. The specific Deep Learning algorithm type that was chosen was a Convolutional Neural Network, most commonly applied to analyze visual input. We implemented multiple data augmentation techniques to especially overcome the large bias in the data set. Despite this effort, we still encountered the common problem of overfitting.
Facing the overfitting problem
Overfitting refers to the problem of training a model to such an extent that it stops generalizing knowledge and starts “memorizing” exact training examples instead of learning from the patterns in the images. The models fit the training data too well, including inherent variations, irrelevant features and noise. The result is a too complex model that performs extremely well on the training data, but when it needs to classify data that it hasn’t seen before, performance is poor. The opposite of overfitting is underfitting: when a model is too simple to catch the complexity of data. Models that are overfit or underfit are often not useful for real-life situations. See Figures 7 and 8 for graphical representations of these concepts.
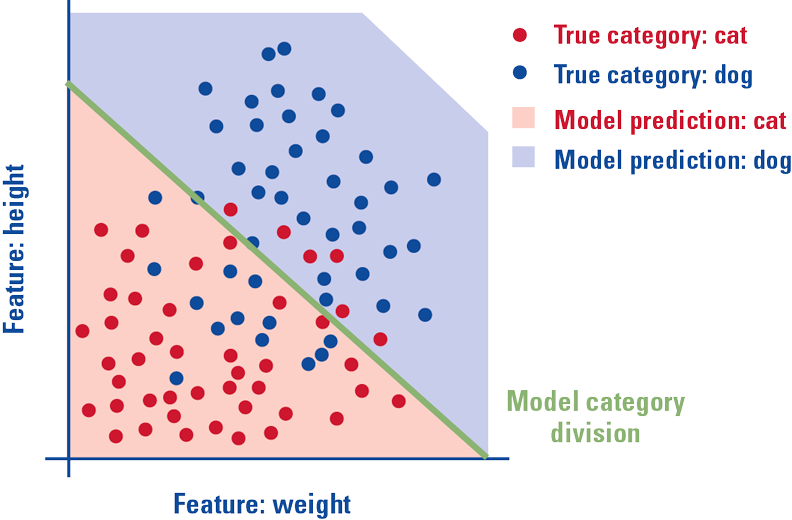
Figure 7a. This figure shows a trained model of the cats and dogs example data set. The dots are the photos of cats (red) and dogs (blue), the green line resembles the model, and the colored areas indicate the model predictions: if a dot is located above the green line, in the blue area, the model predicts that the photo contains a dog. [Click on the image for a larger image]
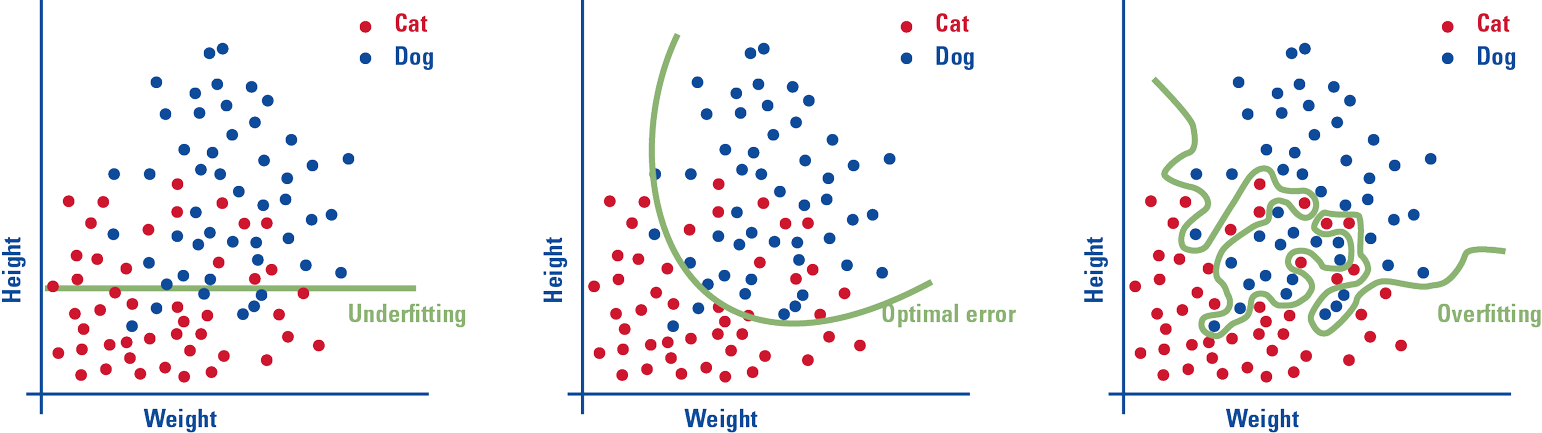
Figure 7b. On the left an example of underfitting: the model is too simple to grasp the complexity, it just classifies all animals lower than a specific height as cats. In the center we see a model that is optimized: not too simple, not too complex. Although the training still has some errors, the test error is minimized and the general pattern is grasped. On the right we see a model that is overfitting: the model is too complex to generalize the pattern. Although there are zero training errors, the model won’t be able to perform well on examples it hasn’t seen before. [Click on the image for a larger image]

Figure 8. Balancing out training rounds (“epochs”) and model complexity to find the best fit and prevent under- or overfitting. During training it is important to keep searching for this optimum, for instance by measuring your training error and comparing it to the error on your independent test set. [Click on the image for a larger image]
Some examples to help understand the concept:
- Huskies being classified as wolves because the model concluded that the best indication of a picture containing a wolf is snow in the background. Perfect example of not representative training data where all wolves had a snowy background (see Figure 9).
- Predictive maintenance use cases, where high model accuracy can be achieved because the data set is so biased towards the “normal” (no indication of failure) scenario. The model is almost always correct, except in the extraordinary situation that a failure is about to happen, which obviously is the exact situation that needs to be recalled.
- Overfitting happens a lot without Machine Learning too. You might have heard clauses like “This soccer player never missed two penalty kicks in a row” or “My grandmother has been smoking her whole life and became 100”.
- And metaphorically:
- Underfitting: Try to kill Godzilla with a fly swatter.
- Overfitting: Try to kill a mosquito with a bazooka.
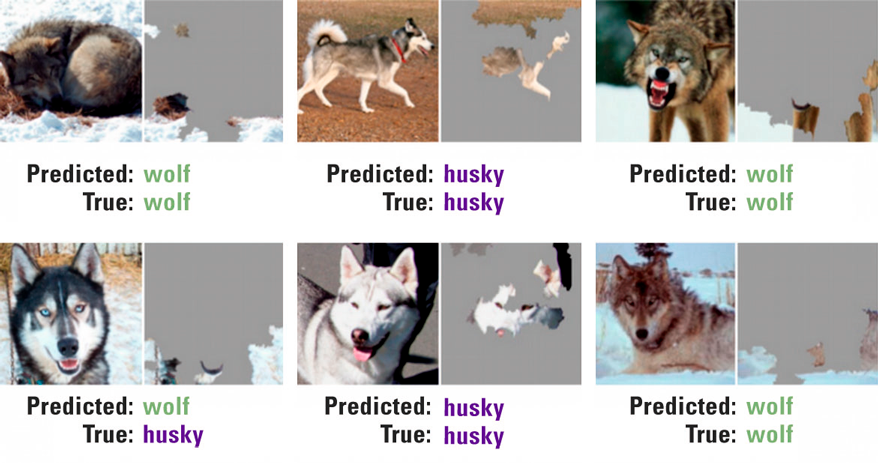
Figure 9. Another way to understand whether your Deep Learning model is overfitting or not performing the way it should although the errors show positive results, is visualizing the features that are used by your model. The above well-known example shows the features (pixels in this case) used to classify photos into huskies or wolves. Although the prediction is correct in 5 out of 6 test images, the problem becomes apparent what we look at what the model is basing its classification on: whether there is snow in the background or not ([Ribe16]). [Click on the image for a larger image]
Anyone who ever tried Machine Learning or Deep Learning has encountered overfitting: you either actively try to prevent overfitting, you find out that your model has overfitted when you evaluate its performance or you unaware of the overfitting problem and have never tried how it performs on examples it hasn’t seen before. Following the analogy with the human learning, we would call this respectively “conscious competence”, “unconscious competence” or even “unconscious incompetence”.
To decrease the chance of, or amount of, overfitting, several options are available. These can be categorized in two types:
- Enlarge or/and improve the input data set (label more data / augment data / balance the data / …)
- Apply techniques to prevent overfitting (regularization / dropout / less complexity in the model architecture / …)
Key to those methods is awareness of overfitting and implementing a way to detect overfitting. This starts with separating your data set into a separate training, validation and test set, allowing for an independent measure of the performance of the trained model. When your model performs significantly better on your training set than on your test set, you know some form of overfitting has taken place. We also saw in the husky versus wolf example that a very informative way to understand how a Deep Learning model classifies images is visualizing the features that the model found to base its conclusions on [Ribe16].
During the feasibility study, the above approach was followed and the data (106 sites, 318 photos in total) was separated in three independent data sets. With these three data sets we performed the actual model training (training data set) and evaluated the general model performance, like overfitting (validation and test data sets). Although 318 photos for these very visible features was a reasonable number for starting to train a first model, the small scope of the data left no room for errors and a significant imbalance in the data set caused a large bias. 80% of the 318 images had “none or minimal” as the answer for the duckweed categories. The remaining 20% was split into the other three options, leaving only a few dozen examples in these categories. When training a CNN on this data, it became really good in predicting the majority category (“none or minimal”) and very bad in the other categories. Hence the model was severely overfit.
Therefore, we applied data augmentation to enlarge the training set and reduce the bias, using a non-complex model with fewer “free parameters” – we even asked for more expert labeled examples – the model kept overfitting before a reasonable test error was achieved. This is shown in Figure 10, where we see a strong indicator of overfitting: training accuracy getting much higher than the validation and test accuracy. One of the visualizations that most clearly indicates how the model is overfitting in our case, is called a confusion matrix. In this visual, all predictions of all categories are mapped in the data set categories. In the confusion matrix in Figure 11, it is clearly visible that all predictions point to the largest category: the best solution that the model could find was predicting all images as being part of this category, reaching an accuracy of 60%. The model simply hasn’t encountered the other categories enough to understand that these are different categories.

Figure 10. Accuracy plot from the feasibility study on the duckweed categories, where all training rounds (“epochs”) are validated against the training, validation and test set. It is clear that the results for the training set keep increasing, while on the separate validation and test set, the accuracy has reached its maximum very early at 60%. This is a clear sign of overfitting. [Click on the image for a larger image]
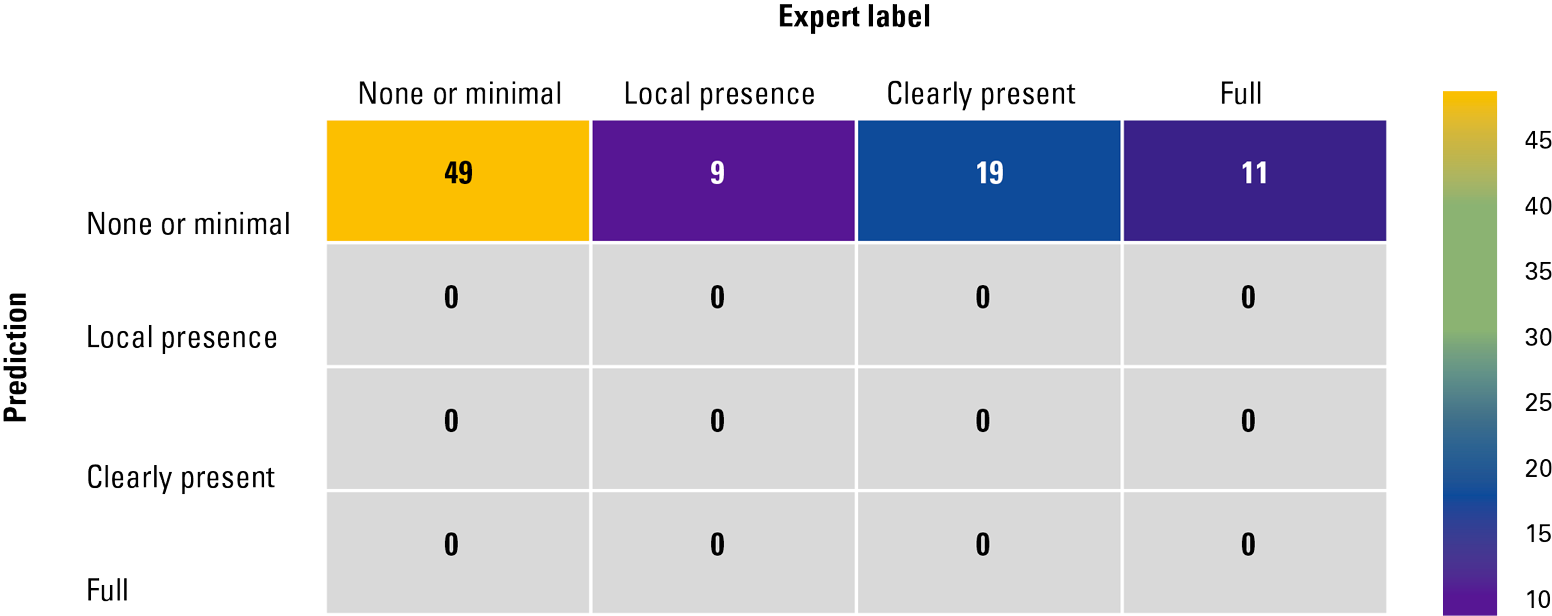
Figure 11. Confusion matrix from the feasibility study: all model predictions for the test set of 88 photos point to the “None or minimal” category, giving the highest achievable model accuracy of 60% for the independent test set. The model clearly is not able to generalize knowledge about the four categories, but it is overfitting. [Click on the image for a larger image]
Conclusion
As we have seen, exploring Deep Learning for a defined use case is in many ways dependent on the data set. Most measures that improve performance of applied Deep Learning models are aimed at making sure that the model learns to draw the right conclusions during training – which all come down to preventing overfitting. As you may have noticed, we have not discussed the comparison of different types of Machine Learning models and how to choose the best one. We would definitely advice getting guidance on what type of model is suitable for your use case . But for most use cases, it will not be worth it to go to great lengths to find the strongest model, as the role that data plays is so much larger. Andrew Ng mentioned this during one of his Stanford lectures: “It’s not who has the best algorithm that wins. It’s who has the most data.” ([Ng13]).
One of the major fallacies seen today in the data science field is the blind focus on Machine Learning. The means become more important than the ends and people end up solving the wrong problem. The basics we propose start with the right use case: what problem do I need to solve and can I apply Machine Learning to my use case? These are just the very first questions one needs to answer before even attempting to train the first model. The uncertainty whether the use of Machine Learning works for a given a use case is inherent in data science projects, and it is the reason why we always suggest a phased approach to data science: start exploring in a feasibility study, then move towards a proof of concept, then implement the model in a Minimal Viable Product, pilot this Minimal Viable Product with key business users and only when all phases are successful, move towards “productionalizing” the model. Between every phase, consider the next steps, lessons learnt, the effort required and the business value it may bring before you decide to continue with the next step.
In our feasibility study for Stichting Natuur & Milieu, the basics were in place, and we explored the case. We took several measures to prevent and overcome overfitting. These did not solve the imbalance and hence the overfitting remained. Therefore, the results of the image classification model that was trained were not yet good enough to replace expert judgement. Although the data set was remarkably good, for the use case at hand it turned out to be insufficiently large and too biased to properly train a model. Future steps to improve this are aimed at balancing and enlarging the data set on one hand, and improving the data quality on the other, for instance by making the answer options more distinct and giving more guidance on how to take the photos.
Our feasibility study showed that it is possible to apply Deep Learning to the images from the water samples program. However, in order to get results that are better than the citizens’ input, the data set needs to be improved first. This is taken into account for the 2021 program as a first step, before re-assessing the next steps.
Notes
- In this article we will not go into image recognition use cases such as object localization (drawing a bounding box around one or more objects in an image), object detection (combines localization and classification), image segmentation (selecting the pixels in the image that belong to a specific object) or other more advanced types.
References
[Kriz17] Krizhevsky, A., Sutskever, I., Hinton, & G.E. (2017, May 24). ImageNet Classification with Deep Convolutional Neural Networks. Communications of the ACM, 60(6), 84-90. Retrieved from: https://papers.nips.cc/paper/2012/file/c399862d3b9d6b76c8436e924a68c45b-Paper.pdf
[Ng13] Ng, A. (2013, March). Machine Learning and AI via Brain simulations [PowerPoint slides]. Stanford University. Retrieved from: https://ai.stanford.edu/~ang/slides/DeepLearning-Mar2013.pptx
[Ribe16] Ribeiro, M.T., Singh, S. & Guestrin, C. (2016). “Why Should I Trust You?”: Explaining the Predictions of Any Classifier. Proceedings of the 22nd ACM SIGKDD International Conference on Knowledge Discovery and Data Mining (pp. 1135-1144).
[Russ15] Russakovsky, O., Deng, J., Su, H., Krause, J., Satheesh, S., Ma, S., . . . Fei-Fei, L. (2015). ImageNet Large Scale Visual Recognition Challenge. International Journal of Computer Vision, 115, 211-252.
[SN&M20] Stichting Natuur & Milieu (2020). Waterkwaliteit van de kleine wateren in Nederland nog steeds onvoldoende [Summary of 2020 “water samples” program]. Retrieved from: https://www.natuurenmilieu.nl/wp-content/uploads/2020/10/NatuurMilieu_Watermonsters2020_samenvatting.pdf