


The implementation of improvements in the field of data quality, or even only the measurement of these, involves a great many aspects that must be addressed simultaneously in order to be successful. Moreover, the successful treatment of this theme demands an exceptional attitude. It involves having the audacity to relinquish the idea of perfection and the organization of measures that work according to a fixed principle: first completeness, then maturity. To some organizations, this approach means a radical change, one that must be adequately supervised.
In this article, the authors cover both the content-related aspects of data quality and the way in which substance is given to data quality in a practical case.
Introduction
The importance of data quality requires little elucidation: in a dynamic environment, organizations are expected to react ever more rapidly. To do so requires accurate and relevant information, information that must be extracted from exponentially expanding quantities of available data. These expanding quantities of data are stored in an increasingly complex IT landscape. The integration of IT systems is evolving; systems both within and beyond the organizational limits are being integrated, data is being exchanged. Management is increasingly realizing that data is an important asset with great potential. However, just how this potential can be exploited and what precisely is needed to do so is often not clear. Although the importance of data is unquestionable, this topic often receives too little attention.
In addition to the quality of data, emphasis is also placed on reliable accountability to the supervisory bodies and the financial markets. This being the case, there is a need for a demonstrable qualitative reporting process. The quality of data is a discipline-transcending theme (information security, management reporting, actuarial calculations, financial reports) in which models or perspectives from various disciplines are available to improve the quality of data. Because an insurer contacted us with the need for an integral approach to data quality, a plan to enhance the data quality was formulated in conjunction with this insurer.
Under the name of ‘Data Governance’, an organization-wide approach has been developed to guarantee data quality in a structured way. There is no absolute norm for data quality, as we will outline later. The key is to have control of the processes concerned with the input of data, the processing and interpretation of data, and with reporting on the data.
What is data quality?
In this article, we consistently use the word ‘data’. We refer primarily to the English definition of this word, and we therefore include the meanings ‘information’ and, where relevant, ‘facts’. Also, we will treat data as a singular noun, as this seems to be the universally accepted practice now (like ‘agenda’).
An initial concept of data quality might be: ‘the data must be accurate.’ But what does ‘accurate’ mean here? Let us look at a definition of data quality. There are various angles of approach in which we can find a common feature.
Richard Y. Wang, program director of the Total Data Quality Program at MIT, allocates four dimensions to the concept of ‘data quality’ ([Wang95]): data must be accessible, the user must be capable of understanding the data (interpretable), the data must be useful for the user’s decision-making (useful), and the data must be credible (believable).
Solvency II repeats a three-word mantra when referring to data quality [CP43], p.7): ‘appropriate, complete and accurate’, and regards data quality as a supporting actor in reports and calculations. The higher the data quality, the better the outcomes of calculations and the more reliable the report.
Jack Olson, a member of the Data Management International (DAMA) organization, writes on data quality ([Olso03]): ‘Data has quality if it meets the criteria formulated for the intended use. In other words: data quality depends just as much on the data itself as on the intended objective of using that data.’ The article on Enterprise Data Management, included elsewhere in this Compact, provides more information on data quality.
The common denominator within these definitions is: 1) the quality of data is broader than the actual accuracy of the data; and 2) there is no absolute norm for data quality. The latter is primarily due to the multiform nature of data: in different contexts, the same data may be experienced as being of varying quality. As an example, we will look at the quality aspect ‘timeliness’. A simple address is a timely item of data to an ambulance service when it is issued at the start of an emergency call. The same address is timely to a doctor, when it is available at the time of writing and sending an invoice, for example. Now, if we were to apply the doctor’s norm of timeliness to the ambulance service, the consequences could be very serious. In other words: what is timely to the doctor is too late for the ambulance service. What quality data is to the doctor may be a mess to the ambulance service. Therefore we can state that data quality is context-sensitive.
The consequence for the configuration of data management in organizations is that norms for the actual accuracy of data can only be steered by the user or users of these data. Accordingly, we can state that a corporate initiative to impose generic quality norms is most likely doomed to fail.
Parallel to the use of data, the importance of data quality has also increased in the past few years. And the end is not yet in sight. A growing number of people are currently having to deal with an increasing amount of data in their everyday work. An increasing number of people base their decision making on an increasing amount of data, in consolidated form or not. More and more companies are relying on data-driven processes. This is related to the fact that almost everything within a company has been stored in some dataset or another. Automation is the key word, and anyone who says ‘automation’ has already put faith in databases. For example, the personnel file is stored in a database, as well as the registration of hours, the billing records, the ledger. These datasets all support the production process, regardless of whether or not the company makes a physical product – not to mention the data that is (still) not stored and ordered in databases, such as e-mails, project documentation, contracts and correspondence. If there is mention of ordered storage in such cases, such as a document management system for example, it is often difficult to say anything about the quality of this data.
Companies operating in the financial sector are, in essence, data-processing organizations. Where a physical product is absent, the product can often be regarded as data. The quality of data in this context is therefore directly related to the quality of the supplied product. A bank has no physical production line that manufactures bank accounts or processes money transfers. The only thing that happens is that data is being changed.
With reference to our discussion of the definition, we can conclude that data quality is important, has become more important, but cannot be absolutely measured as it is context-sensitive. Let us examine how this worked out for an insurer, and how data quality was made tangible, measurable and executable in that particular case.
Data Governance project in a major insurance company
Just like every European insurance company, this particular firm was engaged in implementing Solvency II (SII). During the implementation, it was necessary to pay special attention to the sections dealing with healthcare and non-life insurance (e.g. motor, fire). The Dutch situation allows deviations from the SII standard model, and these deviations produce added value, predominantly in these areas. Several aspects are elucidated in Frame 1.
Frame 1. Standard model versus internal model.
This is a brief contextual course for those who are not familiar with Solvency II. SII comprises a set of regulations whose aim is to ensure that the financial reserves of an insurer are sufficient to cover the insurer’s obligations. For this, Solvency II maintains a strong risk-oriented regime. On the basis of an estimated risk, the estimated damage expenditure can be calculated, and subsequently the estimated sum in financial reserves.
Solvency II comes with a ‘free’ standard model that applies to the entire European market. The risks on the European market are generalized and this estimation of the risks is made on the ‘safe’ side: better to have lots of reserves than too few.
To some insurers, the actual risk exposure is much lower. If they were to use the standard model, they would have to have unnecessarily large amounts of reserves – money that cannot be released or invested. A simple example is the damage risk in the world of automobile insurance. The standard model takes into account the whole European market, and thus also the more damage-sensitive countries around the Mediterranean and in Eastern Europe. The authors of this article wish to abstain from any kind of international characterization, but the fact is that damage-related expenditure is higher in such countries, perhaps because people there drive less carefully, the circumstances are more dangerous, or the general state of maintenance of vehicles and roads is lower. We do not know.
A Dutch insurer benefits from the application of an ‘internal model’ process. The insurer may devise an own model that covers the specific circumstances under which it operates. After the supervisory authorities (in the Netherlands, that is the Netherlands Bank) have approved the model, the insurer may use this model instead of the standard model for (a part of) his insurance activities. The idea is that the internal model gives a better assessment of the risk (read: lower), so that the sum that ought to be kept in reserve (the capital requirement) is also lower. Thus, less money is earmarked for reserve capital, and more is available for other initiatives.
The model that is applied thus determines the capital requirement, but almost all other stipulations in Solvency II apply to both variants. We wish to devote special attention to the requirements related to reporting. Integral components of all reports within SII are:
- the quality of the data must be demonstrable;
- the quality of the process that leads to reporting must be demonstrable.
EIOPA, the European Insurance and Occupational Pensions Authority (www.eiopa.org), has the task of preparing and designing European regulations in this area. EIOPA is an independent advisory body for the European Commission and the European Parliament, which ultimately determines the rules.
For Solvency II, this occurs in the form of recommendations, draft texts and consultation papers. These documents cover the requirements with regard to data quality, for example, within the Solvency II context. They are voluminous works. In this article, we shall suffice with the summary that the texts still have to be interpreted in all cases. (See Frame 2.)
Frame 2. EIOPA on the appropriateness of data ([CP43], p.8).
3.8 Data is considered to be appropriate if it is suitable for the intended purpose (e.g. the valuation of technical provisions, setting of assumptions) and relevant to the portfolio of risks being analysed (i.e. directly relates to the underlying risk drivers).
3.9 In particular, to be appropriate for valuation purposes the data needs to be representative of the portfolio of liabilities being valued and suitable to be used for an estimation of future cash flows (consistent with a prospective view on the behaviour of the relevant risks).
Insurers thus still have quite an amount of work to do. Which interpretation should the insurer give to these texts? How can the insurer arrange that the underlying interpretations are in mutual agreement? How can the insurer subsequently make these interpretations measurable and demonstrable? The supervisory body asks the insurer to respond to the above-stated questions and then judges whether or not the relevant requirement has been met.
The Battleships model
In conjunction with this insurer, KPMG created a model to meet these challenges. The starting points of the approach were: 1) distinguish between aspects at group level (referred to as ‘Big G’) and aspects for each process/department/system (referred to as ‘little g’); and 2) it is surely not the case that there has never been a response to the issue of data quality. So, we should ask ‘what do we have?’ instead of ‘what are we lacking?’.
The task that lies before us seems to be considerable. Analogous to the question ‘How do you eat and elephant?’, the answer to this challenge is also ‘bit by bit’. Ultimately the whole project is accommodated within an integral approach with six layers of abstraction: governance, data management, definitions, AO/IC, data logistic chain, and data quality.
These layers arose on the basis of an analysis of diverse theoretical models ([DAMA], [DGI], [CP43]). For each layer, measures were subsequently drafted, 69 in total. Furthermore, quality criteria were formulated for each measure, and examples and templates were set up.
The project team sought ties with various initiatives (processes and projects) in order to: 1) guarantee that all necessary measures are given substance; 2) ensure that no double work is performed; and 3) pursue a phase-out of the project (data quality should be structurally embedded in the production line, not in a temporary project).
A crucial step within this process is the awareness that data quality is measurable, albeit not absolutely measurable. There is no general standard for the quality of data, and certainly not in an organization in which many different people are employed. The validation of data on the basis of business rules (such as ‘turnover > profit’, and ‘initial situation – reduction + increase = result’) gives an impulse but can never be exhaustive.
Frame 3. TRUST, data quality and the data logistics chain.
Although the concept of ‘trust’ is not used in the framework, an understanding of this concept is crucial to rolling out the framework in a knowledgeable way.
With the term ‘trust’ we mean the elusive quality that we humans automatically attach to every piece of information and which we evaluate in the light of the person or instance that supplies that piece of information. Trust has little to do with the actual quality of the data. Many people will evaluate advice on stocks and shares from a street-newspaper vendor as being of a lower quality than similar advice from a large bank, although this says little about the true quality of the information offered.
We could evaluate trust with a report score. We give the street-newspaper vendor a 3 (out of 10). Strangely enough, he does use the correct terms, which makes him more credible, but we wonder why he is still selling street newspapers. We give the analyst at the bank an 8; after all, this major bank has placed trust in him so the information must be worth something.
If we pass on this same piece of information to someone else, a new trust score comes into the game, that between us and the other person. The data journey is thus connected by a series of trust scores. We can unleash all kinds of principles on this series: arithmetic average, as strong as the weakest link, etc.
Without knowing the real quality of the data, we can nevertheless say something about data quality at the end of the line. If, without exception, high trust scores are associated with the information, this information must be good. Indeed: the fact that high trust scores are present almost automatically proves that the data is of a high quality. Apparently it fulfills the requirements of the intended use. High trust scores imply that many people have been able to work with the data in accordance with their own needs. And, as we have already seen, that is one of the important components in determining data quality!
If, from now on, we refer to the logistic process of data collection, processing and transfer as ‘data logistic chain’, we can state that the data quality in this data logistic chain is relatively high. At least, the data quality is certainly higher than in a chain with lower trust scores. Therefore, a company ought to pursue a trust score that is as high as possible on each step of the data logistic chain.
The Battleships model is directed toward the processes that occur around the data, rather than toward the data itself. This includes processes of elaboration, migration, interpretation, transformation and checks. If the standard against which these are measured is high, this should have an influence upon the quality of the data. In other words: if, at each step, the criteria governing the data are sufficiently strict, and given the fact that the data has reached the end of the logistic chain, this must logically lead to the attainment of a certain quality level.
The Battleships model makes use of the distinction between ‘Big G’ and ‘little g’. The notion behind this is that data quality is influenced on all levels. It begins with a decision-making structure and a process to realize norm formulation and prioritization. This activity does not take place at the level of the data itself, but probably occurs organization-wide and via higher management: ‘Big G’. The much-discussed term ‘ownership’ is often expressed in this context.
On the other hand, the activity must be executable for personnel who are engaged in data-entry or the processing of data. They need more and different guidance to that provided in the EIOPA texts. We call that ‘little g’.
An example of a ‘Big G’ measure: the development of a ‘data dictionary’ by means of which an unambiguous definition is stated for relevant data, so that it becomes clear which significance ought to be attached to data. An example of a ‘little g’ measure: the closure of a contract to formalize the data supply between application X and application Y. With this, it becomes evident who should supply what data and with which frequency, and the way in which this process is controlled. By articulating the rule at work-instruction level, a framework is created that can be seamlessly integrated with everyday tasks. Indeed, in doing so, it becomes an invisible component of everyday work.
Layer by layer
The integral approach means that all facets of data management must be addressed. By dividing them into layers, a group structure arises that helps in the designation of measures for each layer (see Figure 1).
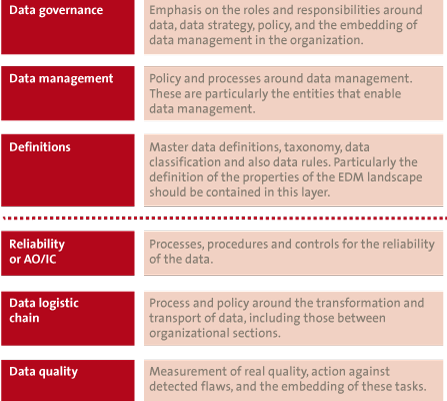
Figure 1. The six layers of data management and the measures for each layer.
The Data Governance layer comprises mainly the management model and the framework within which action is undertaken. This layer is typically intended for policy makers and higher management, who can emphasize the importance of data quality through their sponsoring.
The Data Management layer contains the elaborations of the strategy inasmuch as they affect data management.
The Definitions layer subsequently defines the playing field.
These first three layers are generally valid for several departments or several organizational units. For this reason they are summarized in the term ‘coordination’ or, in the case of this insurer, ‘Big G’. They are the boundary markers within which data management takes place.
The Reliability layer, or AO/IC, contains applicable measures and controls to guarantee the reliability of data processing. This layer accommodates KPIs directed toward reliable data processing, as well as work instructions and tooling.
The migratory behavior of data is dealt with in the Data Logistic Chain. The whole process of moving and transforming is called the data logistic chain (see also Frame 3). The measures that must be applied are of a different nature due to the fact that they are generally oriented toward the security and integrity of the transport and the processing.
In the Data Quality layer, finally, the actual data quality is measured, monitored and adjusted on the basis of the norms established in the other layers.
The lower three layers are directed much more toward the execution of the policy and its application, and that is why they can be summarized under the term ‘execution’ or, in the case of this insurer, ‘little g’.
Whereas in the top three layers the implementation of measures is principally singular (per company, or operational unit in a large organization), in the lower three layers the measures have to be applied just as often as there are data logistic processes: their working must be demonstrated in an integral fashion, so no system, process or transformation can be disregarded.
Weakness of the model: a concrete life jacket?
We are aware that merely emphasizing the process does not guarantee qualitative output. After all, if someone enters pointless data that survives a whole chain of controls, the chain will also end with pointless data (the well-known example of the production of a concrete lifejacket). On this theme, the following remarks can be made:
- If ‘pointless’ data is the highest achievable aim, such as a sales planning schedule for a new product in a new market for example, the information at the end will be nevertheless be of the highest quality, with one nuance: within this context, for the intended use.
- The factual quality of data is subject to measures in the framework. Apparently there is no unambiguous application in the framework, and therefore the total integrity cannot be guaranteed. It is important to act according to the measures in the framework when formulating the planning schedule and performing market research.
Experiences from real-life practice
We have gained a number of valuable experiences with the process, some in the shape of lessons learned, others in the shape of preconditions. Practical experiences have been categorized into three important segments of model application:
Segment 1. Determination of the framework
- Begin by formulating the criteria and wishes with regard to data quality (top-down). Some of these are already known (the rules and regulations), others are subject to change (interpretation of the supervisor). The type of organization is also important here. The most conservative participant will apply a different set of criteria than the discount newcomer.
- Parallel to the top-down inventory, it is useful to make a careful inventory of the measures already in force (bottom-up). The measures present are listed and connected to the necessary measures to be imposed. In this way, a framework relevant and specific to the company in question arises.
- Combine the criteria, the wishes and the measures present into ‘Big G’ measures and ‘little g’ measures. Define each of the measures clearly (practice what you preach), seek out a subject matter expert, and check the integrity of the entire model. Assess the articulation of the measures at the appropriate level. Does the measure speak the same language as the functional manager?
- Make the measures as tangible as possible and, when doing so, pay attention to the different levels within the organization. What appeals to the CFO is different from what appeals to the manager of an operational department, or even the member of staff who processes the ledger entries.
Segment 2. Control of the playing field, completeness before maturity
- The framework can subsequently be used to ‘treat’ the data logistic chains in order to gain insight into the playing field. This will show up the blindspots and identify the missing measure(s). An important consideration here has already been mentioned: completeness before maturity. In other words, having no blind spots is ultimately more important than maturity. An integral overview of the data logistic chain is more important than knowing that there is a high degree of maturity at certain points in the chain. The reasoning behind this is relatively simple and is related to the notion of ‘the weakest link’. Very high quality in the first step will be undone by very low quality in the second, let alone the complete lack of any control mechanism in this second step. In the latter case, it is even impossible to make a statement about the quality! ‘In control’ means knowing what is functioning well and what is functioning poorly. That is why completeness is so important. As mentioned, having an overview over the whole playing field gives insight into the blindspots. This overview helps with the formulation of an improvement plan, and is also an integral part of being ‘in control’.
- Lucid communication is needed to present the broader perspective of data management. In technical realms in particular, data quality is often linked to ‘data lineage’: the technical perception aimed at instilling certainty in IT systems via an audit trail. Here, the attitude change we discussed in the Introduction, is needed. The following is important when setting up the process:
Segment 3. Structural configuration of measures
- Make a direct attempt to prepare a phase-out of the project team. Guaranteeing data quality is an operational activity and the responsibility must therefore lie within the normal operational management lines. Enhancement of the data quality emanates from actions in everyday work. Therefore, it is essential to pay attention to the transfer of tasks to the line organization, as well as to aim at a minimum impact on everyday operations.
- The formulation of improvement plans and the supervision of their implementation can best be left to the organization itself. In this context, it is best to regard the project team as temporary subject matter experts who can help and coach in the application of the framework.
- To give a structural character to the configuration of measures, the application of the measure can be made obligatory, or included in an improvement plan for the data logistic chain. The execution and the supervision of the measures can be done by the regular (line) organization and the (internal) auditor.
- A joint picture of weaknesses in the Battleships model may well be more important than an initial evaluation of the data quality. On the basis of this knowledge, you can immediately begin to formulate improvement plans by means of which the improvement approach can be shaped and the data quality enhanced.
References
[CP43] CEIOPS’ Advice for Level 2 Implementing Measures on Solvency II: Technical Provisions – Article 86 f: Standards for Data Quality (previously known as Consultation Paper 43).
[DAMA] Data Management International, Standards, http://www.dama.org/i4a/pages/index.cfm?pageid=3495
[DGI] Data Governance Institute, Framework, http://www.datagovernance.com/fw_the_DGI_data_governance_framework.html
[Olso03] Data Quality, The Accuracy Dimension, 2003.
[Wang95] Toward Quality Data, an attribute-based approach, 1995.