


Team Sunweb is searching for marginal gains compared to its sporting competitors. KPMG is part of their expert team. We provide them with insights from data analysis, help them with transforming their organization to be more data-driven and build a platform which the team uses to manage and plan their season and races. In this article we describe several projects and tools which we have created with Team Sunweb. We will dive into what is considered the optimal sprint, team time trial, real-time data analysis and digital performance platform. The fact that Team Sunweb won three stages in the 2020 Tour de France, shows that this data-driven approach pays off.
Introduction
Professional sports is one of the toughest businesses on earth. The competition is exhausting and in most cases there can only be one winner. In top sports, the entire company is built around one single person. Its sole business is to make that person excel and even exceed their own limits to be the best in their area of sports. A professional sports company is one big team that works for this person. We are part of such an amazing team: Team Sunweb. Team Sunweb is a professional cycling team that performs on the world’s biggest stage.
KPMG has developed a digital platform for the professional Team Sunweb cycling team. The digital platform supports the performance organization, the business of professional cycling. The digital performance platform consists of data analysis functionality and apps which support the riders, coaches, experts and management throughout the season. The performance app supports the development of the season line-up, race plans and individual year plans, allowing the different experts in the team to provide their input following a structured process. The performance data analyses provide strategic and tactical insights (see Figure 1). For instance, analyses of historical race results provide input to optimize the season line-up, and analysis of power data of young talented riders provides input to decide on development trajectories towards the men’s elite team. In this article we share insights on the analysis of the sprint train and the team time trial (TTT). The former is used by coaches to optimize race tactics, specifically when it comes to reaching top speed during the final sprint. The latter provides real-time insights to coaches during TTT practice to make constant adjustments to achieve the smoothest ride.

Figure 1. Performance app. [Click on the image for a larger image]
Sprint analysis: towards top speed
The goal of Team Sunweb is to have a minor competitive edge over the other teams as a minimum. Winning in cycling is one of the toughest goals. A rider competes against 150 to 200 other top athletes and only one can win. Increasing the chance of winning even by a small margin is huge in cycling. Having that competitive advantage over the other teams is needed to excel. In the partnership with Team Sunweb, we focus on this goal. Team Sunweb is provided with insights into optimal positioning and optimizing the number of supporting riders in the team (a.k.a. domestiques) through our data analysis. For example, it was found that the thought of “the more helpers the better” doesn’t apply. Too many helpers will make your sprint train inflexible, the optimal number of helpers lies between three and six in the final kilometers. The analysis is performed on the basis of video and power data analysis.
The sprint analysis focusses on optimizing the performance in the bunch sprint1 of a race. There are three key factors for success, namely positioning, helpers and insight. Insight is one of the most difficult aspects to measure but is partially correlated with the positioning and helpers. In our sprint research, we investigated the positioning of the rider and the number of helpers related to the success of a race.
Optimal positioning of a professional sprinter for a bunch sprint
Based on our research, we determined a sprinter’s optimal position for the last 10 kilometers of the race. There is a narrow bandwidth of positioning where a rider has the highest chance of success compared to other positions. This can be seen as the optimal positioning for the last 10 kilometers and has been presented to the performance team of Team Sunweb in a scorecard format to provide guidelines to the coaches before and even real-time during the race based on the composition of the leading breakaway group.
Gathering the data
We analyzed video data of several hundred races to determine the position and the number of helpers for a top sprinter. We selected only bunch sprint races and top sprinters. The top sprinters are selected according to a certain metric called the rider strength. The rider strength was calculated in a previous project together with Team Sunweb (The Grand Tour Analysis). This metric tells you how strong a rider is compared to the other riders in a certain aspect of cycling, for example sprinting, climbing or general classification. To make sure that a failure sprint is really a failure and a successful one really a success, the ten best sprinters according to the rider strength of each year are selected. This selection process is important for the validity of the analysis.2
Determining the best team size
After examining the positioning, we examined the team size. Team size is an important aspect in two ways. First of all, the more helpers, the less the key sprinter has to do to maintain a good position. Secondly, if a fast finishing sprinter has too many helpers around him, you might lose flexibility as a team and end up being left behind or restricted in tactics. The optimal number of helpers is determined using the same type of statistical analysis. This is calculated for various distances till the finish line, starting from the last 10 kilometers.
Team time trial: a smooth ride
The plan for an optimal team time trial (TTT) is essentially very simple. The point is that all riders reach the finish exactly by the time they run out of energy. Having energy left, means you could have gone faster; running out of energy before the finish means that your helpers will have to continue without you. The plan could be better executed using coaching that is based on insights from real-time data, which can yield up to 20 seconds on a TTT of around 30 kilometers. This is why it is very valuable to gain insights from data. Additionally, you have more control over the course of the race in a TTT compared to regular race stages. There are many possibilities to gain more insights. For example, in wind tunnels you can simulate real-live racing to identify optimal positioning for the least resistance and therefore the lowest energy consumption for your specific course.

Real-time sensor data analysis
We use sensors on bicycles and riders that measure three things: heart rate, speed and the power transmitted to the pedals. During training, since the use of live performance data is not allowed in competition, the data from those sensors can be sent to the cloud in real time and back to be presented on a dashboard in the team leader’s car. Using this type of technology only makes sense if you can properly model an optimal execution of a TTT. We developed this system in an innovation project together with the Technical University Delft (TU Delft) and Team Sunweb. This includes optimizing the time intervals for the lead riders. If you take the lead too explosively as a rider, it will take too much power. Taking the lead too gradually is also sub-optimal. TU Delft developed the ideal plan for a stage with mathematical modeling. Our system compares the actual performance to this ideal plan in real time. An important factor for feeding that model is to properly measure how long a rider rides in front (see Figure 2), because that strongly determines how quickly his figurative battery drains, and needless to say, the goal is to use those batteries optimally. Our model measures the lead turns (how long a rider rides in front) based on, among other things, the data on speed and power, and it determines the lead position with a 93% reliability. In addition, the system can only be used if the data arrive within a few seconds. However, the definition of “real time” differs between the commonly used BI tools and they take up to 10 seconds to refresh. That was not fast enough, so we built a solution ourselves to generate real-time insights for the support vehicle with a latency of less than 1.8 seconds.
The TTT system can be used during training and is used to prepare and evaluate the last training before a race on the actual race course. This makes it possible to train every exact moment and place at which the lead position changes during a TTT race. The data analysis that is used for this is automated and is part of the digital platform. The platform is the technical foundation which enables us to develop valuable use cases like this one for the TTT.
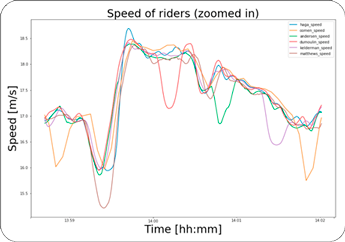

Figure 2. Team time trial analysis. [Click on the image for a larger image]
A data platform as a foundation to accelerate
In order to perform the above analyses properly, it is important to have access to advanced methods and techniques. An important first step is to replace the many separate applications (e.g. in Excel) with a solid data platform on which data scientists can build and run their analyses, giving the user the right insights. The data analysis platform makes it possible to link different data sources and it offers all the necessary (scalable) computing power to be able to perform complex analyses quickly. The staff of Team Sunweb processes data into insights more efficiently when working with our platform. We can analyze the expected performance and FTP values (Functional Threshold Power) of a few thousand riders in combination with countless races and the insights can be realized in a matter of minutes. The platform is gradually being further developed with new functionalities and is enriched with a growing number of data sources and algorithms that have been developed by the KPMG data scientists together with the Sunweb cycling team. Conceptually, this platform is well thought-out – with clear basic principles about, for example, the architecture and security that facilitate the growth model in terms of functionalities. The prioritization of the applications to be added is agreed on in close consultation with the experts of the performance organization and aligns with the team’s race philosophy.
The philosophy: an optimised plan is a prerequisite for optimised performance
In essence, it is very simple: if you can generate better insights with data analysis, you can also make better decisions about the race plan before, during and after the race. This is only possible if you have a clear plan. Strongly simplified: a rider applying 400 watts of force to the pedals for an hour, doesn’t mean anything; it only becomes valuable information when it is compared to the plan stating that the goal is to transfer 420 watts for that period.
Notes
- A bunch sprint is a sprint where a large group of riders is close to each other; this group is generally bigger than 30 riders.
- When a mediocre rider is sprinting and finishes fourth or fifth, this can sometimes be seen as a success when compared to the rest of the field. We therefore left out these riders to obtain and analyze a “cleaner” dataset.