


In addition to the traditional SAP authorization analysis (‘can-do’ analytics), the more enhanced did-do analytics enables you to understand the real risks resulting from Segregation of Duties (SoD) conflicts. There are many reasons to use did-do analytics for your SoD analyses. There are, however, also potential pitfalls to consider when using did-do analytics for your SoD analysis. Therefore, we have summed up the 10 most important lessons learned of did-do analytics.
Introduction
Authorizations in your SAP system enforce which transactions a user can execute, and which reports they can start, but it also determines all the critical transaction codes a user is not allowed to run. As part of the financial statement audit or just as a separate SAP authorization scan, the auditor can analyze the Segregation of Duties (SoD) conflicts and critical access rights – based on the assigned authorizations, making use of various automated tools.
The auditor could also review the statistical data, often referred to as STAD data, and make an analysis of whether the authorized transaction codes have been initiated by end-users. Such an analysis already provides an indication whether the company audited is at risk of SoD conflicts and critical access. However, this statistical data analysis has some significant limitations. First, the statistical data is usually only retained for the last two or three months, if available at all. This omission can be overcome by frequently downloading the statistical data and keeping it in a database in order to extend the look-back possibilities. Another, more important, limitation is the fact that this data is rather meaningless. When an end-user started a transaction code accidently or just out of curiosity, it is already recorded by the STAD data. Also, when the end-user has started the transaction code, it is still unknown what kind of activity this end-user has performed within the SAP program. Some transaction codes are used for both display and maintenance and is some cases the end-user only has used the transaction code for display activities.
In the Compact 2011 Special, an article was published on “Facts to Value” [Lamb11], and how data could be transformed into value-added data through data analytics. Data analytics allows us to see actually breached SoD conflicts by parsing transactional data, such as purchasing documents that contain information about the purchased goods, the user that created the purchase order, date and time stamp and purchase amount. This results in an overview of the financial impact of the access risk.
There are two levels of data analytics that can be applied to perform an authorization analysis. The data analysis can be performed by looking at all the users that have created a SAP document on one side and approved a document on the other side of the SoD conflict. In other words, the analysis doesn’t look for the exact same document that has been created and approved by the same user. The results most probably will contain several false positives; however, it already provides a good understanding of the access risks at stake, as it provides information if there are any users that have created entries for both parts of a SoD conflict.
To go one step further, the data analysis can also use the actual data that has been used or created, resulting in the actual breached access risks for the same purchase order, sales order, etc. The results can be used as input for a detailed analysis to identify whether critical SoDs have been breached and if unauthorized changes to master data and conflicting postings have been made. This information can be used to detect and mitigate the risk of Segregation of Duties conflicts.
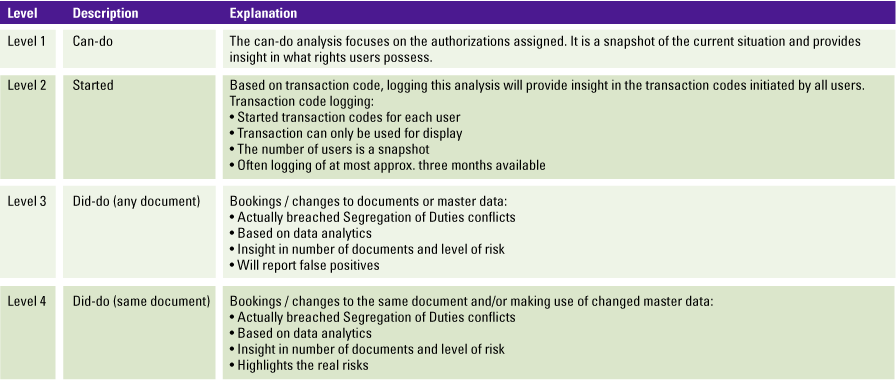
Table 1. Different types of SoDs explained. [Click on the image for a larger image]
This article focuses on the level 4 did-do authorization analysis where bookings and changes are applied to the same document. There are some important pitfalls to look for and some learned lessons to keep in mind when using these types of analyses.
Why use did-do analytics?
Actually breached SoD analysis results can be used for multiple purposes, such as:
- updating the SoD ruleset;
- mitigating access risks;
- improving the authorization setup;
- indicating fraud risks.
Updating the SoD ruleset
As will be described in lesson 1, the SoD ruleset used often does not contain all relevant transactions. The output of did-do analytics will provide information on the actual usage of transactions. If there are transactions in your output that are not in the ruleset, the ruleset can be deemed incomplete. By leveraging the output of your analysis to update the ruleset, the quality of SoD monitoring at level 1 will significantly increase.
Mitigating access risks
Can-do SoD monitoring (level 1) can result in high numbers of results, which is then interpreted as a ‘high risk’. For example: “there are 2,000 users that can create a purchase order and a purchase invoice”, every internal or external auditor will probably list this as an audit finding. However, if based on the output of did-do analysis it is found that only one user actually breached the conflict, for only a few documents, the result can be used to mitigate the access risk.
A combination of the previous two purposes can be leveraged to further improve the authorization set-up of SAP. When the analysis results show transactions that should not be used or many users that have access they do not really need, the authorization set-up in SAP can be adjusted with that information. The transactions that provide access to a certain activity can be limited and access which users do not use can be revoked. Those users will probably never notice their absence.
Indicating fraud risk
Some SoD conflicts are classic fraud scenarios, e.g. changing the vendor bank account (to a private account) and processing payments to that vendor. The did-do analytics will show the actual values that were processed for each of these scenarios and provide an indication of fraud risk.
Lessons learned (the 10 most valuable tips)
1. The GRC ruleset is not always accurate
The results of the did-do SoD analyses often reveal the transaction code that is used for the specific posting. When comparing the transaction codes included in the GRC ruleset with the transaction codes found in the did-do SoD analysis results, one can sometimes see discrepancies. For instance, custom transaction codes have been developed to post or release specific documents. These custom transaction codes are not always included in the GRC ruleset, leading to false negatives. Did-do SoD analyses deal with these false negatives and show all users that have a SoD conflict.
We also see that many of the actually breached SoD conflicts are caused by communication or system users like WF-BATCH. In this case, further investigation is required as postings might have been made in other applications (like SAP SRM), which stresses the importance to include cross-system Segregation of Duties rules in the ruleset. In other occasions, postings could be made via workflow tools or Fiori apps, where users actually do not have access to the SAP transaction codes to post a document, but are still able to create the relevant documents.
2. The more difficult the analyses, the less probable the SoD
There are organizations that require complex actually breached SoD. The combination between creating or changing purchase requisitions is not allowed to be combined with processing payments. To perform the analysis of actually breached SoDs basically means that multiple transactional tables have to be linked.
Examples include:
- EBAN (for requisitions);
- EKKO/EKPO (for purchasing);
- RBKP and RSEG (for logistic invoices);
- BKPF/BSEG (for financial postings).
In between these “process steps”, there might be other SoD controls in place, such as:
- purchase requisitions and release purchase requisitions;
- purchase order and release purchase orders;
- purchase orders and invoice entry;
- invoicing and releasing a blocked invoice (in case of differences);
- invoicing and payment proposal;
- invoicing and payment run;
- payment proposal and payment run.
Data analytics based on all these SAP tables (not mentioning the supporting tables) complicates the analysis. Additionally, the performance of the analysis might be very poor as it makes use of some of the larger tables within SAP. Most people in the field of risk and control would say that the likelihood of the risk occurring would be very low as there are multiple process steps involved and often multiple other controls are implemented within the process. The number of key tables involved in an analysis of actually breached SoD provides an indication of the process steps involved and as such, the likelihood that a critical SoD conflict can occur. Good practice is to just implement actual breached SoD on consecutively steps within a process and on those process steps with direct involvement of master data.
3. Difference between creation and change
Conflicts in the SoD ruleset often involve creation and maintenance of a document at each side of the conflict, e.g. creation or maintenance of vendor master data <> creation or maintenance of vendor invoices. In this case, analyzing the actual breaches of this conflict is not straightforward, as it can be split up in eight different conflicts (see box). All these conflicts use multiple tables which need to be connected in order to retrieve the appropriate results.
Example of conflicts with creation and change of vendor master data
- creation of vendor master data (tables LFA1/LFB1/LFBK/TIBAN) <> creation of vendor invoices in MM (tables RBKP/RSEG)
- creation of vendor master data (tables LFA1/LFB1/LFBK/TIBAN) <> maintenance of vendor invoices in MM (tables RBKP/RSEG/CDHDR/CDPOS)
- maintenance of vendor master data (tables LFA1/LFB1/LFBK/TIBAN/CDHDH/CDPOS) <> creation of vendor invoices in MM (tables RBKP/RSEG)
- maintenance of vendor master data (tables LFA1/LFB1/LFBK/TIBAN/CDHDH/CDPOS) <> maintenance of vendor invoices in MM (tables RBKP/RSEG/CDHDR/CDPOS)
- creation of vendor master data (tables LFA1/LFB1/LFBK/TIBAN) <> creation of vendor invoices in FI (tables BKPF/BSEG)
- creation of vendor master data (tables LFA1/LFB1/LFBK/TIBAN) <> maintenance of vendor invoices in FI (tables BKPF/BSEG/CDHDR/CDPOS)
- maintenance of vendor master data (tables LFA1/LFB1/LFBK/TIBAN/CDHDH/CDPOS) <> creation of vendor invoices in FI (tables BKPF/BSEG)
- maintenance of vendor master data (tables LFA1/LFB1/LFBK/TIBAN/CDHDH/CDPOS) <> maintenance of vendor invoices in FI (tables BKPF/BSEG/CDHDR/CDPOS)
The combination of these result sets is the result set for the SoD conflict.
Furthermore, when analyzing SoD conflicts with a ‘maintenance’ element, it is important to only check for updates (changes) in the records. Inserts (creation) of documents are already covered in the analyses with a ‘create’ element. Moreover, for the analysis with a ‘maintenance’ element, it could be beneficial to check which fields are changed. If the address of a vendor is changed the risk is low, whereas a change of the bank account is high-risk.
4. Fine-tuning (do not report all output)
The output of analyses of actually breached SoDs can be lengthy lists with (potential) conflict results. These lists need to be fine-tuned further to identify possible relevant items that need to be further investigated. Fine-tuning can be tailored in various ways. For example, by looking at the combination between vendor master data and purchase order entry. Are all changes made to vendor master data applicable when entering a purchase order? Should the actually breached SoD analysis only show results when key fields in master data, like the vendor bank account number or the payment terms have been changed. Even though there was a SoD conflict (a user can maintain a vendor and raise a purchase order), in many cases the changes to a vendor master data are related to adjusting an address or contact details, which are less relevant for the SoD conflicts.
The same logic could be relevant for purchase order entry and goods receipt entry. In case purchase orders are subject to a release procedure, the risk level could be lowered. (If the purchase order release is actually performing adequate checks on the purchase order, the vendor used, and the purchasing conditions applied.) Fine-tuning or categorizing the results of an actually breached SoD analysis is a good way to process and analyze the results of these analytics. It will allow a company to focus on critical activities that have occurred without effective SoDs in place.
5. Materiality, what is the value of the output?
The question behind each thorough analysis is: who is the audience for the results? If the audience is the authorization and security team, the perfect analysis result might be technical of nature, with details such as the transaction code used, the posting key, and some organizational values, such as company code and plant location. However, when the targeted audience is business-focused, these details might not be of interest to them at all. When ‘the business’ is the target audience for the results of did-do analytics, there are two main focal points:
- How many times was the SoD breached?
- What is the (financial) value that was at risk?
In other words, likelihood and impact. If a conflict has occurred 1,000 times, but the total amount that was affected in these 1,000 conflicts is only 1,000 euro as well, the conflict becomes irrelevant. On the contrary, if a conflict occurred once, but the transaction amount was one million euros, the conflict is very serious and further investigation will need to be conducted. Adding a monetary value to the results can help your audience to understand the output and take quick action.
Caution: when assigning a value to your SoD analysis, it is important to document the considerations. If the conflict is purchase orders vs. purchase invoices, there might be a higher value in one of the two. In that case, a decision needs to be made which value is reported and why. Moreover, if a part of the analysis involves creation and maintenance, duplicate documents might occur on the list. In such cases, the unique document value should be reported.
6. Master data is maintained beyond financial years
Did-do analytics enables interception of all master data changes performed in combination with all the transactions that result in a SoD conflict by any user. A common mistake is the selection of the period for which the data is downloaded and analyzed. For instance, only data maintained or changed in January is downloaded, because this reflects the scope for the analysis. However, master data could have been maintained or changed prior to this period. Therefore, it is good practice to download the changes to the master data for at least the last three months or even the entire previous year. To limit the file size of the download, a filter could be applied to only retrieve those changes that have a financial impact, such as bank details for customers and vendors and pricing for materials.
All in all, it is paramount to prevent false negatives in a did-do analysis. It is therefore important not to just download and analyze the period in scope, but also before and after this period.
7. Transactional data is entered beyond financial years
Besides master data, transactional data is also a very important element of each SoD conflict. Like master data when performing a did-do analysis, for instance for the month June, it is better practice to also download and analyze the data entered and maintained prior to the specific month in scope. For example, when analyzing the SoD conflict of entering a vendor invoice on one side and approving the same vendor invoice on the other side. Both activities could have taken place in the same month. However, it is also possible that the invoice is approved one or more months after the vendor invoice has been entered. Therefore, when analyzing just a single month (specific month in scope), one could end up with false negatives by not reporting the real risks.
8. Reconciling data with the source data is very important
For data analytics in general, it is always important to ensure your data is complete and accurate. To prove, reconciling the data with the source is crucial. There are several questions to be asked up-front:
- Is the period in which the data was downloaded closed or is it a moving target?
- Does the download contain a value (e.g. purchase orders) or is it data without value (e.g. master data)?
- Is the SAP-system setup to use old G/L (table GLT0) or new G/L (FAGLFLEXT)?
To verify completeness, the easiest way is to make row counts of the table you are downloading and then comparing them with your analysis environment (e.g. SQL Server or SAP HANA) once you have uploaded the data. However, if the system you are downloading from is a moving target, it might be necessary to make a row count before and after the download to ensure your download falls in between. E.g. if the table has 100 records before the download and 102 after the download, the 101 records in your data indicate that you are reasonably complete, provided that the target is moving.
Tip: for some tables in SAP, it is difficult to perform row counts as they are too big, and would cause the application to time out (e.g. CDHDR). In this case, multiple row counts can be performed such as row counts per class. It can also be counted by using transaction SE16H.
Another method which is often used to ensure accuracy of a data download is reconciling the general ledger tables (BKPF/BSEG in SAP) with the trail balance (GLT0 or FAGLFLEXT table in SAP). If it does not reconcile, it proves the inaccuracy of the data.
Caution: only reconciling your data with the trial balance is not enough, as this only proves the accuracy of the General Ledger tables.
In case the data is automatically interfaced to the analysis environment (i.e. SLT for an SAP HANA database), the completeness and accuracy can be ensured by properly governing the interfaces between the source system (e.g. SAP) and the analysis environment (e.g. SAP HANA).
Performing a did-do analysis provides very interesting information about conflicting activities that have been performed by a user. However, these activities should not immediately be classified as fraudulent user activities in a system. Consider that the organization has provided the authorization to perform these activities. These users might even have been trained in performing both activities, and might not even be aware that they are performing activities that are qualified as SoD conflicts and a risk when performed by a single person. Also, there are many examples where the local finance department only consists of a few staff members, and consequently, makes it impossible to properly separate duties at all. In these smaller locations, other controls (manual or procedural controls) might be in place that mitigate the risk. The analytics on actually breached SoDs can also be used to provide input to determine mitigating actions.
10. Level 3 analytics is good input for remediation
When looking at level 3 did-do analytics, the analysis is not tracking the same document, but performs the analysis from a user perspective. For example, which users have created a document and also approved a document? The results might contain false positives for obvious reasons, as the user did not breach the SoD for the same document. Nevertheless, there is a real risk. Often, if a user can break through the level 3 SoD, the user is also able to break it for the same document, and therefore level 4. Level 3 did-do analytics are less labor-intensive and less complex than level 4 analyses, as there is no mapping required on the document numbers. This makes the results of a level 3 best suitable to initiate remediation activities to resolve authorization issues and access risks in your SAP system.
Bonus: Do not overestimate the performance of your analysis system
As most of the did-do analyses involve a large amount of data from different source tables, the analysis environments performance will be impacted. Therefore, it is important to consider system performance in every sub step of creating the analyses. The following guiding principles can be helpful:
- use inner joins where possible, these are faster than left joins;
- create indexes on the key fields in each table used in the analysis;
- start with creating basic views which only contain the bare minimum fields and add additional fields (e.g. document names) in the output view only;
- avoid nested queries (and cursors);
- avoid using calculated fields in the JOIN and WHERE clause.
In some cases, performance might still be poor. For those special occasions, it can be beneficial to first perform a level 3 analysis and find out which users potentially have a did-do conflict. These users can then be placed in the WHERE statement of the analysis, in order to limit the result set and increase performance.
Conclusion
Did-do analytics are of added value compared to the traditional authorization audits that only focus on the authorization objects and values within your SAP system. The did-do analytics shows the real risk in terms of (financial) value that is at stake. We have summed up 11 lessons to get the most out of your did-do analytics.
Did-do analytics can be used to update your SoD ruleset; add transaction codes which are part of the did-do output to your SoD ruleset to improve the level 1 SoD results. Second, did-do analytics can be used as mitigating control for the outcome of level 1 SoD results; if a user has access to certain SoD, it doesn’t mean that this user actually breached this conflict. Third, the combination of the first two purposes can be a trigger and input for a redesign of the SAP authorization concept; to assign or remove certain authorization based on the did-do outcome. Lastly, did-do analytics shows the actually breached SoDs, including the value of the risk.
References
[Lamb11] Drs. G.J.L. Lamberiks RE, Drs. P.C.J. van Toledo RE RA, Q. Rijnders MSc RA, Facts to Value: Transforming data into added value, Compact 2011/0, https://www.compact.nl/articles/facts-to-value/, 2011.
[Veld14] M.A.P. op het Veld MSc RE, Drs. B. Coolen RE, Data & Analytics, Compact 2014/2, https://www.compact.nl/articles/maurice-op-het-veld-en-bram-coolen-over-data-analytics/, 2014.